
|
The S&P 500 cash index traded on Monday morning within 0.8% of its all-time high of 2940.91 set on September 21st of last year. That came after the market’s tear of almost four months now, in which it has rocketed up 24.4% off the low set the first trading day after last year’s Christmas Eve. This overwhelming strength will probably keep the market from busting meaningfully through the highs set seven(ish) months ago. Why? Let’s take a look at a few reasons.
At the current level nearly at the all-time high, traders and investors are sitting on the fence about the future market direction from here. On one hand, they’re wary about a bull run that has come so far, so fast and they have an itchy trigger finger just waiting to take profits. On the other hand, there’s fear of missing out should the market keep climbing like it has for all but a few months of the past ten years.
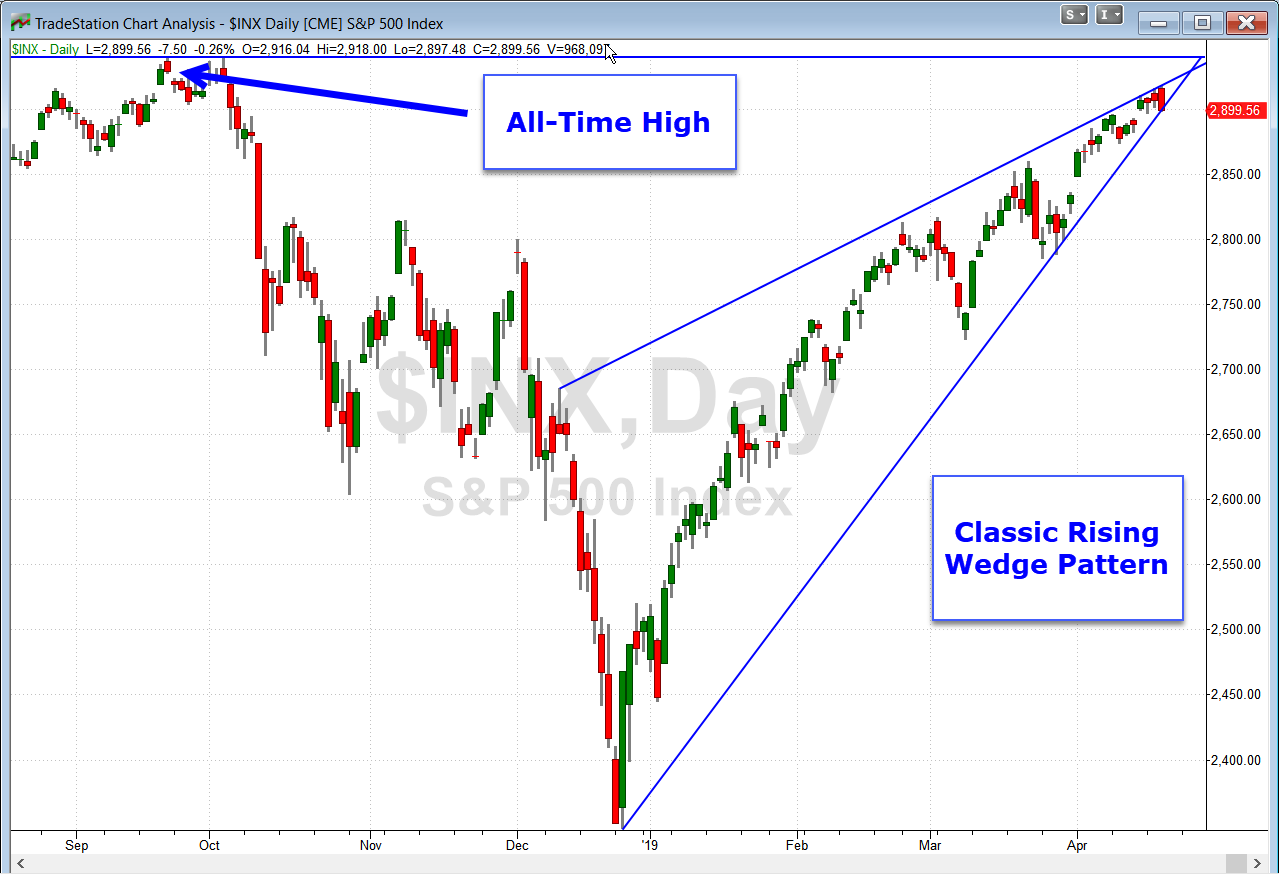
That double-mindedness most likely means that the S&P will meet some resistance the first couple of times that it tests the old highs. In addition to this fence sitting, we have a rising wedge chart pattern that has drawn some recent attention:
|
 |
|
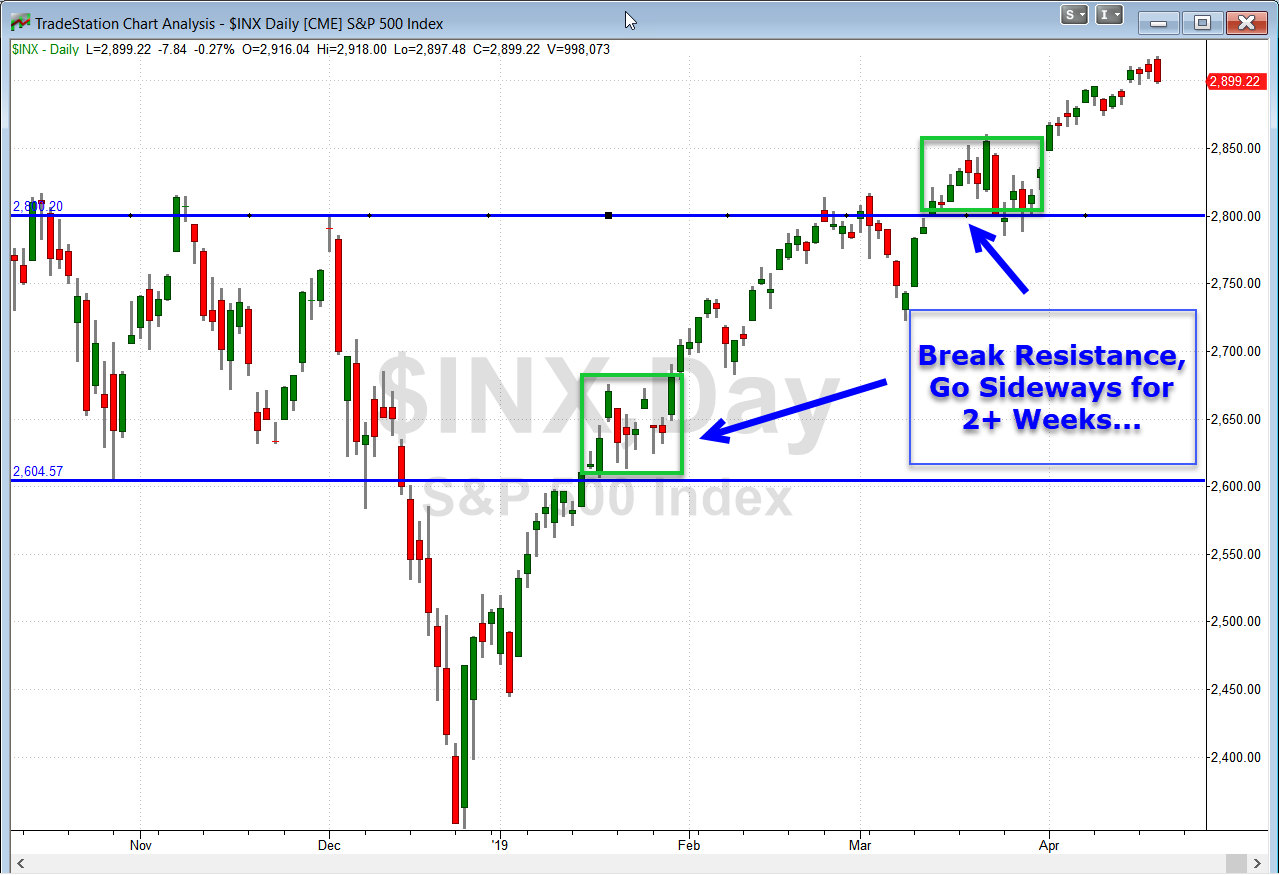
Further, the pullbacks during the post-Christmas Eve rally have all been shallow. We’ve even had some overbought situations work themselves out by periods of sideways trading. That happened when we cleared the two most important resistance levels on the way up shown in blue lines on the following chart:
|
 |
|
As you can see, multiple tries over multiple days finally pushed the market through the 2600 and 2800 resistance levels. I expect we’ll see the same kind of price action to get us through 2940. Then what? I see at least three reasons for more upside after we get through this next resistance level.
Why We’re Likely to Keep Going after S&P Price Breaks 2940
While I think the market will have technical struggles getting through the 2940 level, the “restful pause” that the bulls take while banging against that important level should only serve to give the market more rocket fuel to move higher – especially in the short to intermediate-term time frames. Here’s why –
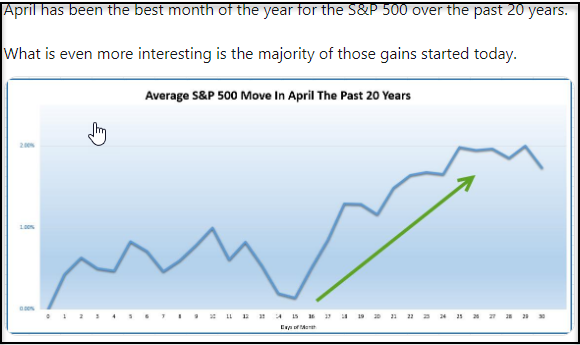
First, this is a seasonally strong period. April has been the strongest month of the year over the past 20 years. As we can see in the chart below from LPL Financial’s Ryan Detrick, most of the gains in April have come from the second half of the month:
|
 |
|
Second, I’ve highlighted in recent articles at the strength of the market breadth or how many stocks are participating in the move. This still holds true today.
Third, the head of the largest money management firm in the world sees a higher probability for upside from here as well for a different reason. From CNBC:
The rally in global equities may have further to go as more money jumps back into the market, BlackRock CEO Larry Fink said Tuesday.
“We have a risk of a melt-up, not a meltdown here. Despite where the markets are in equities, we have not seen money being put to work,” the head of the world’s largest asset manager told CNBC’s “Squawk Box.” “We have record amounts of money in cash. We still see outflows in retail in equities and in institutions.”
Bottom Line
My analysis says that pullbacks are still to be bought and we should get a few more chances as the market works through this next level of resistance.
Great trading and God bless you.
D. R.
|
Some observations that I have:
Adjusting for dividends, SPY is making new all-time highs already.
Even based solely on price, QQQ has broken out to record highs.
XLK has been in record territory for a couple of weeks now. Not even the Intel news posed a serious setback today (Friday).
It would appear that, should the market (S&P) push past resistance, tech could be the better bet; either straight or as a spread.
Your thoughts?