
 In my last article, we looked at one of my favorite ways to track market health — the cumulative breadth of the New York Stock Exchange. The bottom line of that article: the market’s rapid rise from the Christmas Eve lows has been supported by broad participation — lots of stocks have been helping to push the market higher.
That’s a contrast to many of the bull runs we’ve seen in recent years when only a few large tech stocks were able to overcome the underperformance of all the market’s mediocre minions…
What Two Versions of One Index Tell Us
We can see the outperformance of the broader market by looking at relative gains in two versions of one index — the cap weighted (or regular) S&P 500 index and the equal weighted S&P 500 index. The S&P 500 is a cap weighted index where the bigger companies in the index affect its value much more heavily than the smaller ones. When the price for the biggest companies in the index move, the index moves a lot. The equal weighted version of the index weighs all stocks from #1 to #500 equally so that no one stock or one group of stocks affects the index disproportionately.
Neither version is “better” than the other though looking at them both helps provide some insights about the market. Here’s a way to compare the two in annual performance back to 2004:
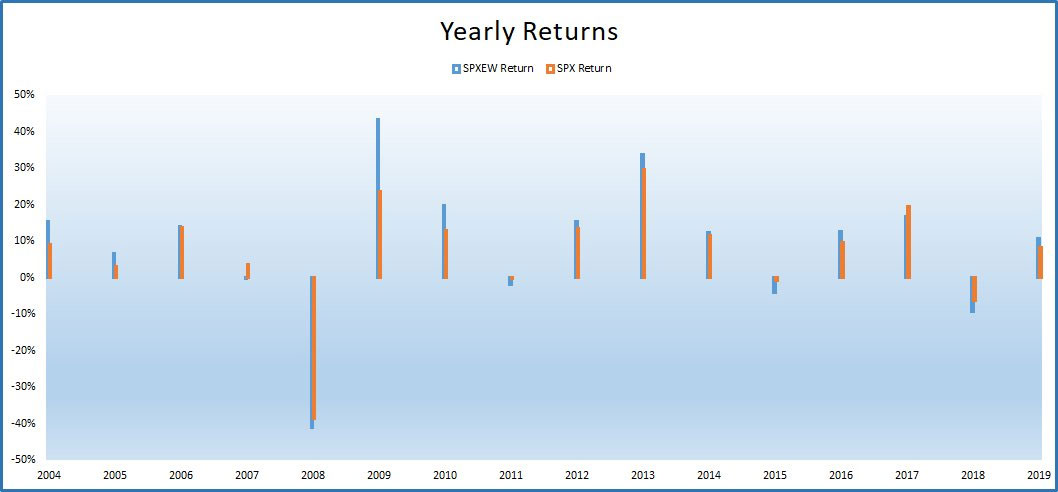
One of the few times that the cap weighted S&P 500 (red bars) outperformed the equal-weighted index (blue bars) was in 2017 — a year when a few mega-tech companies dominated the market. That then led to the down year we had in 2018.
Let’s look now at the run-up that happened in the spring/summer of 2018 before the 20% bearish correction in the fall/winter. You can see the relative performance of the two versions of the index for the whole year in the chart below but focus on the run up:
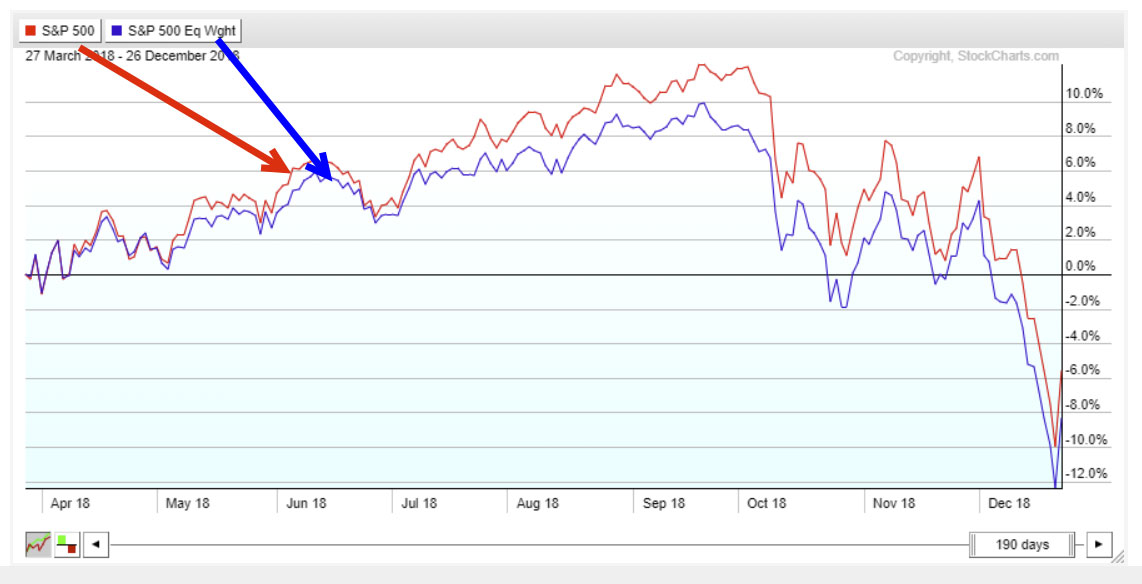
It’s pretty easy to see that for most of the second and third quarters last year, the cap weighted S&P 500 (red line) outperformed the equal-weighted version (blue line) of the index. By mid-September near the market peak, the difference between the two indexes had grown to about 2% over a nine month period.
Since the beginning of 2019, however, the tables have turned. See how the equal weighted index has been outperforming the cap weighted index:
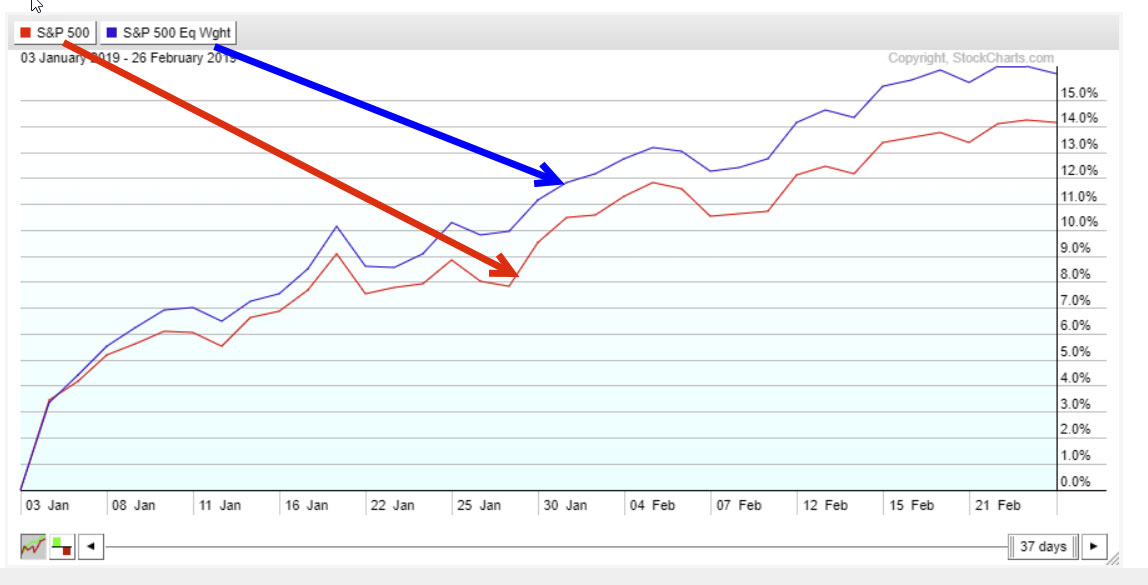
And this outperformance hasn’t been slight. The equal-weighted index has gains 2% greater than its cap-weighted cousin in just the first two months of 2019. More stocks are “pulling the oars” to propel this ship forward — a bullish sign for the intermediate term.
The Bottom Line
After running strong for two plus months now, the market is most likely due for a short-term pullback — though it should be modest. Meanwhile, the intermediate-term outlook for the market remains quite positive — absent any negative outside influences such as a flare-up in geopolitical turmoil.
Great Trading and God bless you,
D.R. Barton, Jr.