
 I’m doing my best to pretend I don’t have jet lag after returning from an amazing nine days in Scotland. To do that, I’ll keep today’s tip short and to the point.
Markets are acting like a proverbial cat on a hot tin roof — With every new step, the markets are likely to slide to new short-term lows or take a temporary leap in the air.
What was Wednesday morning’s hot mess? The central banks of India, New Zealand and Thailand all dropped interest rates further than expected. This got the global bond markets jumping with prices going up and interest rates diving. Then, German industrial production numbers came in down -1.5% for the month versus an expected slide of -0.4% and the bond yields slid to near record lows in the U.S.
As I write this in the late morning, there’s been a bit of bounce in bond yields and stock prices.
Volatility has spiked as the U.S./China trade and tariff tango added a new stanza and threw in the possibility of a currency war, as well. Here’s some prospective on volatility using two measures: intraday price ranges (shown as Average True Range or ATR) and the CBOE Volatility Index or VIX:
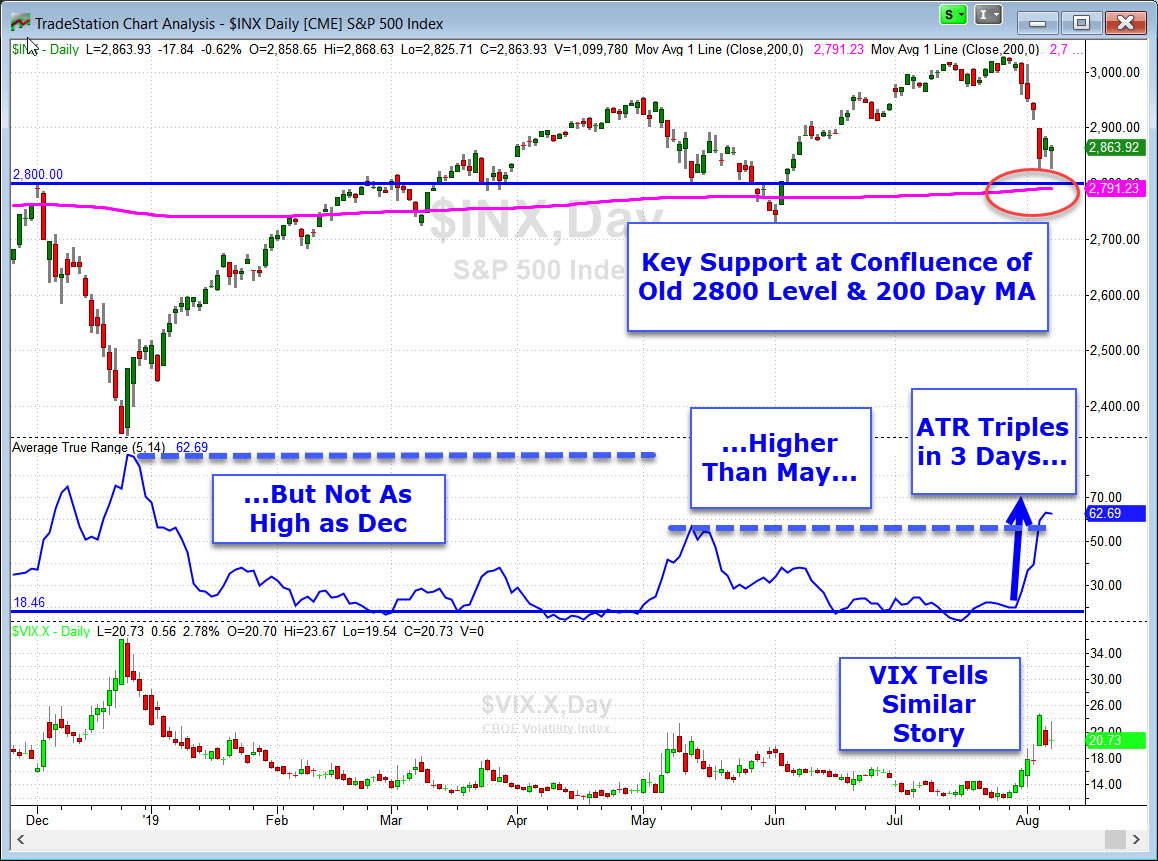
For now, headline risk should keep this volatility at elevated levels, though likely not at the 60 S&P point level for too long…
Of short-term interest is a chart that Tom McClellan posted this morning showing the spread between the Rate of Change (ROC) in the price of the S&P and that of T-Bonds. It gives a short-term measure of how drastic the flight to quality is at any given time. Here’s Tom’s interesting chart:
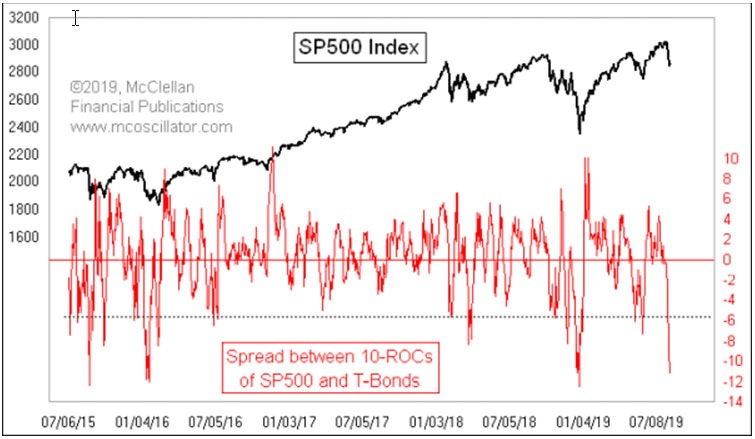
McClellan notes:
“The current deeply negative reading is officially low, and in small company in terms of past extreme readings. All of the similarly extreme negative readings have been associated with important lows for the stock market.”
While this isn’t definitive that we’ve hit a bottom (nothing is definitive), it does give a good indication that the bond pop and S&P drop have hit truly extreme levels relative to one another.
McClellan also points out a characteristic that this chart shares with the VIX indicator we looked at earlier — extreme reading in one direction (very high VIX & very low S&P vs. T-Bond ROC) have been historically predictive and tradeable. The opposite is not true. VIX can stay extremely low for long periods of time, and as we see in the chart above, the ROC spread tends to spike high at various points during a bull run.
What’s a trader to do? The transition from low volatility to high volatility markets is always toughest on swing traders. Day traders love the volatility. Long-term investors should have stops that are wide enough to live the single-digit market pullbacks. But swing traders have to adjust, adjust and adjust again. If you’re that swing trader, you’ll be tweaking your volatility-based component of your stop loss formula early and often.
Great Trading and God bless you,
D. R.