
The Presidential Cycle: Useful or “Rubbish”?
Today, let’s take a look at the broader presidential cycle, what the supporters and detractors say and see if we can draw any conclusions.
Presidential Election / Stock Market Cycle – Why All The Fuss?
The presidential election/stock market cycle was popularized (perhaps even originated by) Yale Hirsch his well-known Stock Trader’s Almanac. To quote Hirsch,
“Presidential Elections every four years have a profound impact on the economy and the stock market. Wars, recessions and bear markets tend to start or occur in the first half of the term; prosperous times and bull markets in the latter half.”
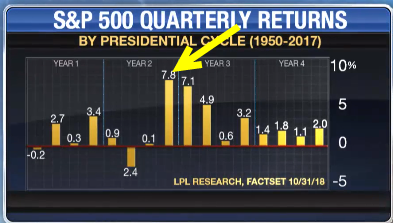
Hirsch provides data going back to 1833 for each year in the cycle and shows these results:
In short, in statistics-speak, there seems to be a descriptive advantage in the second half of a presidential term, with the pre-election year showing the strongest results and the post-election year vastly underperforming the others.
How Good an Edge is the Presidential Cycle
During national election years (both presidential elections and mid-terms) new analysts weigh in on the presidential cycle. One article was particularly dismissive about the statistical validity of this rather unique seasonal pattern. Since I’m about to blast him, I’ll not mention a name but the short version of his argument was that stock data before 1900 was not valid (fair enough) and that the remaining number of cycles since the (27) did not meet the standard for statistical significance that he quoted as 30. (Really?) And he ended the article there dismissing any seasonality claim with no further discussion.
Before we dig further into the presidential cycle and its supporters, let’s look at the statistical argument. First, we’ll amend Twain’s quote and add a fourth type of liar – the inadvertent liar who doesn’t understand statistics in the first place. And while trying not to bore everyone out there with a discussion on statistical significance, (if you’re looking for detailed mathematical descriptions of chi-squared distributions, google away…!) I’ll state that 30 is only a rule a thumb, not a statistical barrier or certainty. So categorically saying that 27 gives garbage results while 30 would be just fine is either naïve, inflammatory, or both.
So to see if the presidential cycle concept is really any good, I did a very brief literature search and found a peer-reviewed paper that was published in the Journal of Portfolio Management by Beyer, Jenson and Johnson entitled “The Presidential Term: Is the Third Year the Charm?”. Mr. Beyer, et al, apparently did their calculations properly and found statistical significance for the second half of presidential terms being stronger and the third year (for this cycle the year 2019), in particular, being the strongest.
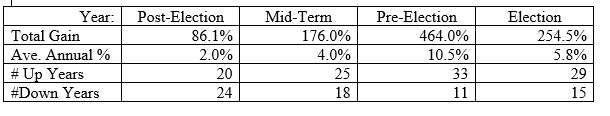
In addition to Hirsch and the journal paper mentioned above, the New York Times reported Ned Davis Research’s independently developed numbers for the presidential cycle as follows: 5.5% for year 1 (post-election in the table above), 3.7% for year 2(mid-term), 12.6% for year 3 (pre-election) and 7.5% for year 4 (pre-election). As you can see, this supports Hirsch’s original thesis.
So, Does Anyone Use It?
Many of the traders and researchers I work with on a regular basis do, in fact, pay attention to the presidential cycle. My good friend and stock research guru Marc Chaikin spent a good bit of time on a major TV financial show discussing the cycle and its effectiveness. In the same New York Times article mentioned above, no less a trader and analyst that Jeremy Grantham says that he and many money managers “will make bets based on the current (presidential) cycle”. As I have mentioned in articles before, Grantham’s track record and clear thinking make him a person I go to often for insights.
So what should the average retail investor/trader do with this information? That depends largely on your time horizon. 2019 could be shaping up as a rebound year (especially the first half of the year) based on the strong corporate earnings that continue, end of year seasonal strength and the aforementioned presidential cycle strength. But the bigger current headwind is the tariff troubles that are looming. I’m leaning toward expecting another bullish push before we see bear market territory. Write in to the email address below to let me know your take!
If you’ve found this article useful or thought-provoking (or both), I’d love to hear your thoughts and feedback – just send an email to drbarton “at” vantharp.com, and post a comment on this article on our new website. Until next week…
Great Trading,
D. R.