
 Yesterday, we had one of the first truly warm days in Delaware. Temperatures pushed toward 80 degrees F. I decided to go back to the serenity deck that we installed next to the stream that runs through our back yard. And when I got there, the sight of what was on the ground took my breath away. I saw a beautiful spring color palette that I can’t normally see through my backyard fence:

The forest floor had become a sea of deep green foliage and bright yellow flowers. I had always called these little bursts of color “buttercups” when I was growing up in the Blue Ridge Mountains of Virginia. I wondered what they’re really called…
So, I pulled up the Google Lens app on my smartphone and, viola! Within mere seconds I had a photo and description of the plant adorning the forested floor: scientific name – Ficaria verna. Also known as the fig buttercup, or Lesser celandine. Here’s a closer look:

The Google Lens app identified the plant so quickly! I looked online and found a Google blog post that said the app can now identify over a billion things. Pretty mind-blowing. I decided that I’d never want to play a game of 20 Questions against the app.
That parlor game of 20 Questions started in the U.S. back in the late 19th century as a game of deductive reasoning. It became a radio show in the 1940s and a similar version called Animal, Vegetable or Mineral was one of the earliest game shows on TV in 1952.
These types of guessing games have occupied children (and adult) minds for well over a century. The earliest questions in such a game, break things down into the broadest categories like animal vs. vegetable vs. mineral. It’s a natural thing for us to classify things in distinct categories. This is a shortcut that helps our brains think of the vast amount of stuff on the planet in a more manageable way.
We do the same thing in the trading and investing world. We tend to classify all the things that we trade into broad asset classes. Here’s a quick look at some of those asset class definitions:
- Equities are ways to sell equity or ownership of individual companies plus ownership of baskets of stuff like mutual funds and exchange traded funds (ETFs) that trade on stock exchanges. Add in options on stocks and preferred shares that hybrids between equities and bonds.
- Bonds or fixed income assets. These are debt instruments or ways for companies and governments to borrow funds in exchange for a dividend or some sort of yield payment.
- Cash and cash equivalents. These are stores of value like currencies (dollars, British Pounds, etc.), and instruments like certificates of deposit (CDs).
- Real Estate
- Commodities and Futures Contracts
- Collectibles like art or those NASCAR plates you’ve been hanging onto
- Hedge Funds, Venture Capital funds, etc.
I believe one of the tradeable assets that Van writes about often is becoming an asset class all to itself: cryptocurrencies.
I’ll make the technical (and philosophical) case that cryptocurrencies are a new and distinct asset class in an upcoming article. And even though Van will be writing his excellent cryptocurrency update next week, today I wanted to talk quickly about why cryptocurrencies (in general) and bitcoin (in particular) are back in the limelight.
By the way, if you’re not reading Van’s monthly update on cryptoassets, do yourself a favor and get caught up on those! Even if cryptocurrency investing is not your cup of tea, you’ll learn a ton about the broader world of crytoassets in one of the most comprehensive guides you can find. Hats off to Van’s really useful work in that area. And last month’s article was spot on in Van’s expectation for more upside in the market, two weeks before it happened. And now back to our regularly scheduled article…
Last week, bitcoin broke to new multi-month highs after struggling in a fairly narrow range of multi-year lows. The big move has been in the financial news a bit and has re-kindled interest in this asset class that is “neither fish nor fowl” (meaning it doesn’t fit neatly into the traditional asset classes). Here’s a chart that shows the move:
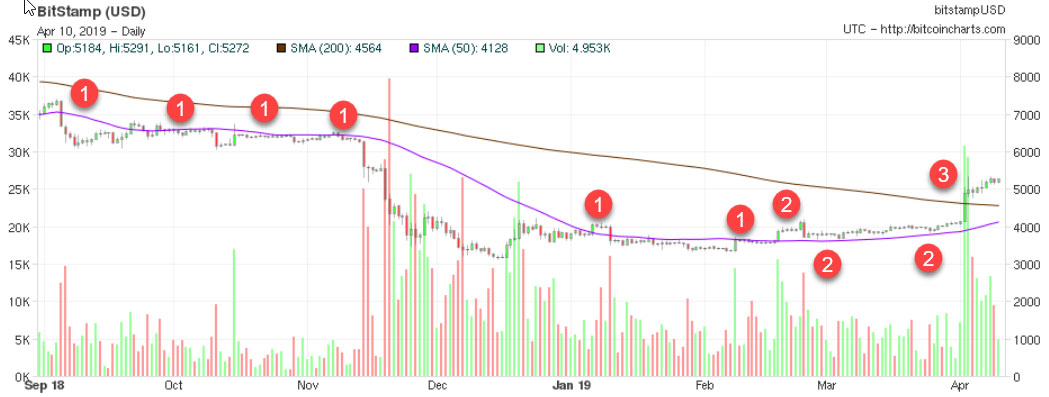
The red circle #1 at the far left of the chart shows the price of bitcoin breaking below the purple line that represents the 50-day simple moving average (MA). The remaining #1 red circles show the times that the 50 day MA acted as overhead resistance – fully five times over the next five months.
The first red #2 circle shows when price finally broke through the 50-day MA to the upside and turned that line into support that held price for the next 6 weeks with multiple downside tests shown by the additional #2 circles.
The red #3 circle shows the big thrust on April 2 where price finally broke through the down-sloping 200 day MA.
The two big questions on traders and investors minds:
- Why did bitcoin move up so strongly?
- Can it keep going?
Here are the most likely drivers of the bitcoin price surge that has been underway for the nine days:
1. Breaking the key technical levels in the chart above (especially the 200-day MA) emboldened traders and vindicated the bitcoin bulls bringing renewed buying into the market.
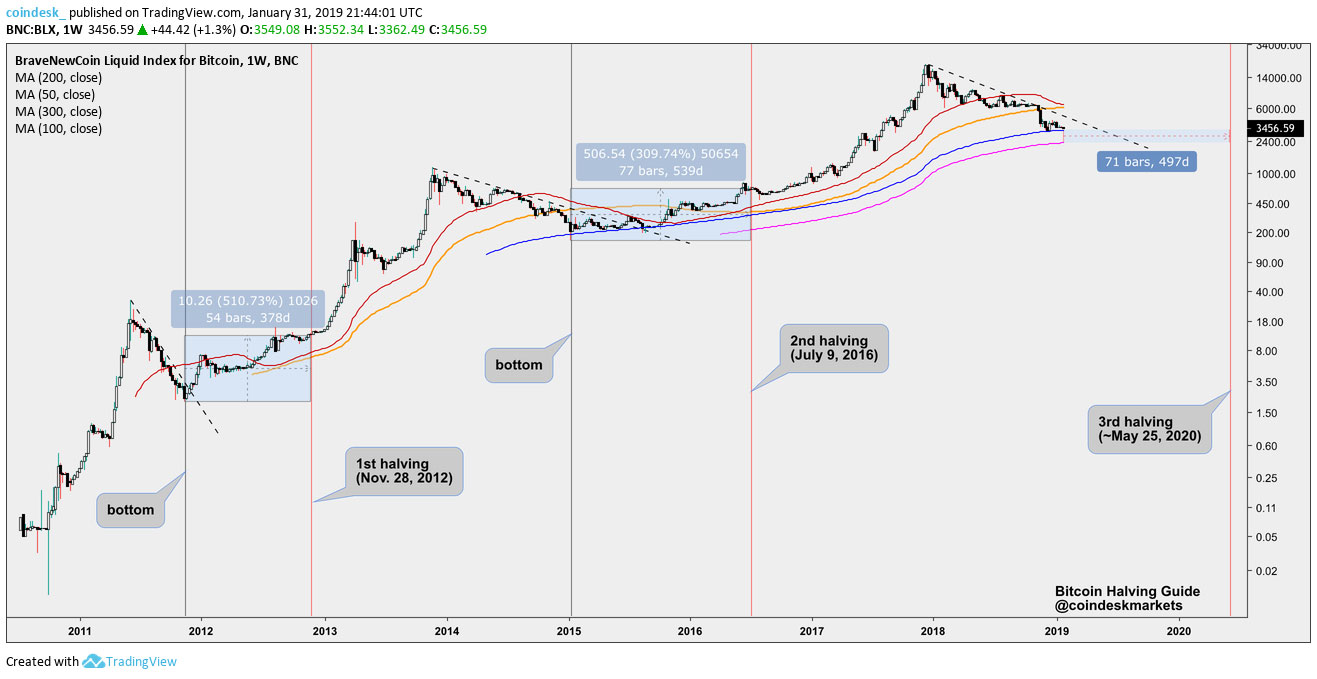
2. The bitcoin “mining reward halving” pattern. In May of 2020 the payment that the sophisticated bitcoin mining operations get for doing the computing that keeps bitcoin transactions secure cuts in half. This is a scheduled event in the bitcoin infrastructure and has happened twice before (in 2012 and 2016). About a year before each of those halving events, bitcoin price bottomed and then surged. Traders anticipate similar action here as the chart below from coindesk.com shows:
3. The biggest reason (in my opinion) for the price surge was large block purchases over a period of days that signaled institutional buyers coming into the market. Reuters reported that an algorithmic order of $100 million was spread across U.S. based cryptocurrency exchanges Coinbase and Kraken and Luxembourg’s Bitstamp in a synchronized purchase of 7000 bitcoin per exchange in an hour, totaling over 20,000 bitcoin. This higher volume both drove prices up and gave traders encouragement that was there was institutional-sized money in play.
Can It Move Higher?
That gives us some idea of why the prices moved higher. Since the move up, the price of bitcoin has stabilized at the higher levels and above the 200-day MA – positive signs to be sure.
There is both technical momentum and a sense of money moving into risk assets that support higher prices for cryptocurrencies.
In future articles, I’ll look at the possibility that cryptocurrencies are their own unique asset class and dig into the specifics that could drive crypto prices in the medium and long-term. Until then…
Great trading and God bless you,
D. R.