
After enjoying the low volatility of 2016 and the all-time least volatile year in the history of the U.S. financial markets in 2017, we have seen volatility return to the markets with a vengeance in the fourth quarter of this year.
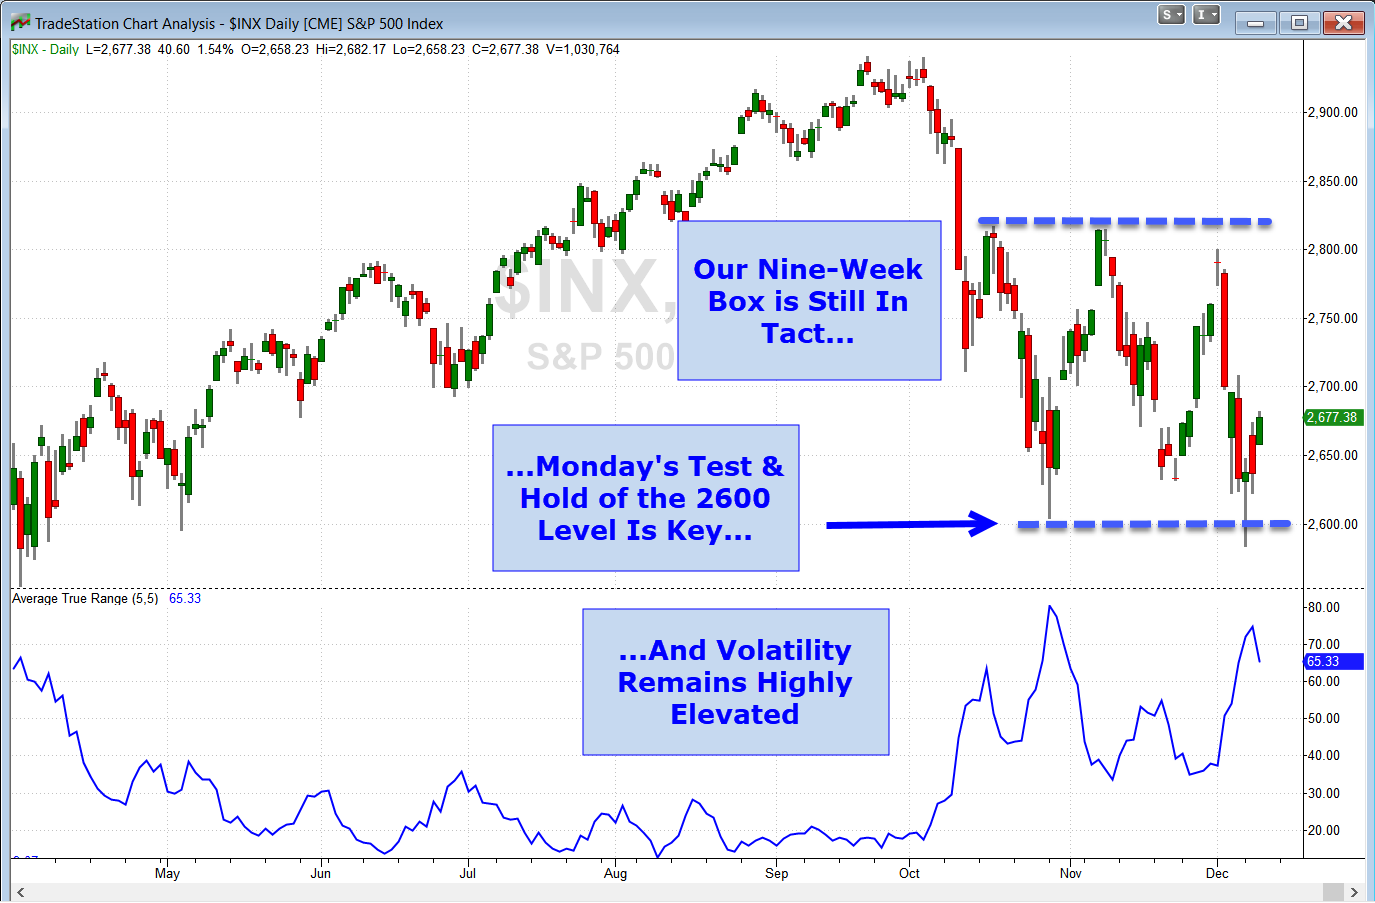
Neck-snapping intraday reversals have become the norm over the past few weeks.Even with every new headline seeming to produce a market reversal, the S&P 500 is still trading within a 210 point range it entered nine weeks back.
To highlight the volatility we’ve seen recently, here are the trading ranges for the Dow Jones Industrial Average ranges over the past five sessions:
12/4: 765 points
12/6: 709
12/7: 811
12/10: 619
12/11: 570
This daily range averages more than 5x what we were routinely seeing last quarter.
Interestingly, there are some fairly consistent ways to judge when program trading buy programs kick in and there was a cluster of them right around the very important 2,600 level in the S&P that I’ve been talking about for some time (and which we can see as the lower dotted line in the chart above).
Monday’s big down morning reversed into a strong tech-led rebound triggered by Prime Minister May’s prudent postponement of the vote on the Brexit. And that sort of headline-driven move has been sending the market whipping up and down, up and down – sometimes all in the same day.
Tuesday saw a big up open on positive news that China was considering reduced auto tariffs, but that move also proved fleeting as markets sold off the rest of the day.
We have these wide swings for one main reason: external market forces are more balanced than they have been in years. Though the following list is far from comprehensive, this rundown is fairly representative of the influences hitting markets right now:
Bearish:
- Tariff Troubles
- Brexit uncertainty
- The extreme age of the current bull market (since March 2009)
- Slowing global growth – especially in China
- Regulatory Sword of Damocles hanging over the head of the Mega Techs
- Debt problems in China and other emerging market companies
- The strength of U.S. Dollar (which worsens the emerging market debt problem and slows U.S. export)
Bullish:
- Earnings Growth (because of the tax cuts and other independent factors)
- Continued double-digit revenue growth of Mega-Tech
- Slowing/postponing of Fed rate increases
- Three traditional seasonal strength:
- Historically strong month (December is the strongest month dating back to 1950)
- Strongest part of the four-year presidential cycle
- Santa Clause Rally is a statistically significant seasonal trend
Because these opposing forces are so balanced at the moment, the markets are stuck in that sideways range we saw in the chart above.
And every time we get some compelling news supporting either the bullish or bearish camp, the market either soars or dives, but the spurt quickly fades.
So What Are We To Do?
This market environment forces us to make quicker decisions in our short-term trades and give our longer-term positions more room to run.
Markets are moving faster and opportunity abounds for nimble traders. Intraday traders are thriving on the volatility while swing (intermediate time frame) traders struggle to set stops wide enough to keep from being whipsawed out of positions.
As long as bullish and bearish forced remain so well balanced, the sideways volatile markets are likely to last for weeks and maybe even months to come.
What bearish and bullish influences have I missed? Let me know — I always enjoy hearing your thoughts and comments! Please send those to me using drbarton “at” vantharp.com
Great trading and God bless you,
D. R.