
 Back in November, we looked in depth at the Presidential Cycle at work in the stock market. In addition to looking at some great practical tools helping us understand statistical significance, we saw how the pre-election year is the strongest of the four-year cycle. As a reminder, 2019 is the pre-election year for this cycle (as if the spate of democratic candidates throwing their hat in the presidential election ring wasn’t a big enough tip-off!).
The presidential election / stock market cycle was popularized (perhaps even originated by) Yale Hirsch in his well-known Stock Trader’s Almanac. To quote Hirsch,
“Presidential Elections every four years have a profound impact on the economy and the stock market. Wars, recessions and bear markets tend to start or occur in the first half of the term; prosperous times and bull markets in the latter half.”
Hirsch provides data going back the 1833 for each year in the cycle and shows these results:
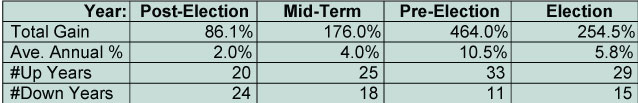
In statistics-speak, the second half of the presidential term seems to offer traders and investors a descriptive advantage. The pre-election year shows the strongest results while the post-election year vastly underperforms the other years in the cycle.
Where Are We Now?
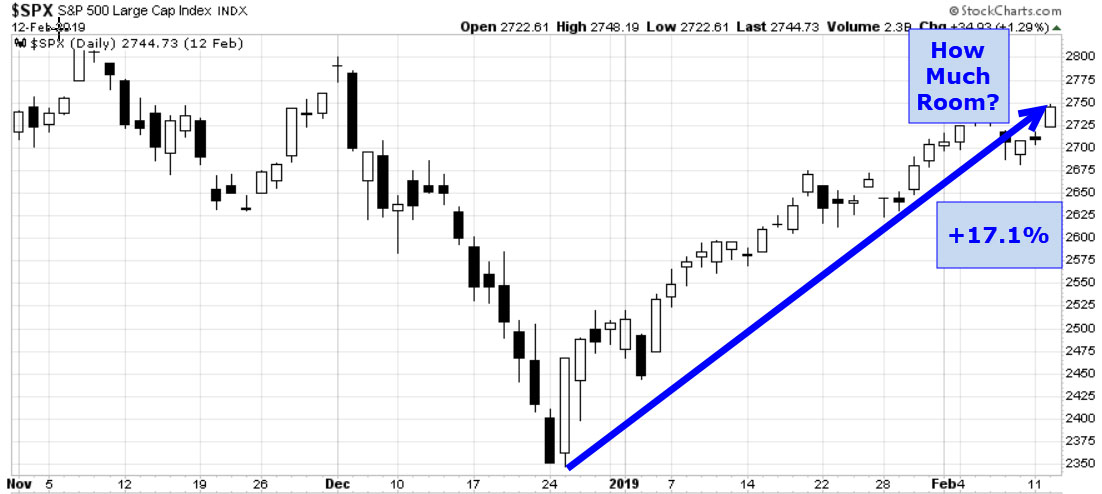
Since those intraday lows on the day after Christmas, the market has zipped up by 17.1% – a very healthy rebound. Further, Tuesday’s high is only 7% from the all-time high set in late September.
With the strong advance we’ve had in the first six weeks of the year, many have voiced opinions that the push up for 2019 is already over. “How much room do we have to run to the upside?” is a very valid question here. Based on the moves in previous third years of the presidential cycle, what does the data say? Let’s take a look.
More Presidential Cycle Data
The table below shows the date the low was made in the midterm election year or year two of the presidential cycle and then the subsequent max drop and climb in the pre-presidential election year or year three of the cycle:
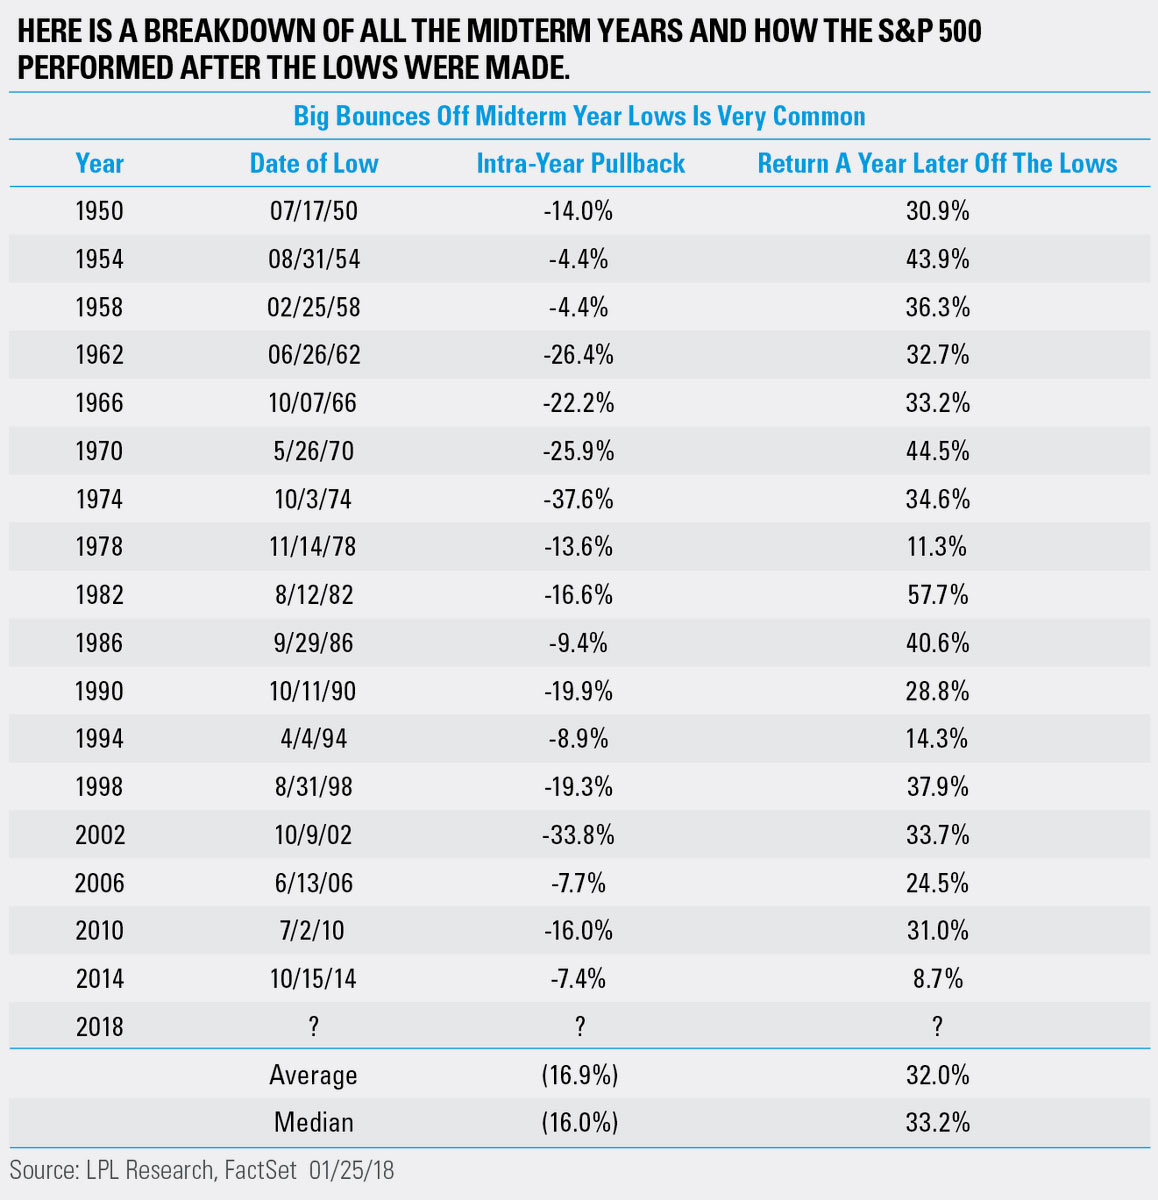
LPL’s table could now include the 2018 date that the S&P 500 made its intraday low – it was December 26th (notice from the price chart above that the market’s lowest closing price was on Christmas Eve).
So we can see from the table that on average, the market rallied 32% during pre-election years. Since we’re “only” 17% off of last year’s low, that implies that based on the “average” of pre-election year returns, we still have +15% of upside.
Another approach to applying the data for this presidential cycle year would tell us that the average and median drawdowns were about twice as small as the following average and median gains. This approach presents an even more bullish posture for 2019 than using the 32% average gain in the pre-election year.
The Bottom Line
Even after the strong run-up we’ve seen over the last seven weeks, the market should still have room to run in 2019.
Great Trading and God bless you.
D.R. Barton, Jr.