
The U.S. and China are taking their trade war to the next level.
For its part, the U.S. has put basically all of the imports from China on the tariff list. The Trump administration has also gone after individual companies like Huawei for intellectual property (IP) violations.
For their part, the Chinese have increased their tariff rates and added additional categories to their tariff list. In the last 24 hours, China television ran a story about possible export ban on rare earth minerals to the U.S. These minerals are critical for components in batteries, smartphones, computers and almost all things electronic (especially those benefiting from miniaturization).
And as I write this on Wednesday morning before the markets open in the U.S., we are on track to have the lowest price on the S&P 500 since March. The equity markets have been directionless and volatile for almost three weeks – a singularly difficult market-type to trade.
And yet the picture in the market is actually not that dark. While markets are set to open below the S&P 500’s “line in the sand” at 2,800, the index has not had two or three closes below that level yet. See the blue dashed line on the chart below:
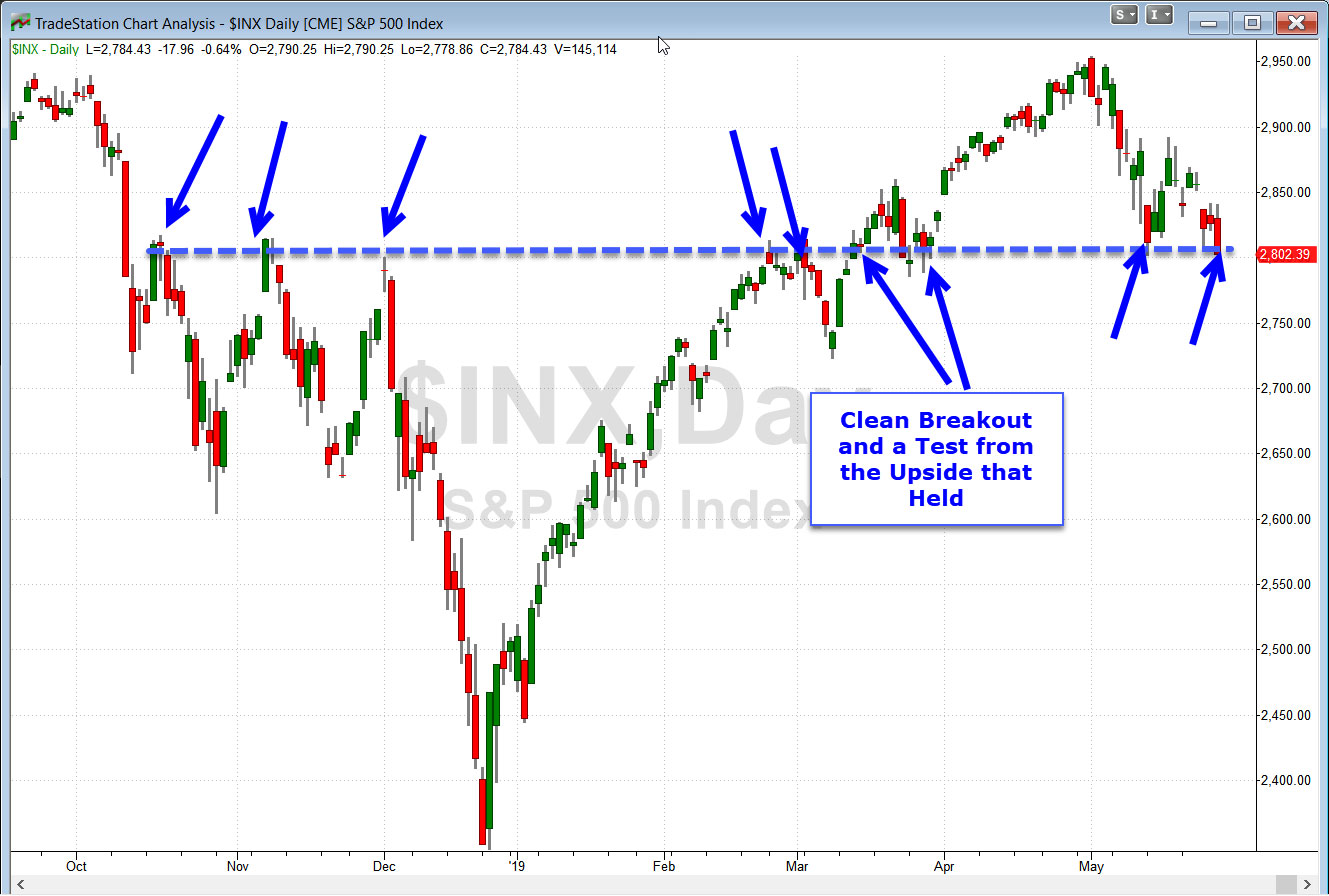
I say that we need “two or three” closes below 2,800 to break the support level because we have to remember that support and resistance levels are just that – semi-permeable levels or zones – they are not a rigid plane on the chart. If instead of getting a few closes below the level, we could see a very clear and strong move through to the downside which would break the support level as well.
It’s interesting that 2,798 is the mathematical calculation for a 5% pullback from the all-time closing high made back in late April. So far, we have not had a close at or below 5%. This shows how strong this year’s price action has been now that we are at the end of May.
For a helpful perspective, see the chart below which shows how many times the S&P has had a 5% pullback in each year dating back to 1990:
I put an oval around the average number of 5% pullbacks – which is 3.3 in a year. If the S&P closes today below 2,798, then we would have only our first 5% pullback of the year. This chart reminds us all that while pullbacks can be uncomfortable, they are also a very routine part of the trading and investing world.
The Bottom Line
Traders and investors are showing little indication that they’re pricing in a big downside push because of the trade war. The Volatility Index or VIX is still well below 20 and it hasn’t really had much of a reaction to the whole trade war mess. So despite all the posturing that we see in the headlines, options traders are not demanding a very big risk premium.
Great trading and God bless you,
D. R.