
 There are numerous ETFs that track everything from countries, commodities, currencies and stock market indices to individual market sectors. ETFs provide a wonderfully easy way to discover what’s happening in the world markets. I apply a version of my System Quality Number® (SQN®) score to measure the relative performance of numerous markets in a world model.
The Market SQN score uses the daily percent change for input over a 100-day period. Typically, a Market SQN score over 1.47 is strongly bullish and a score below -0.7 is very weak. The following color codes help communicate the strengths and weaknesses of the ETFs in this report:
- Dark Green: ETFs with very strong Market SQN scores > 1.47
- Light Green: ETFs with strong Market SQN scores (0.70 to 1.47).
- Yellow: ETFs with slightly positive Market SQN scores (0 to 0.70). These are Neutral/Sideways
- Brown: ETFs with slightly negative Market SQN scores (0 to -0.7).
- Red: Very weak ETFs that earn negative Market SQN scores (< -0.7).
This is basically the same rating scale that we use for the Market SQN Score in the Market Update. The world market model spreadsheet report below contains a cross section of currently available ETFs; excluding inverse funds and leveraged funds. In short, it covers equity markets around the globe, major asset classes, equity market segments, industrial sectors, and major currencies.
World Market Summary — Equities & Currencies
Each month we look at the equities markets across the globe by segment, region, and sector.
In October, equity markets started returning to yellow after being brown and red in the last few months.
The US Dollar has moved from being strong to being neutral. It’s yellow with a Market SQN of 0.65. The only green currency on October 31 is the Indian Rupee (light green), however, there are five brown currencies — the Aussie Dollar, the Brazilian Real, the Euro, the Swedish Krona, and the Yuan.
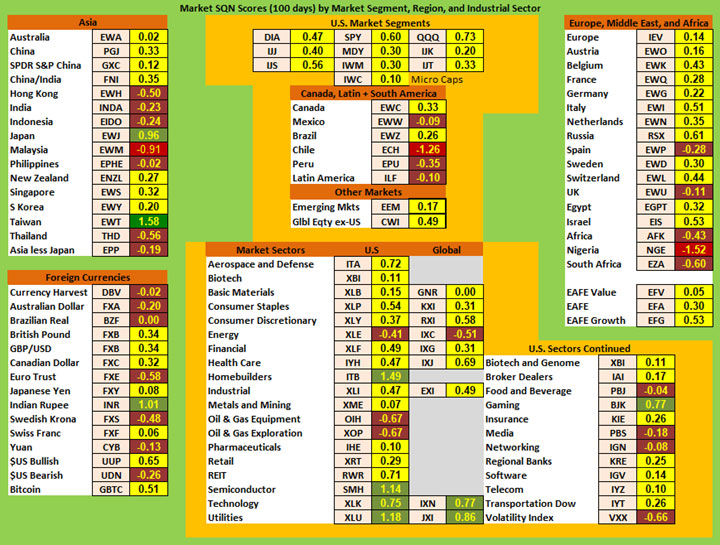
Notice that Asian equities are mostly brown and yellow with only a few greens. Taiwan is very strong (dark green) and Japan is light green.
In the US, equity market segments from large to small and value to growth are yellow. Other countries in the Americas are not doing so well. Mexico, Peru, and Latin America are brown while Chile is red. Canada and Brazil are neutral.
I’m no longer going to talk about every sector and what they are doing. You can look at the colors in the table and use the guidelines above to tell whether something is Bull, Neutral/Sideways, or Bear. I will point out a few. We have a few light greens — Homebuilders, Semiconductors, Technology, Utilities and Gaming. On the weak side (meaning brown) are: Energy, Oil and Gas Equipment, Oil and Gas Exploration, Food and Beverage, Media, Networking, and Volatility.
Commodities, Real Estate, Debt, and the Top and Bottom Lists
Four commodities are light green — Gold, Silver, Global Water, and Timber. We have one red sector which is Coal.
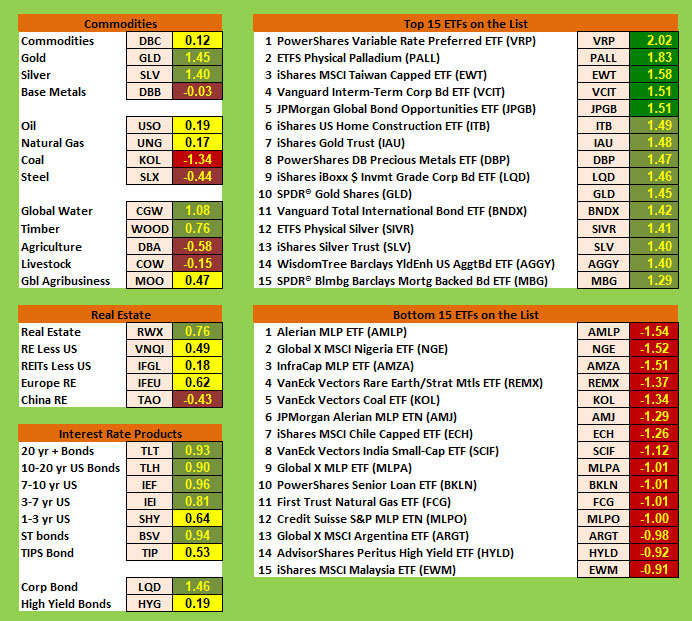
Real Estate is strong in the US (relative), neutral outside the US, and weak in China. Prices in these areas, however, are probably the inverse to the strength.
Interest rate based ETFs are mostly light green with High Yield, Tips, and 1-3 year Bonds being yellow. All the rest are light green with Corporate bonds being the highest at 1.46.
In the top 15 list for October, we only have one symbol above 2.0 – but the rest are all above 1.28. Palladium, Gold, Silver, and Home Construction are all in the top 15.
The bottom 15 are still all red ranging from -.91 to -1.54. Several countries are included such as Malaysia, and Chile and Argentina. Coal, Rare Earth Metals, Alerian MLP are among the others that caught my attention in the bottom list. I didn’t know what Alerian MLP was so I Googled it to find it’s an energy master limited partnership. I find that interesting because I regularly invest in oil and gas drilling and these investments have done quite well. Last year’s annual rate of return came in at a 50% which is outstanding – that’s just two years to reach break-even.
Summary
Let’s look at the summary table which measures the percentage of ETFs in each of the strength categories. You can see the distribution of the database by Market SQN score in bullish, neutral and bearish categories below —
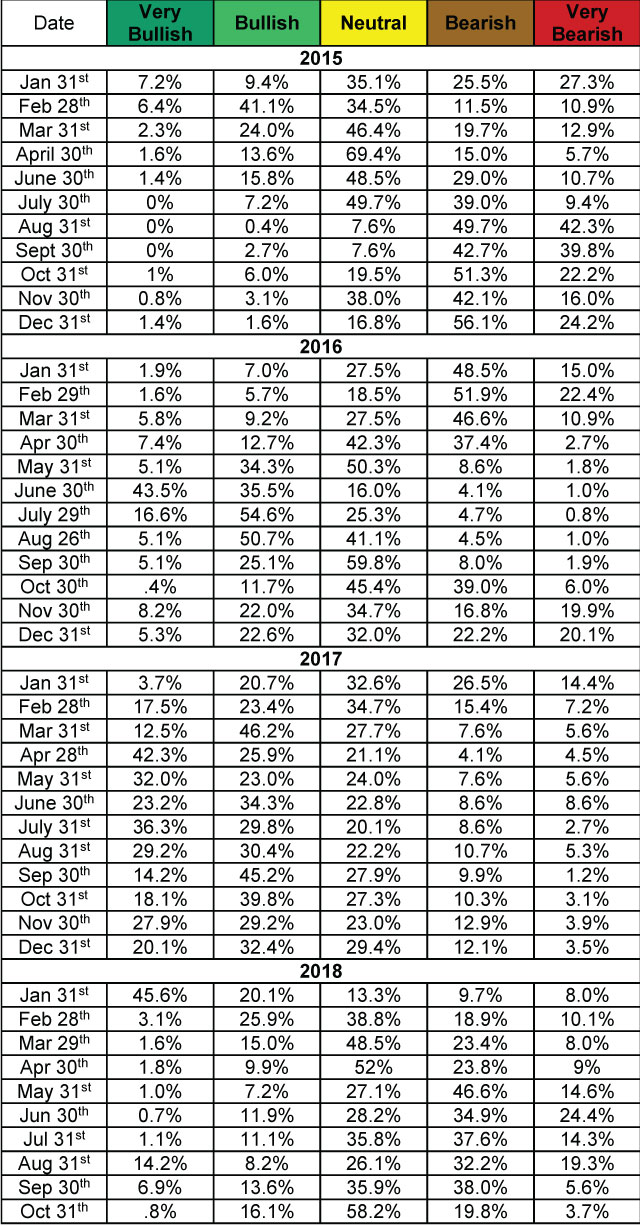
Only 0.8% of the ETFs in the database are very bullish now and only 3.7% are very bearish. That leaves over 95% of the ETFs in the three middle categories.
Be careful to base your actions upon what IS happening, not what you think might happen. The markets always offer opportunities, but to capture those opportunities, you MUST know what you are doing. If you want to trade these markets, you need to approach them as a trader, not a long-term investor. We’d like to help you learn how to trade professionally because trying to navigate the markets without an education is hazardous to your wealth. All the beliefs given in this update are my own. Though I find them useful, you may not. You can only trade your own beliefs about the markets.