
 I always say that people do not trade the markets; they trade their beliefs about the markets. In that same way, I’d like to point out that these updates reflect my beliefs. I find the market update information useful for my trading, so I do the work each month and am happy to share that information with my readers. If your beliefs are not similar to mine, however, then this information may not be useful to you. Thus, if you are inclined to go through some sort of intellectual exercise to prove one of my beliefs wrong, simply remember that everyone can usually find lots of evidence to support their beliefs and refute others. Simply know that I admit that these are my beliefs and that your beliefs might be different.
These monthly updates are in the first issue of Tharp’s Thoughts each month which allows us to get the closing data from the previous month. These updates cover 1) the market type (first mentioned in the April 30, 2008 edition of Tharp’s Thoughts), 2) the debt statistics for the US, 3) the five-week status on each of the major US stock market indices, 4) our four-star inflation-deflation model, and 5) tracking the US dollar. I also write a report on the strongest and weakest areas of the overall market as a separate SQN™ Report. Significant market changes may mean the SQN Report comes out more than once a month.
Part I: The Big Picture
So despite a vote for impeachment hearings and newsletter warnings about a new bear starting, the market is in new all-time high territory. And the volatility is almost in the Quiet range so there isn’t too much to worry about in the short term.
The S&P 500 hit another new high on Friday, November 1 but at the close on Thursday, October 31, our Market SQN calculated a Neutral market type – just below the threshold for Bull. I didn’t think that was possible but I guess it is. A Bull market requires a Market SQN score of .7 or higher and while the market hit some new all-time highs in late October, the Market SQN score was slightly less than 0.7 for the October 31 close. The Market SQN® score was bullish for 9 of the last 13 days in October.
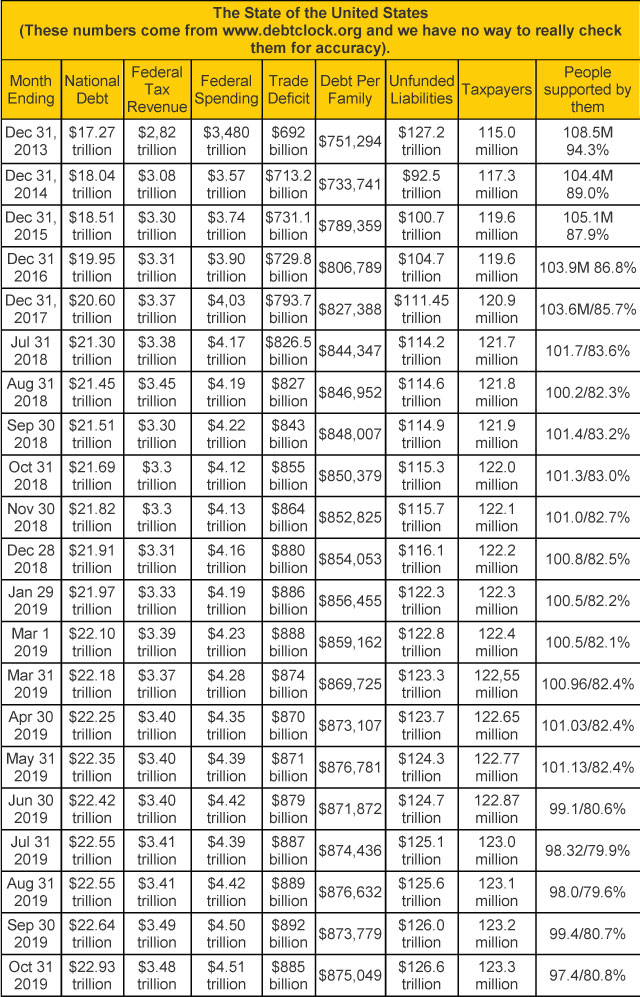
Notice that the federal debt increased by over $1 trillion since the beginning of this year. I thought the end of the world was coming when our total official debt hit one trillion after taking years and years to get there. Now we get a trillion dollar increase in debt in less than a year.
There are 123.3 million taxpayers who support 54.1 million retirees, 10.0 million disabled, and 35.6 million food stamp recipients. That’s 99.7 million people supported by 123.3 million taxpayers or 80.8%. I don’t include government employees as supported by taxpayers even though I probably should.
You really should look at the US Debt Clock website periodically (www.usdebtclock.com). They started showing a lot of new statistics recently and then they just changed the site again. You can see a copy of the screener as of Oct 31st below —
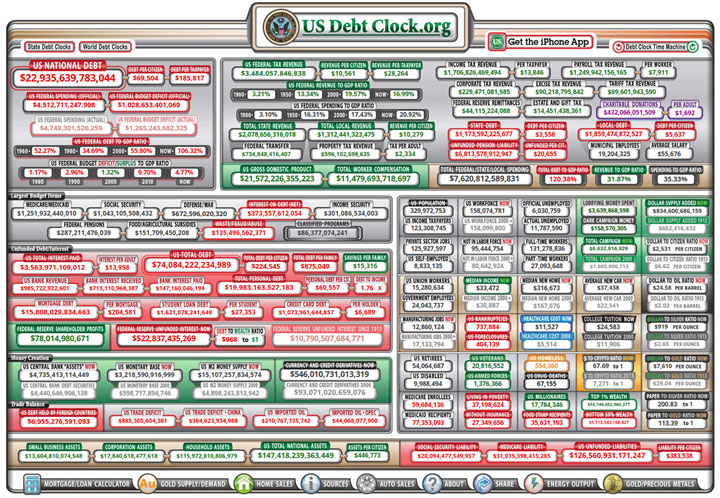
I want to concentrate on some of the statistics that the new format highlights —
Item
- The clock lists a lot more on how our money is spent, including 1) defense and war $672.5B; classified programs $85 billion; waste and fraud $135.5 billion; food and agricultural subsidies $151.7B; and interest on the debt at $373B.
- It now lists the largest items in the budget. Medicare is #1, Social Security is #2; War (we call it defense) is #3; and interest in the debt is #4. Given the top budget items and how big money thrives on the war machine, can you see how this debt problem will inevitably be a huge issue?
- The average citizen’s share of interest on the federal debt is now $13,958. And that’s about 1/3 of the median income of $33,472.
- The Federal Reserve’s unfunded interest is now $552 billion; and the Fed has a debt to wealth ratio of 968 to 1. I don’t think this is what the world’s richest families had in mind in establishing a central bank.
- $546 Trillion in currency and credit derivatives exist now (vs $92.5 trillion in 2000). This is certainly something to watch on a monthly basis if it starts changing a lot.
- There are 17.8 million millionaires which make up 5.4% of the US population. Millionaires make up about 1% of the population in the rest of the world.
- I assume this is for the US — The top 1% owns $55.7 trillion, while the bottom 50% owns $1.71 trillion. That says that the top 1% owns 32.5 times as much as the bottom 50%. For the whole world, the ratio is much more extreme given that 26 people own half the world’s wealth.
- There have been 737,884 bankruptcies and 404,139 foreclosures in the last 12 months.
- The Dollar to Crypto ratio is now 67.69 to 1 and in 2013 it was 8,616 to 1. This is M2 divided by the total market cap of cryptos. We will be keeping track of this one regularly if I think it’s reliable data.
- Healthcare costs are now $11,527 vs $5,495 in 2000. Our healthcare system treats symptoms and not cause and I understand why – treating symptoms is much more profitable.
- The total debt to GDP ratio is now 120.2%
- The US Dollar (M2) to gold (yearly production) ratio is now $7610 per ounce. It was 29.1in 1913.
If you have an iPhone, you can now download the US debt clock app. The table has changed enough in the last few months that at least some of the things we were following are no longer listed in the table.
Remember, those with money who are in power, make the rules. Their goal is to make sure they stay in power and don’t turn it over to new wealth.
Part II: The Current Stock Market Type Is Neutral Normal
Let’s take a look at the weekly bar chart below for the S&P 500. You can see that with the last two weekly bars, we have been starting to make new all-time highs. Because of the big consolidation over the last five months, however, our market type is just Neutral.
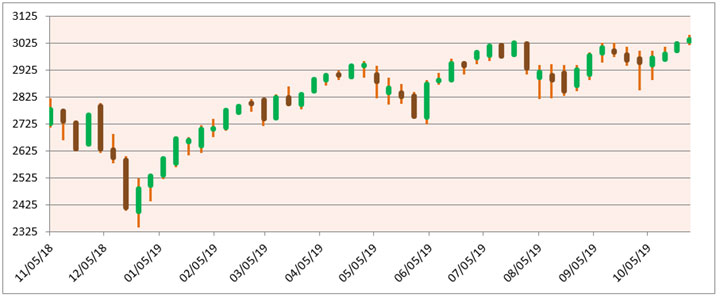
I monitor timeframes for the Market SQN from 5 weekly bars to 40 weekly bars. Look at the price chart pattern and you can probably tell the direction for each of the periods —
- 200 days – Bull in September, Bull again
- 100 days –Neutral last month, again Neutral
- 50 days –Bear last month, now Neutral
- 25 days – Neutral last month, Neutral again
So now all of our measured periods are either Neutral or Bull.
The chart below shows the trend out of Strong Bear in January to Strong Bull by June. Then the market type moved back down to bounce off Bear in late August to stay in Neutral through September. In October, we reached Bull but toward the end of the month, the market type moved back down into Neutral.
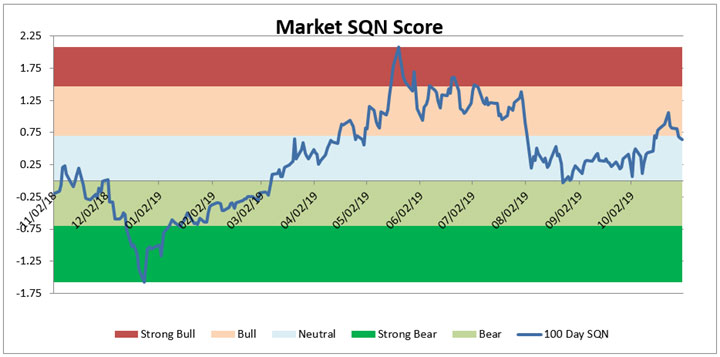
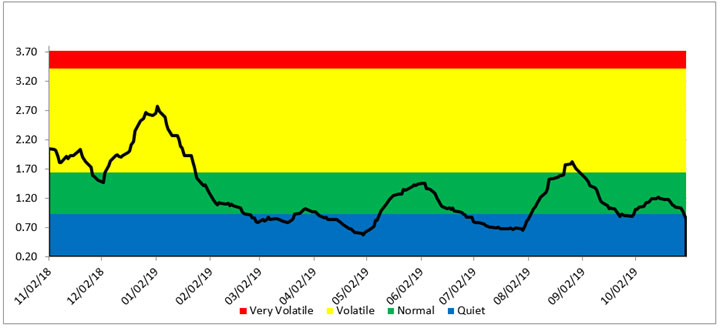
The third chart shows the volatility measurement for the last twelve months. Last month, volatility decreased and now almost back in Quiet.
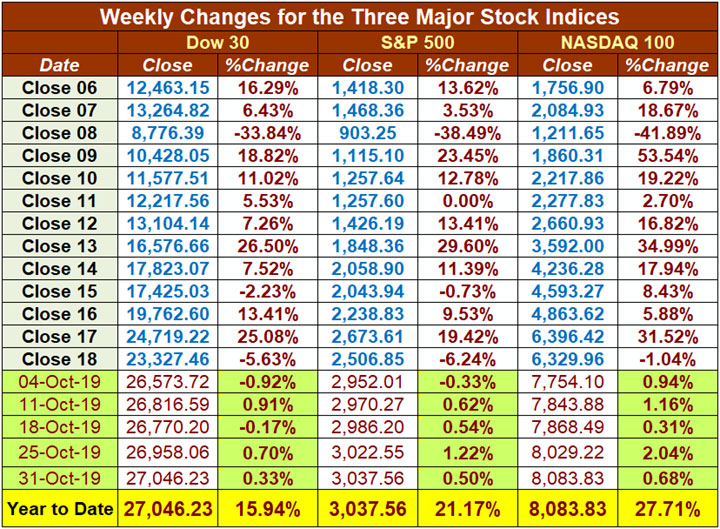
Lastly here are the weekly changes for the three major stock indices for the last month. If you had been fully invested from the beginning of 2019, then you’d be up 15.94% in the DOW, up 21.17% in the S&P 500 and up 27.71% in the NASDAQ 100. Our last highest high in the S&P 500 was on the last day of October.
So is your account up at least 20% this year? If you bought the S&P 500 January 1, 2019 and held it, you’d be up more than that.
Part III: Our Four-Star Inflation-Deflation Model
The four components of the model were balanced again in September –
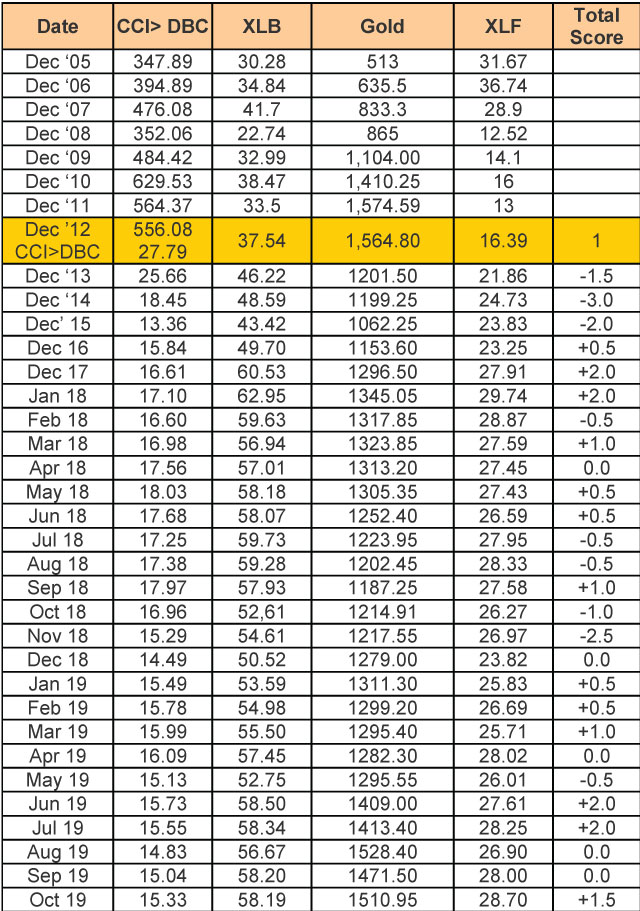
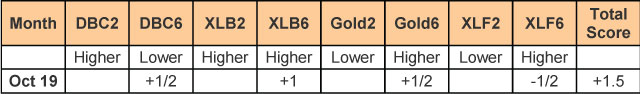
The inflation/deflation model turned to inflation with the June and July readings of +2.0. Two big inflation months in a row were followed by two months with scores of 0. The model showed inflation again in October.
The Fed just lowered interest rates for a third time — a good sign for the stock market ahead but we also have an inverted yield curve — a predictor of a recession beginning sometime next year.
Shadowstats.com still shows the inflation rate (as it was originally conceived in 1980) as being around 10%. With that adjustment in the GDP, the original inflation rate suggests that we have been in a recession since 2000 with just one quarter of non-recession.
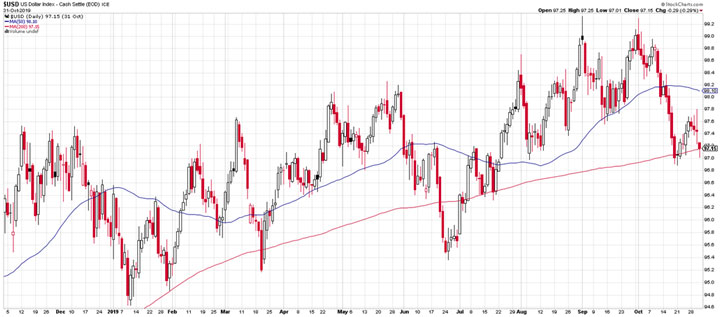
Part IV: Tracking the Dollar
USD closed October at 97.15 after finishing in September at 98.81. The index closed down for the month but is still up in 2019. To keep this in perspective, however, remember that the index started more than 40 years ago in 1973 at 100.
The Pound Sterling is now at 1.2923. The UK’s new prime minister, Boris Johnson, is a little like Trump in that he wants to absolutely force his agenda – in this case, that BREXIT go through on October 31st. That didn’t happen so Johnson has called for a new election as a referendum on BREXIT. Johnson is unpopular. While I was in London for our workshops last month, I actually saw someone wearing a t-shirt the said “F**K BORIS.” I haven’t seen this in the US for Trump but then again I don’t watch the news and I don’t live in a state like California where Trump is so hated.
Conclusion
As I have said, trade wars are not pretty and we are living through a big one – one which may continue for the foreseeable future.
In addition, gold is up for the year and so is BTC. BTC is up 200% for 2019 but has been in a trading range for the last few months. Bitcoin gave a sell signal for all of our cryptoasset systems in September but could easily produce a buy signal this month.
Our purpose here is not to predict but to merely reflect on what is happening right now. Be careful you are not paying attention only to what you expect to happen. Stay in the now! Pay attention to what is happening.
Until next month’s update, this is Van Tharp. Trade well and create the life you want for yourself.