

I always say that people do not trade the markets; they trade their beliefs about the markets. In that same way, I’d like to point out that these updates reflect my beliefs. I find the market update information useful for my trading, so I do the work each month and am happy to share that information with my readers. If your beliefs are not similar to mine, however, then this information may not be useful to you. Thus, if you are inclined to go through some sort of intellectual exercise to prove one of my beliefs wrong, simply remember that everyone can usually find lots of evidence to support their beliefs and refute others. Simply know that I admit that these are my beliefs and that your beliefs might be different.
These monthly updates are in the first issue of Tharp’s Thoughts each month which allows us to get the closing data from the previous month. These updates cover 1) the market type (first mentioned in the April 30, 2008 edition of Tharp’s Thoughts), 2) the debt statistics for the US, 3) the five-week status on each of the major US stock market indices, 4) our four-star inflation-deflation model, and 5) tracking the US dollar. I also write a report on the strongest and weakest areas of the overall market as a separate SQN™ Report. Significant market changes may mean the SQN Report comes out more than once a month.
Part I: The Big Picture
So despite impeachment hearings, despite newsletter warnings about a bear market selloff, the market continues in new all-time high territory. Volatility is Quiet so there isn’t too much to worry about in the short term. I have a belief that a market making all-time highs is a bull market but the Market SQN® says we need a score of more than 0.7 to have a bull market. We can have all-time highs without the Market SQN getting to that level. That just goes to show that sometimes you measure things and trade that measurement, but the measurement doesn’t necessarily reflect your beliefs. We’ll be talking about this phenomenon in my new streaming Trading Genius II: Systems Thinking and Beyond that will be given in January and February 2020.
The S&P 500 closed at an all-time high on November 27 and it hit a new high on Friday. In addition, we made all-time highs in 13 of the last 24 days – but the Market SQN only reached bullish scores on 14 of the last 24 days.
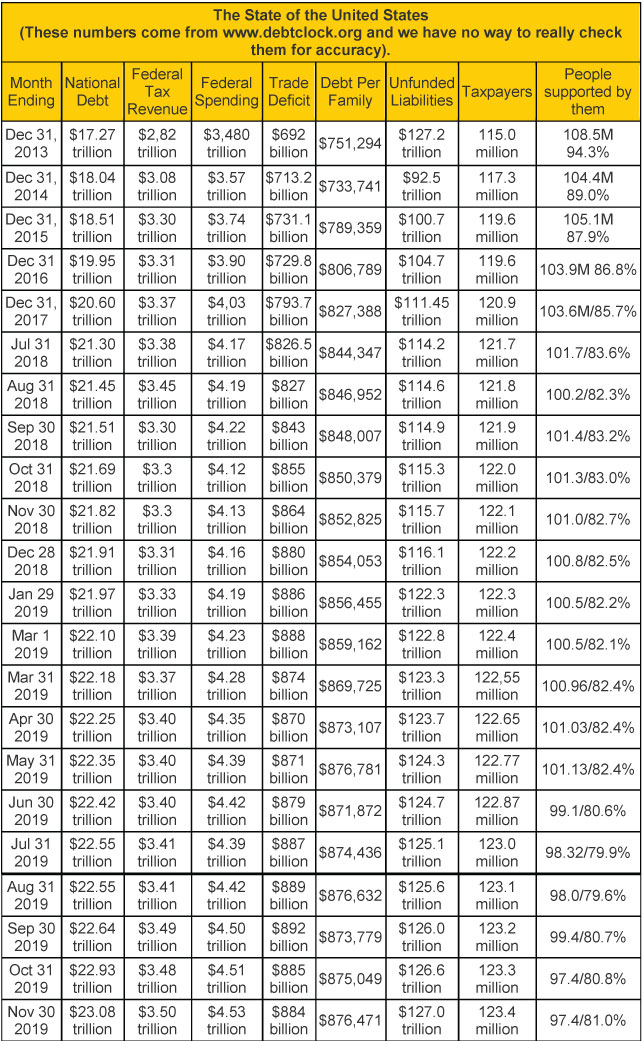
Notice that the federal debt increased by over $1 trillion since the beginning of this year. I remember I thought the end of the world was coming when our total official debt hit one trillion after taking many years to get there. Now we do a trillion-dollar increase in debt in less than a year.
There are now 123.3 million taxpayers who support 54.1 million retirees, 9.9 million disabled, and 35.9 million food stamp recipients. That’s 99.9 million people supported by 123.4 million taxpayers or 80.8%. I don’t include government employees as supported by taxpayers even though I probably should.
You really should look at the US Debt Clock website periodically (www.usdebtclock.com). If you have an iPhone, you can now download the US debt clock app here: https://apps.apple.com/us/app/us-debt-clock-real-time/id929822826?ls=
They started showing a lot of new statistics recently and then they changed it again. The table has changed enough in the past few months that at least some of the things we started to follow no longer are listed on their homepage. I want to concentrate on some of the statistics that the new format highlights:

Remember, those with money who are in power, make the rules. Their goal is to make sure they stay in power and don’t turn it over to new wealth.
Part II: The Current Stock Market Type Is Neutral Quiet
Let’s take a look at the weekly bar chart below for the S&P 500. You can see that we just made another new all-time high but because of the big consolidation over the last five months, our market type is just Neutral.

I monitor timeframes for the Market SQN from 5 weekly bars to 40 weekly bars. Look at the price chart pattern and you can probably tell the direction for each of the periods –
- 200 days – Bull in October, Bull again
- 100 days – Neutral last month, again Neutral
- 50 days – Neutral last month, now Bull
- 25 days – Neutral last month, Strong Bull now (all of the new highs)
So now all of our measured periods are either Neutral or Bull. The chart below shows the trend out of Strong Bear early in the year to Strong Bull by June. Then market type then moved back down to bounce off Bear in late August to stay in Neutral through September. In October, we reached Bull but toward the end of the month, the market type moved back down into Neutral. In early November, the score made it into Bull but then stayed mostly high in the Neutral range for the rest of the month.

The third chart shows the volatility measurement for the last twelve months. Last month, volatility decreased and now is Quiet.


Lastly here are the weekly changes for the three major stock indices for the last month. If had you been fully invested from the beginning of 2019, then you’d be up 20% in the DOW, up 25% in the S&P 500 and up almost 33% in the NASDAQ 100.
So is your account up at least 20% this year? If you bought the S&P500 January 1, 2019 and held it, you’d be up more than that. 20% in a year is a very good return. And if you are not matching that, then something is wrong with your trading and you should work to solve the problem through our educational programs.
Part III: Our Four-Star Inflation-Deflation Model
Three of the four components of the model displayed inflationary strength in November –


Two big inflation months in a row (Jun+Jul) were followed by two months with scores of 0 (Aug+Sep) which have been followed by the two most recent months of inflationary readings again. The Fed has lowered interest rates three times recently – a good sign for the stock market ahead but we also have an inverted yield curve – a predictor of a recession beginning sometime next year.
Shadowstats.com still shows the inflation rate (as it was originally conceived in 1980) as being around 10%. With that adjustment in the GDP, the original inflation rate suggests that the economy has been in a recession since 2000 with just one quarter of non-recession.
Part IV: Tracking the Dollar
USD closed November at 98.29 which is within a 4-5% range where it has been since July. The index closed up for the month and is up in 2019 but to keep the current level in perspective, remember that the index started more than 40 years ago in 1973 at 100.

Conclusion
We continue to live through a big and ugly trade war that has several fronts. It may continue for a while or start to finish soon.
In addition, gold is up for the year and so is BTC. BTC is up 200% for 2019 but has been in a trading range for about the last six months. Bitcoin gave us a sell signal in September for our cryptoasset trading systems but BTC could easily produce a buy signal shortly. We are now only six months away from the Bitcoin halving which I have written about previously.
Our purpose here is not to predict but to merely reflect on what is happening right now. Be careful you are paying attention to what is actually happening in the markets – not only to what you expect to happen. Stay in the know!
Until next month’s update, this is Van Tharp. Trade well and create the life you want for yourself.