
November 2018 SQN® Report
by Van K. Tharp, PhD
I always say that people do not trade the markets; they trade their beliefs about the markets. In that same way, I’d like to point out that these updates reflect my beliefs. I find the market update information useful for my trading, so I do the work each month and am happy to share that information with my readers. If your beliefs are not similar to mine, however, then this information may not be useful to you. Thus, if you are inclined to go through some sort of intellectual exercise to prove one of my beliefs wrong, simply remember that everyone can usually find lots of evidence to support their beliefs and refute others. Simply know that I admit that these are my beliefs and that your beliefs might be different.
These monthly updates are in the first issue of Tharp’s Thoughts each month which allows us to get the closing data from the previous month. These updates cover 1) the market type (first mentioned in the April 30, 2008 edition of Tharp’s Thoughts), 2) the debt statistics for the US, 3) the five-week status on each of the major US stock market indices, 4) our four-star inflation-deflation model, and 5) tracking the US dollar. I also write a report on the strongest and weakest areas of the overall market as a separate SQN™ Report. Significant market changes may mean the SQN Report comes out more than once a month.
Part I: The Big Picture
The market shifted slightly more positive. In November, it went from Bear Volatile to Bear Normal and was very close to sideways on November 30. If the market closes flat or up in the first week of December, then it will move to Sideways Normal market type.
US Debt Clock
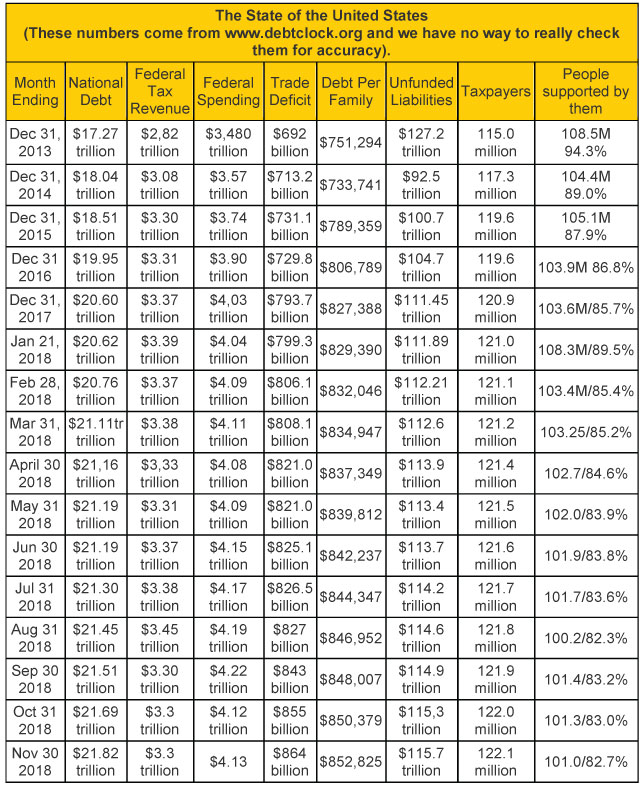
For the past four months, www.usdebtclock.org has listed US Assets which includes small business assets, corporate assets, and household assets. These total $151.2 trillion. But then consider that our unfunded liabilities are $115.7 trillion. The total liability per taxpayer is $947,788 and the total assets per citizen is $459,291. The trend towards higher debt has been going on for years and thus is likely to continue. But one day it will all collapse. The people supported by the 122.1 million taxpayers include retirees, (52.5M) disabled people (10.2 M), those getting food stamps (38.3M) or 101.0 million people total. This is one trend that has been going down during the Trump years. In January 2018 it was 89.5% but now is 82.7%.
Part II: The Current Stock Market Type Is Bear Normal
October’s directional component shift for the market type was very interesting. The Market SQN scores for the various periods we monitor look like this for October and November–
- 200 days – Bear last month, now Neutral
- 100 days – Bear last month, still Bear now
- 50 days – Strong Bear last month now just Bear
- 25 days – Strong Bear last month, now Neutral
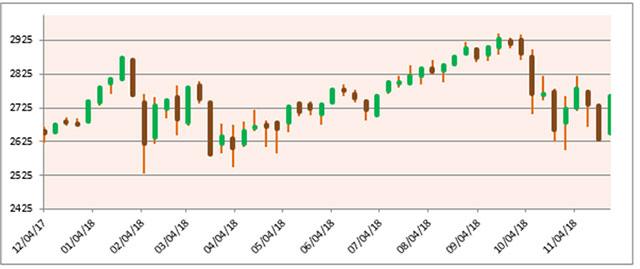
Even though the end of November Market SQN scores were about the same or slightly better, this is a very dangerous market. The chart below shows the weekly performance for the last year as of the end of November. You can see the huge bars for the last several weeks.
The Fed is raising short term rates and with the last rate hike, we are near (or at) a rate inversion. This is a sign of an upcoming recession, however, it takes a year from that sign for a recession to hit. The Fed had promised five more rate hikes (Dec 2018, 3 in 2019, and 1 in 2020) but now they seem to be softening their stance.
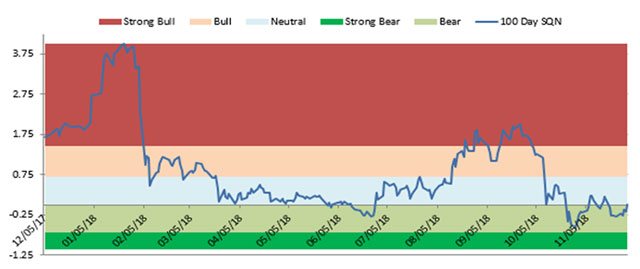
The chart below shows what then happened to the Market SQN score in November –
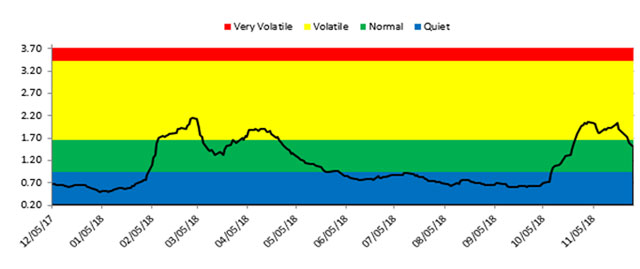
The last chart shows the market volatility. You can see that it hit a peak in Oct/November and then has trended back to normal.
Lastly here are the weekly changes for the three major stock indices for 2018.
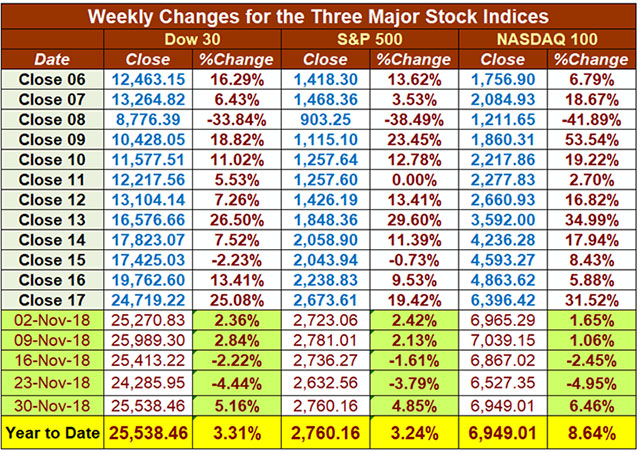
You’ll notice that all three market are up for the year with the huge gains over the last week. Was this a volatile correction in Oct-Nov or are we in for a new bear market? Either is possible.
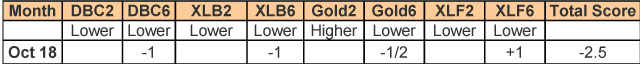
Part III: Our Four-Star Inflation-Deflation Model
The model components provided mixed signals.
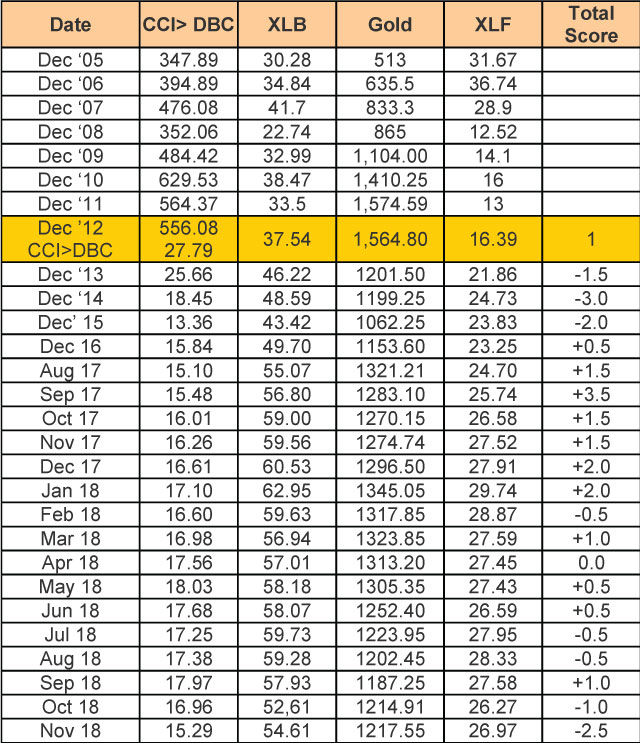
The Fed is raising interest rates because it sees inflation approaching but our results show deflation in four of the last five months and pretty neutral scores overall for 2018. In contrast, www.shadowstats.com measures inflation the way the government measured it in 1980 and shows inflation at about 10% right now. And on that basis, we have been in a recession since 2000 except for one quarter in 2003. How do the results of this model relate to the relative value of the US Dollar? See the next section of this article and the SQN Report below.
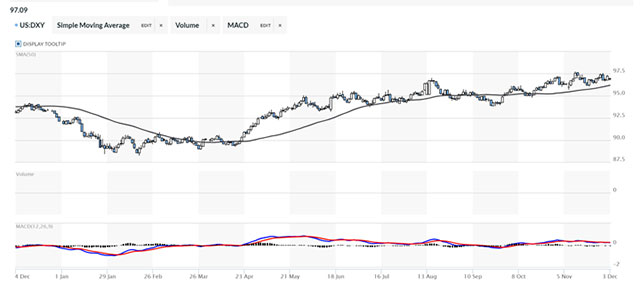
Part IV: Tracking the Dollar
Trump is still talking tough tariffs while we also have rising interest rates. Both of these factors seem to support a quite strong US Dollar compared with other currencies. The USD is close to yearly highs –
Conclusion
As I mentioned last month, one newsletter writer just gave a webinar for more than 100,000 people telling them that we are nowhere near a market bottom. This occurred during the October crash. He proposed that his subscribers buy a portfolio of nine stocks and ETFs to take advantage of huge gains yet to be made in the market. What’s interesting is that he had 35% trailing stops on 6 of the positions, 50% trailing stops on 2 others and no stop on the final recommendation. Subscribers who followed this advice are going to subject themselves to a portfolio heat of 45%. What’s more, two of his recommendations were triple leveraged ETFs. Such instruments are very dangerous to hold over the long term because of their daily price recalculations. You can lose money on those positions because of the daily price fluctuations even though you are correct about the market direction.
Initially there was an up move in that portfolio but it’s been subject to extreme volatility with many complaints from subscribers. This newsletter writer’s market predictions may happen but taking on portfolio heat of 45% is a huge risk for anyone. Why not let the market prove itself first? Right now the market direction is Bear and volatility has reached the Volatile range recently. This is not a good place to be long.
Until next month’s Market Update, this is Van Tharp