
 A famous CDA/Wiesenberger study took an interesting approach to explaining two different market strategies by creating two fictitious characters – Mr. Timing and Mr. Selection. The research used data from 1940-1973 in its first edition and then continued on through the early 1990’s in a later edition.
Mr. Timing was capable enough to perfectly call every market swing of 10% or more. Mr. Timing bought at the exact low tick of every bottom prior to a 10% or higher move up and exited at the exact high tick before every decline of 10% or more. Essentially, Mr. Timing executed perfect entries and perfect exits on any swing of 10% or greater.
In contrast, Mr. Selection simply invested 100% of his funds in the top performing sector of the market each year.
Which one of these two traders had consistently stronger returns? Most people suspect that their profits would have been similar – but they were substantially different.
Mr. Selection beat Mr. Timing in the 1940-1973 study generating over thirty times the profit. And in the second study, Mr. Selection again beat Mr. Timing many fold.
While these results are purely fictitious and impossible for anyone to even come close to duplicating, they illustrate clearly that selection is more critical than timing in determining the profitability of your investments.
Most investors much of their time on market timing than on selection, however, the low fruit is in market selection. Be sure to spend much more of your time and effort on the lowest fruit likely to make the biggest impact upon your investment results. This is consistent with Dr. Tharp’s teaching. As you probably know, Van teaches that Market Selection is more important than either exits or entries.
OK, so let’s say you get that point. You want to employ more selection criteria to your investing approach. What are some of the proven methods for improving your investing via selection methodologies? Let’s look at three in this article.
Market Selection Technique 1 – Relative Strength
Numerous studies of data going back many decades show that Relative Strength (RS) is one of the most significant and consistent variables for determining future outperformance in both stocks and in other asset classes.
For instance, Jim O’Shaughnessy of O’Shaughnessy Asset Management, found Momentum / RS based strategies were both more consistent in terms of outperformance and had the largest edge of any method tested. His tests included thousands of stocks going back to the 1950’s. O’Shaughnessy’s later work focused on momentum-value combinations which were the most profitable strategies of the past 50 years while concurrently they lowered volatility and drawdowns.
A Blackstar Funds study showed that in nearly every calendar year from 1926 to 2009, the top 25% of the stocks in the market at the time accounted for virtually all the gains of the major indexes during the year (see chart 1 below). The other 75% of the stocks essentially had an average return of 0%. An army of follow-up studies have shown that various methods of determining top RS and re-balancing yearly, quarterly, monthly, weekly, or even daily via top RS produces substantially higher returns than market averages over 90% of three year periods from 1926 to 2010. Moreover, the top 10% of stocks in a given year often account for nearly 50% of the total return of the entire market because they gain so substantially. It is the stocks that gain 50%+ that are the big drivers of total market returns. Understandably then, strategies that strive to locate and focus on stocks in this top 10% can do better consistently than simply selecting an average of stocks.
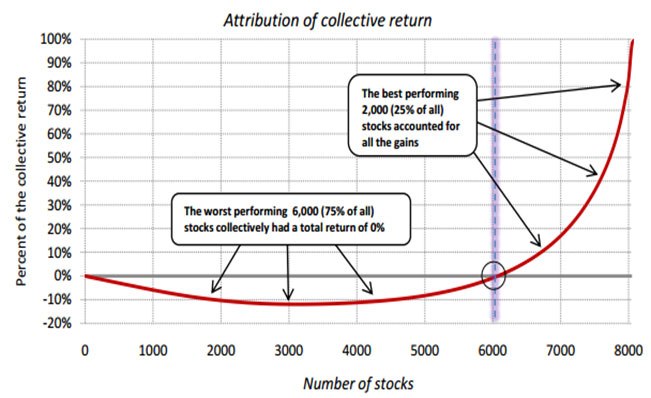
Figure 1 – Time and time again with remarkable consistency, the top relative strength leaders of the market made up the vast majority of the market return for each year from 1926-2009. Courtesy Blackstar Funds.
Investors’ Business Daily has published the Relative Strength Rankings of stocks for many decades and still uses this as a key component of its CANSLIM method of stock selection today.
One group tested a RS strategy where each month, 5 positions were taken in the top RS performers (3 month and 6 month) from among ETFs, S&P sectors, and individual stocks going back to 1920’s. Bonds and cash were added to the list and were switched into when bonds and cash rose to the top of the RS rankings or when RS values fell below 0 on half of top ten RS list. The group found consistent outperformance in 70% of years for this strategy. That’s better than market average annual returns of 15%+ with much higher consistency of profits and substantially lower drawdowns than the market.
In similar fashion, Cambria Investment Management ran a relative strength model on the huge database of the French-Fema US equity sector data going back to the 1920’s. In addition to finding consistent outperformance over this long period of time from Relative Strength portfolios, they also found “relative strength portfolios outperformed buy and hold in approximately 70% of all years and returns were persistent across time.”
Since 1992, the Portfolio Strategy Letter (PSL) has published our own country ETF investment model which uses both Relative Strength and interest rate action in each country as an additional filter to select country ETFs which are likely to outperform.
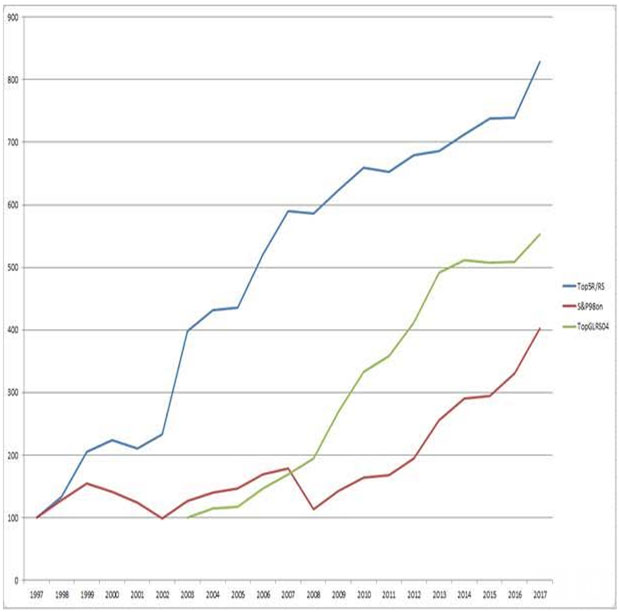
Figure 2 – In the graph above, the blue line represents the returns from the Top 5 Rate/RS Strategy since its initial publication in 1998. The red line cumulative returns for the S&P since 1998. The green line is another RS model we introduced at a later date.
This strategy published in real time, has produced a gain of 728% on a 14.5% maximum drawdown compared to the S&P’s gain of 302.3% on a 57.69% drawdown. That’s over 2.4 times the return on around ¼ the risk as the S&P.
For this strategy, we rank symbols by their RS number from highest to lowest using the IBD formula:
RS = (the 3 month double weighted % change + the 6 month % change + 9 month % change + 12 month % change) / 5
In our workshops, we teach some other methods of RS unique to our strategy that help improve these selections too. If you do nothing other than simply use the IBD RS rankings to focus your attention on holding the top 10% tier of RS stocks each year, you’ll create a huge improvement in your trading results.*
Market Selection Technique 2 – 52 Week Highs
Another tangential momentum concept that demonstrates consistent outperformance is to find stocks making 52-week highs that continue to hold near those highs. Dorsey Wright has done some of the most substantial and rigorous testing of various approaches on market returns. Their findings, like that of O’Shaughnessy came to the conclusion that…
“…the margin of outperformance was larger in some decades than others, but while both Value and Growth experienced decades of underperformance, Momentum outperformed in every single decade.” ~Dorsey Wright Man vs Machine PDF
One test looked at over 50 different asset classes including stocks, stock sectors, bonds, metals, commodities, and currencies. In the test, the strategy simply bought 52-week new highs in each and used a simple moving average trailing stop thereafter to exit. The model outperformed in every asset-class and generated double-digit average annual returns on much lower than stock-market-average drawdowns for the overall portfolio going from 1920-2015.
In their 2011 study “Industry Information and the 52-Week High Effect” Hong, Jordan, and Liu show that the 52-week high effect of individual stocks is highly correlated to the entire industry group. When an entire industry group nears its 52-week high, the excess gains of stocks within this group also hitting their annual highs are greater. This correlation can be used to enhance the reliability of any strategy using 52-week high inputs.
Numerous studies show that buying stocks at a 52-week high can be an effective predictor for above average growth in the future — and while one must realize that these studies are based on large groups of stocks, they do show consistency over many decades.
When a stock rises above its 52-week high, it’s developing a new pattern and often a new trend. New trends based on fundamental reasons, such as news releases or beating expected earnings, can be sharp and long lasting. A Bauer University study found that nearness to the 52-week high is a better predictor of future returns than are past returns, and that nearness to the 52-week high has predictive power whether stocks have experienced extreme past returns. You can view this study by clicking here.
Once a stock has shown top tier RS, how close a stock is to its 52-week high and how much it has come off of that high is also a strong predictor of whether it is likely to continue to run and display 50%+ gains as top stocks do consistently each year. In future articles, we will talk about how to combine RS with our WAM RS. WAM RS measures the closeness of a stock’s 52-week momentum high. Together, these statistics help pinpoint top tier stocks that are starting to run substantially to the upside.
Market Selection Technique 3 – 52 Week Highs in Top Groups
Stocks that on top RS lists that stay close to their 52-week highs which are also in top RS groups tend to continue longer runs and show stronger gains than others not in top groups. We use a variety of resources to help with this ranking.
- We use Marketsmith to find specific industry groups in the top 20-30 at any given point in time.
- Stockcharts.com helps us for the main eleven sector RS, and
- ETFscreen.com scans among over 500 ETF’s for the top industries and sectors over any given time period.
We teach how to rank groups by RS and periodically provide the rankings in our services, but simply using these mentioned sources can put you on the right track on your own.*
In future articles, we will discuss some additional fundamental and earnings growth requirements. We will also go into more detail about our WAM RS formula and techniques for when to press on the gas pedal and invest aggressively in the market versus when take your foot off the gas. With proper application, these ways can help you minimize drawdowns and exploit especially opportunistic trends (as might be starting right now) more substantially.
Pick The Lowest Hanging Fruit First
To improve your stock trading, integrate the variable shown to improve performance since the late 1800’s with incredible consistency – Relative Strength and Momentum. Figure out how use RS in your own investing approaches if you are not already using it.
* We teach many ways of how to do this in our webinars and workshops. We also have specific applications of these in the PSL service and in our Reedstrader service. We have lots of other criteria for selecting top stocks primed to become outperformers or to continue to be outperformers. We teach a seven-step process in our workshops for finding these stocks. We have also been publishing lists of these stocks for over 25 years in PSL with proven real-time outperformance demonstrated in these lists.