
 I always say that people do not trade the markets; they trade their beliefs about the markets. In that same way, I’d like to point out that these updates reflect my beliefs. I find the market update information useful for my trading, so I do the work each month and am happy to share that information with my readers. If your beliefs are not similar to mine, however, then this information may not be useful to you. Thus, if you are inclined to go through some sort of intellectual exercise to prove one of my beliefs wrong, simply remember that everyone can usually find lots of evidence to support their beliefs and refute others. Simply know that I admit that these are my beliefs and that your beliefs might be different.
These monthly updates are in the first issue of Tharp’s Thoughts each month which allows us to get the closing data from the previous month. These updates cover 1) the market type (first mentioned in the April 30, 2008 edition of Tharp’s Thoughts), 2) the debt statistics for the US, 3) the five-week status on each of the major US stock market indices, 4) our four-star inflation-deflation model, and 5) tracking the US dollar. I also write a report on the strongest and weakest areas of the overall market as a separate SQN™ Report. Significant market changes may mean the SQN Report comes out more than once a month.
Part I: The Big Picture
Since the December 24 lows, the equity indexes had been on a steady rise into the beginning of May. The S&P at the close on Christmas Eve was 2,351. In just over five months (as June 3rd) it has had an increase of 17%. And now we have reached a bull market type — but I have to say that with some caution. The index declined during May and we are no longer over last September’s high mark of 2940.91.
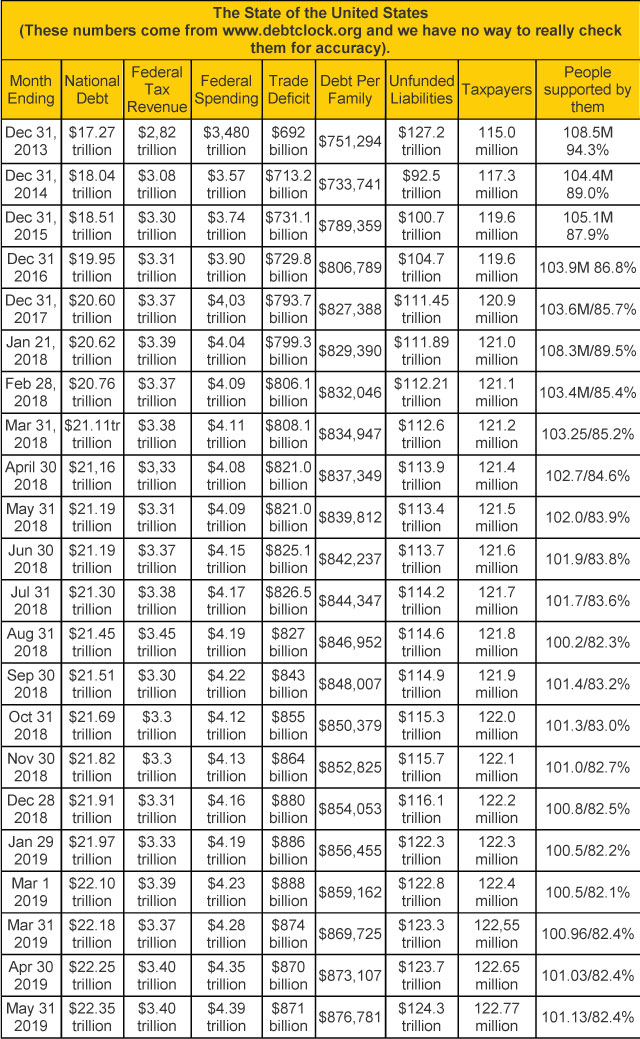
The national debt recently surpassed twenty-two trillion dollars. It went up $100 billion last month and in four months it has increased $350 billion. Your family’s share of the debt went up $4,000+ last month after going up $14,000 the two months before. Did you make $18,000 over the last three months? Remember that all needs to go to the government for its new debt — there is nothing left over for you to live on.
According to the usdebtclock.com site, 169.4 million people receive government benefits. I include only the following for my category — 53.8 million retirees, 10.13 million disabled, and 37.2 million food stamp recipients — which totals 101.13 million. These 101 million people are supported by 122.77 million taxpayers.
Since we started doing these reports in 2013, the national debt has increased by $5 trillion. I first started worrying about the debt, however, when it went over a trillion many years ago. Now, $21 trillion later, what is the difference? A lot of newsletters are now warning of the collapse of the US Dollar due to the high debt to scare you into buying their product.
Part II: The Current Stock Market Type Is Bull Normal
Let’s take a look at the weekly bar chart for the S&P 500 which shows the late September top, the volatile down moves from October through December, and the steady climb from the Christmas Eve low. You can also see that most of May was a down month.
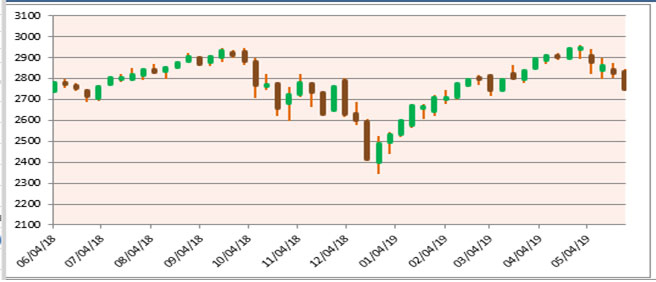
I define the market direction based on the Market SQN using a 100-day period. I also monitor timeframes from 5 weekly bars to 40 weekly bars. Given the bars on the chart above, you can probably understand the direction for each of the periods —
- 200 days – Neutral since Jan 23rd, now Bearish.
- 100 days – Bull last month and still Bull
- 50 days – Strong Bull last month, now Bear
- 25 days – Strong Bull last month, now Bear
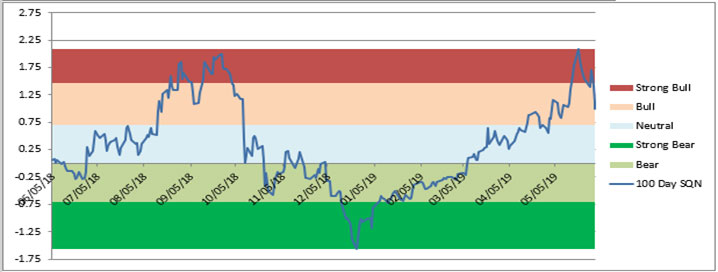
So only our primary measure, the SQN® 100 chart is bullish. The other three time frames are all bearish.
The chart below shows the strong trend from Strong Bear early in the year to Strong Bull and then the current move back down to Bull territory.
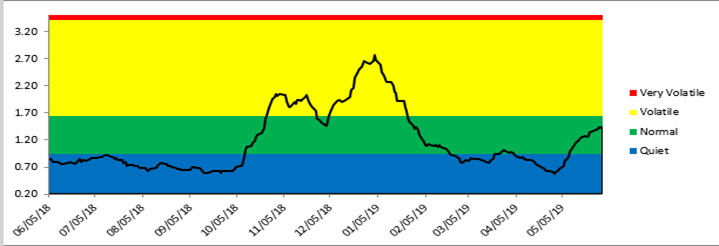
The last chart shows the volatility measurement for the last year. April was very quiet and in May, volatilty has moved into the normal range. The market could go anywhere from here.
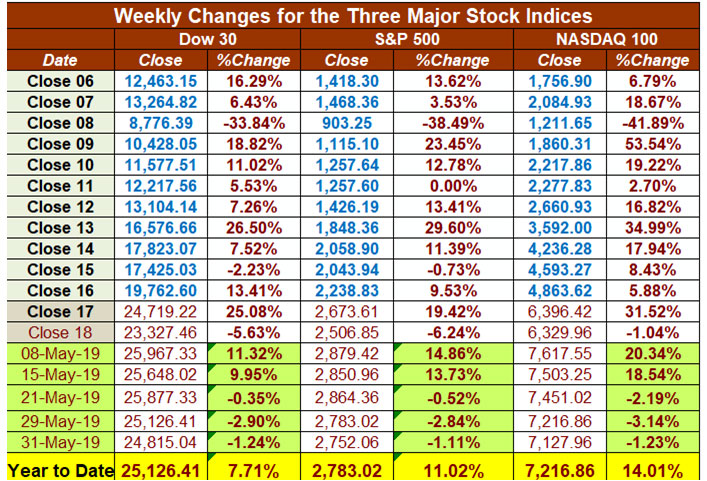
Lastly here are the weekly changes for the three major stock indices for 2019. While the market may have been neutral for the last twelve months, had you been fully invested in the indexes at the beginning of 2019 you’d be up 7.7% in the DOW, up 11.02% in the S&P 500, and up 14.01% in the Nasdaq 100, however, the decreases in May were substantial. One more month like May could wipe out most of the gains for the year. Our last highest high in the S&P 500 was on April 30th.
If your account had been mostly in cryptos last month, it would have doubled (but that would have been after a disastrous 2018).
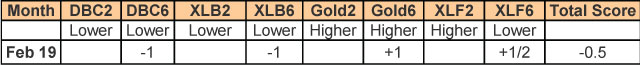
Part III: Our Four-Star Inflation-Deflation Model
The four components of the model were mixed again for the two timeframe measures in May —
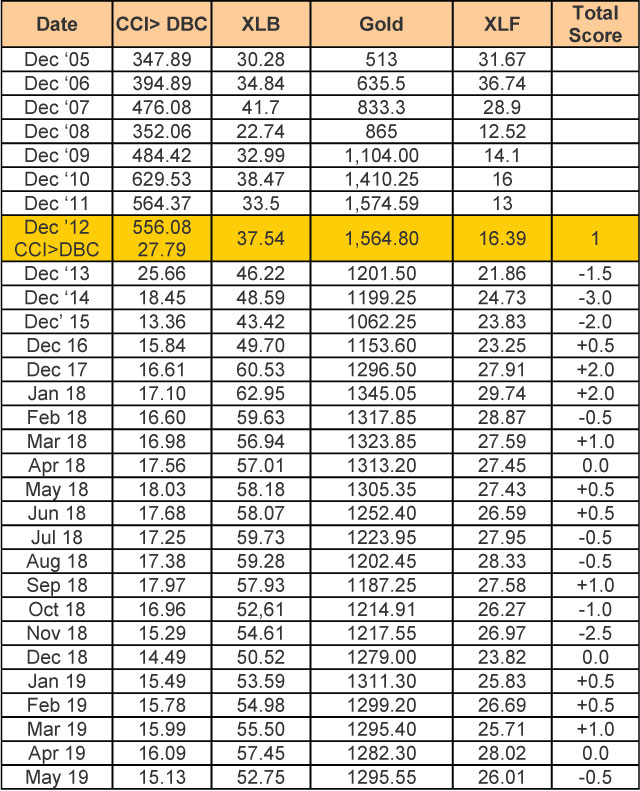
The inflation/deflation model has turned to deflation. Remember we have reached a point in our debt where the Federal Reserve cannot afford long term interest rate hikes — the US could not handle the cost to maintain our debt.
Shadowstats.com still shows the inflation rate (the way it was originally conceived of in 1980) as being around 10%. That adjustment in the GDP suggests that we have been in a recession since 2000 with just one quarter of positive growth.
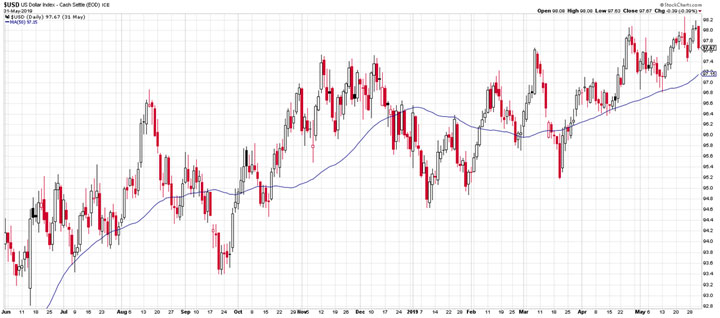
Part IV: Tracking the Dollar
USD is at 97.75 and remains in a slow uptrend but it was relatively flat in May. To put things in perspective, the index started in 1973 at 100. Thus (relative to other fiat currencies which tend to inflate as well) it’s pretty close to its starting point. This is partially because other currencies, such as the Euro are doing so poorly. For example, the Euro is currently at 1.12 dollars.
Conclusion
Let’s look at a few newsletter email headlines I received last month. First, here are the fear based subject lines —
Guru predicts total market crash on October 19th, 2019.
On June 19th an event will happen which will wipe out the retirement savings of most Americans.
Don’t buy cryptos now – there is a big correction coming. (This newsletter writer has remained 70% in cash throughout the recent runup in cryptoassets because he says there will be another big downturn prior to the real move up.)
And on the greed side —
About five newsletter headlines talked about retiring based on buying one Pot stock (a recent IPO) which is trading at 34 cents. (For how long can a stock stay at 34 cents if newsletters are telling the world about what a good buy it is? Or if stays at 34 cents, why does it stay at that level?)
The 5G stock that will change everything about how we operate in the world.
Crypto Haters: 4 things you need to know.
On a good day I can pull in way over $10,000 (and of course, it’s the information in the newsletter, not the writer’s psychology)
I also usually get scary text messages that suggest the US is releasing a new currency (a crypto-currency?) or that there will be a global monetary reset or something of that nature. I find them all useful because none of them are believable. Also, the worse they read, the better I feel about the market. All these headlines are just garbage designed to get you to spend more money on newsletters.
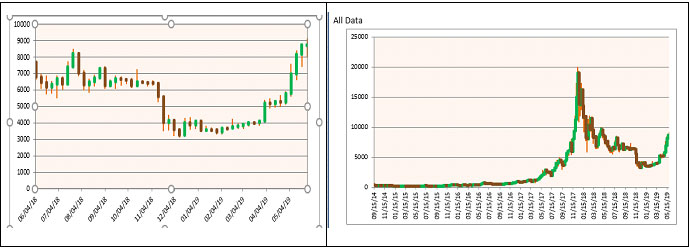
Our purpose is not to predict but to merely reflect on what is happening right now. Stay in the now! What is the market saying right now? In May, the market suggested that growth stocks are not the place to be anymore. Trade wars are not pretty and we are in the middle of a big one. Cryptos are more than making up for it, however, as shown by the following chart of BTC over the last year (below left) and BTC over the last 4.5 years (below right).
Until next month’s update, trade well and be happy.
This is Van Tharp.