
 I always say that people do not trade the markets; they trade their beliefs about the markets. In that same way, I’d like to point out that these updates reflect my beliefs. I find the market update information useful for my trading, so I do the work each month and am happy to share that information with my readers. If your beliefs are not similar to mine, however, then this information may not be useful to you. Thus, if you are inclined to go through some sort of intellectual exercise to prove one of my beliefs wrong, simply remember that everyone can usually find lots of evidence to support their beliefs and refute others. Simply know that I admit that these are my beliefs and that your beliefs might be different.
These monthly updates are in the first issue of Tharp’s Thoughts each month which allows us to get the closing data from the previous month. These updates cover 1) the market type (first mentioned in the April 30, 2008 edition of Tharp’s Thoughts), 2) the debt statistics for the US, 3) the five-week status on each of the major US stock market indices, 4) our four-star inflation-deflation model, and 5) tracking the US dollar. I also write a report on the strongest and weakest areas of the overall market as a separate SQN™ Report. Significant market changes may mean the SQN Report comes out more than once a month.
Part I: The Big Picture
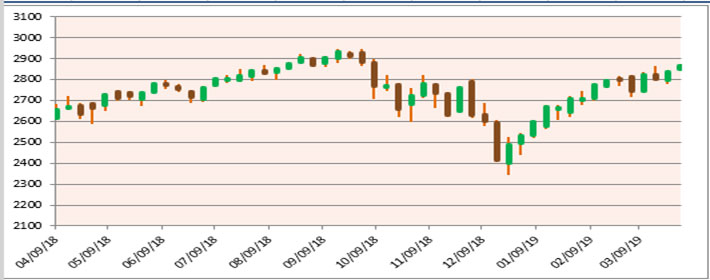
Since the December 24 lows, the equity indexes have been on a steady rise. It’s not enough to be positive using the Market SQN measurement, but close. The S&P rose 25% off of the Christmas Eve close at 2,351 in just over three months closing at 2,828.27 on March 31st. That huge move up has pushed the market type into a Sideways normal. We are not that far from last September’s high mark of 2940.91.
US Debt Clock
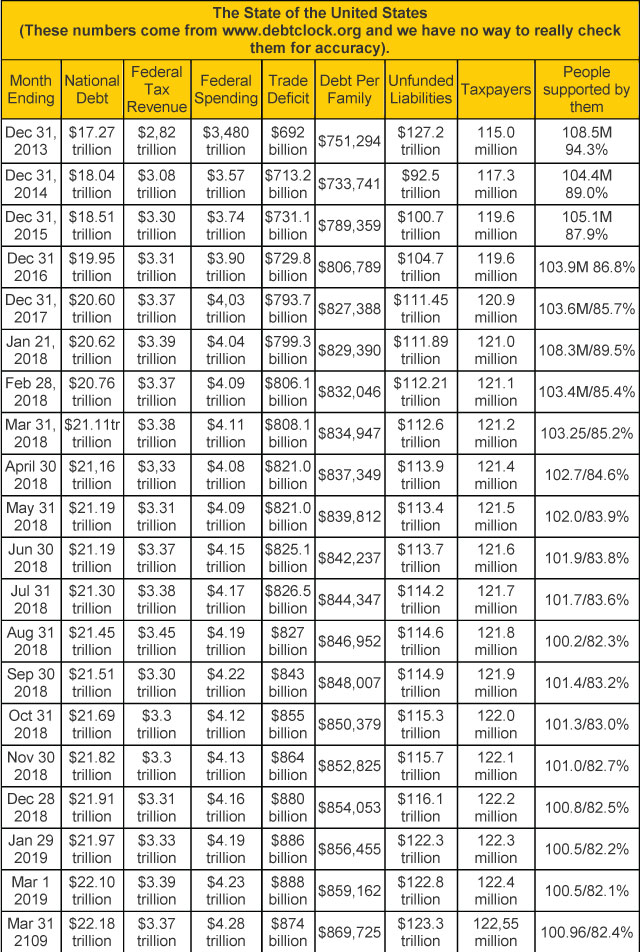
The national debt recently surpassed twenty-two trillion dollars. Is anyone shocked? Surprised? Is anyone even paying attention? And your family’s share of the debt went up $10,000+ last month. Did you make $10,000 last month?
According to the debt clock there are $169.2 million people receiving benefits. It includes retirees (53.72 million), disabled (10.14 million), and food stamp recipients (37.1 million). That’s 100.96 million people supported by 122.55 million taxpayers.
A lot of newsletters are now warning of the collapse of the dollar to scare you into buying their product. However, I was worried about the debt when it went over a trillion. Now 21 trillion later, what is the difference? As you can see, since we’ve been doing these reports starting in 2013, it’s increased by $5 trillion.
And the headlines read,
- Alternative Currency to Replace the US Dollar
- Penny Marijuana Stocks set to Explode on April 1st (They didn’t)
- Beware the Global Monetary Reset is Coming.
- Start with $100 and Retire Rich?
- Why You Should Buy Gold Before Friday?
All these headlines are just garbage designed to get you to spend more and more money on newsletters. If one in 20 is accurate I’d be surprised. So, what’s going on? The market has been going up for most of 2019, but it hasn’t reached the September highs, so we are calling it sideways from a long-term perspective.
Part II: The Current Stock Market Type Is Sideways Normal
This month, let’s take a look at the weekly bar chart for the S&P 500 which shows the late September top, the volatile down moves from October through December, and the rapid climb from the Christmas Eve low.
I define the market direction based on the Market SQN using a 100-day period. For the end of February, the period began at the beginning of October — or 20 bars back on the chart. I also monitor timeframes from 5 weekly bars to 40 weekly bars. Given the bars on the chart, you can probably understand the direction for each of the periods —
- 200 days – Neutral in January, Neutral now
- 100 days – Bear last month, Now Neutral.
- 50 days – Bull last month, now Strong Bull
- 25 days – Strong Bull last month, now Neutral.
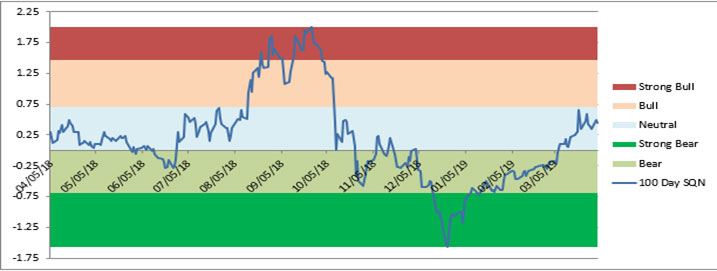
The chart below shows what happened to the 100 day Market SQN score for the past year. As you can see, it started climbing out of Strong Bear territory in late December and is now neutral.
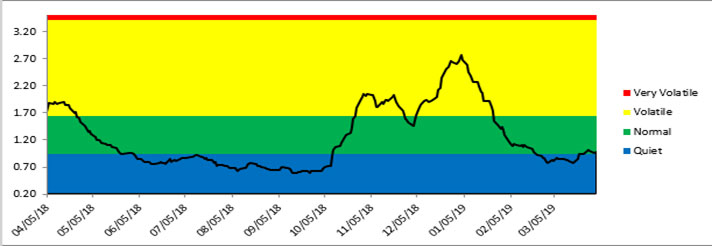
The last chart shows the volatility measurement for the last year — It’s between quiet and normal and I don’t think it shows any sign of concern.
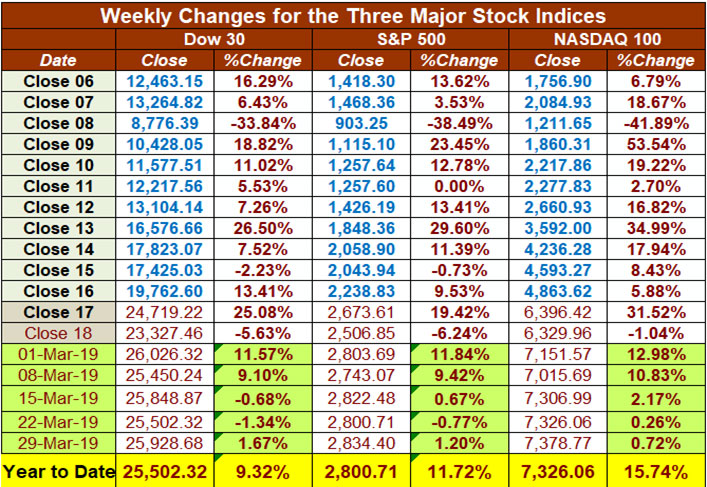
Lastly, here are the weekly changes for the three major stock indices for 2019. While the market may be neutral, had you been fully invested in 2019 you’d have been up almost 10% in the Dow 30, 11.7% in the S&P 500, and 15.74% in the Nasdaq 100. These would be decent returns on the year, but we still have nine months to go.
Part III: Our Four-Star Inflation-Deflation Model
The four components of the model were mixed again for the two timeframe measures
in March —
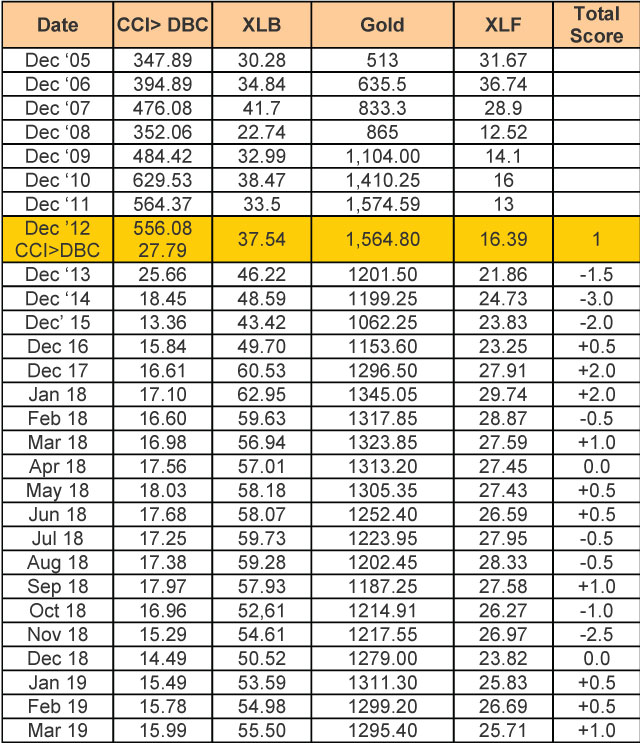
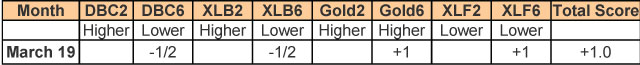
The inflation/deflation model shows inflation is getting a bit stronger. And it’s our third month of inflation this year. The Fed can’t afford to raise interest rates and they have backed off their policy and now say no new rate hikes in 2019. That should keep inflation moving.
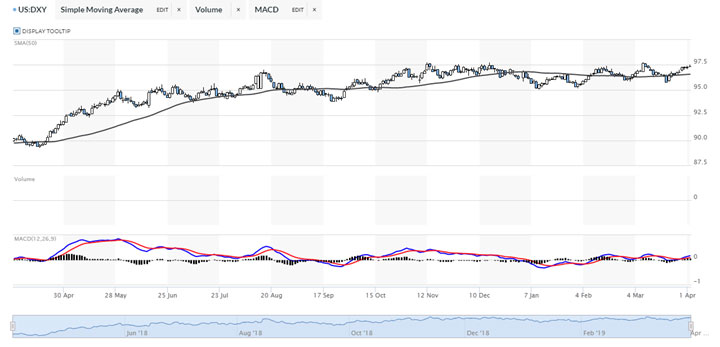
Part IV: Tracking the Dollar
USD remains in about a nine-month trading range though each of the significant lows have been higher. The current range is high in relation to where USD has been in many years. It’s at, or near, its one year highs but is relatively flat. However, the Indian Rupee did increase from 72 to the dollar to 68 to the dollar — just as I was making purchases at the end of my recent trip to India.
Conclusion
From an historical perspective, my market type research has revealed that Bear Quiet market types happen infrequently and they tend to be short lived. Does that mean dramatic action soon in the market? Not necessarily but it does hint that the current market type won’t likely last long.
What’s next? The market type methodology does not predict though it can be helpful. Market types tend to change by either the direction or by the volatility level in one degree movements. That suggests the next market type could continue in a bearish direction and go to normal volatility or continue in quiet volatility and change to a sideways direction. Just by looking at the S&P chart, it would not be unusual to consider that the market backtrack some here or consolidate soon. Thinking like this is more of an exercise in scenario planning rather than thinking about trades. You would not put on any trades with the idea that a particular market pattern is about to happen. Instead, simply consider which of your systems would be tradeable in the market types which are more likely to develop out of the current market type.
Until then, trade well.