
 Today’s quiz actually has two case studies with two charts each.
Part one offers an example of our favorite hybrid trading style that blends the best of swing trading and daytrading, a technique we call core and turbo.
Swing trades form the core position in which we use swing trade patterns to give us a directional bias for the opportunity that may unfold in the next few days. These are moves that are larger than average and which occur in shorter than usual periods of time. When our swing trade systems and strategies indicate opportunity, we are prepared with a trade frame that allows us to trade in either direction and to apply a systematic approach of visualizing and rehearsing all of our routine decisions for entries management and exit.
The turbo portion of this week is to trade intraday when we get a directional move that reinforces the idea of the swing trade. If the swing trade were to work, it has to make a larger than normal move in a direction, and this makes that price action useful to a day trader.
Taken together then the swing trade provides the broad framework of opportunity and the turbo day trade gives us the ability to use tighter stops and larger position sizes with the same dollars at risk. The turbo portion allows us to generate markets money which can be used to replace our core capital to carry overnight risk in the swing trade. In this way the combination of core & turbo technique allows us to leverage the strengths of both swing and daytrading and minimize our overall portfolio risk.
Quiz #1 – Swing Trade Frame Case Study
The first example provides a swing trade frame in symbol EWW (Mexico ETF).
Chart number one shows the swing trade set up in which we had a short position on a swing trade in Mexico and identified the initial risk in the yellow rectangle.
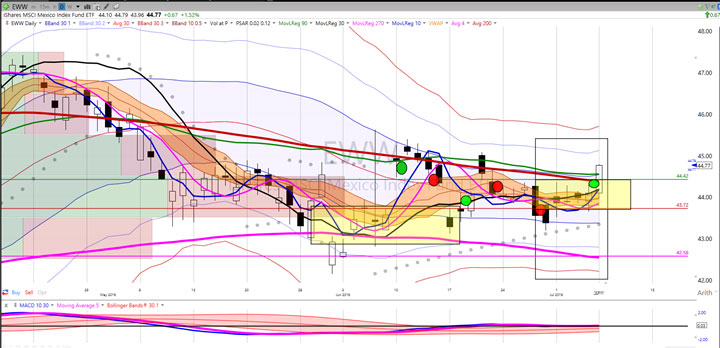
The top edge of that yellow rectangle on the right identifies a price at which the swing trade hypothesis would be invalidated and where we would be justified in having a long side bias for the swing trade. As you can see, the large white daily candle passed through that region which simultaneously triggered an exit on the swing trade and initiated a long side swing trade. This is a manageable approach to swing trading with end of day data in its own right.
Real power for the opportunity, however, comes when you combine this with turbo techniques for intraday trading because the large white open candle represents a low risk trade opportunity intraday which will more than offset the losses of the swing trade and allow us to generate market money to carry overnight in the swing trade while making bank on intraday gains.
Chart number two demonstrates two cycles of intraday trades in which we got multiple positions in a low risk matter based on standard intraday trade framing in the techniques we teach in the daytrading course.
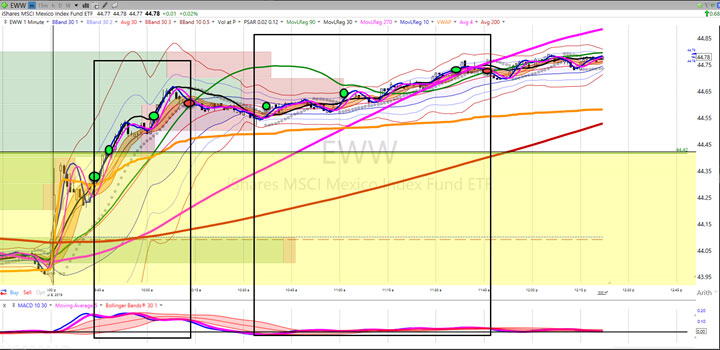
Each of those three entries intraday in each trade cycle is a larger position than the typical swing trade, simply because of our ability to frame the trade with a tighter stop. These turbo trades offset swing trade loss seen on chart 1 and allow us to generate markets money to carry this as a long side swing trade with no risk to our core capital.
This is a standard application of our core and turbo techniques or what we also call “swing trading one day at a time.” It’s not necessary to be a day trader every day to take advantage of this technique. When we get swing trade patterns from systems and strategies that we really like, we are alerted to be ready to trade the next day. So, you can use your time wisely to day trade when conditions are extremely favorable.
Quiz #2 – Continuous Improvement & Exploration
Part two of this trading quiz is to demonstrate how we use the sense making principles of our RLCO/BB framework (regression line crossover / Bollinger band) to routinely look for ways to improve our understanding of markets and price action and to evaluate new and promising ideas that may lead to robust edges and a spirit of continuous learning.
In this example, a very experienced trading partner and collaborator of mine, who is a professional money manager of more than 20 years sent me a chart with a different set of technical indicators that we typically use but which are related in concept and application —
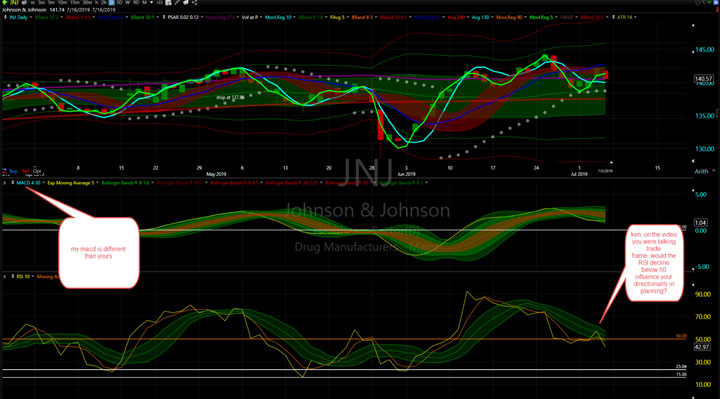
Chart 1 shows his initial chart case study and his critical thinking questions. He asked me to see if this set of indicators might add value or how I might interpret the opportunity that he saw in that chart. He made minor variations on our standard indicators for moving regression lines and then substituted our MACD oscillator for the conceptually similar RSI 10.
Chart 2 shows how I evaluate the trade opportunity in both directions and how I assess the value add of this new combination of technical indicators.
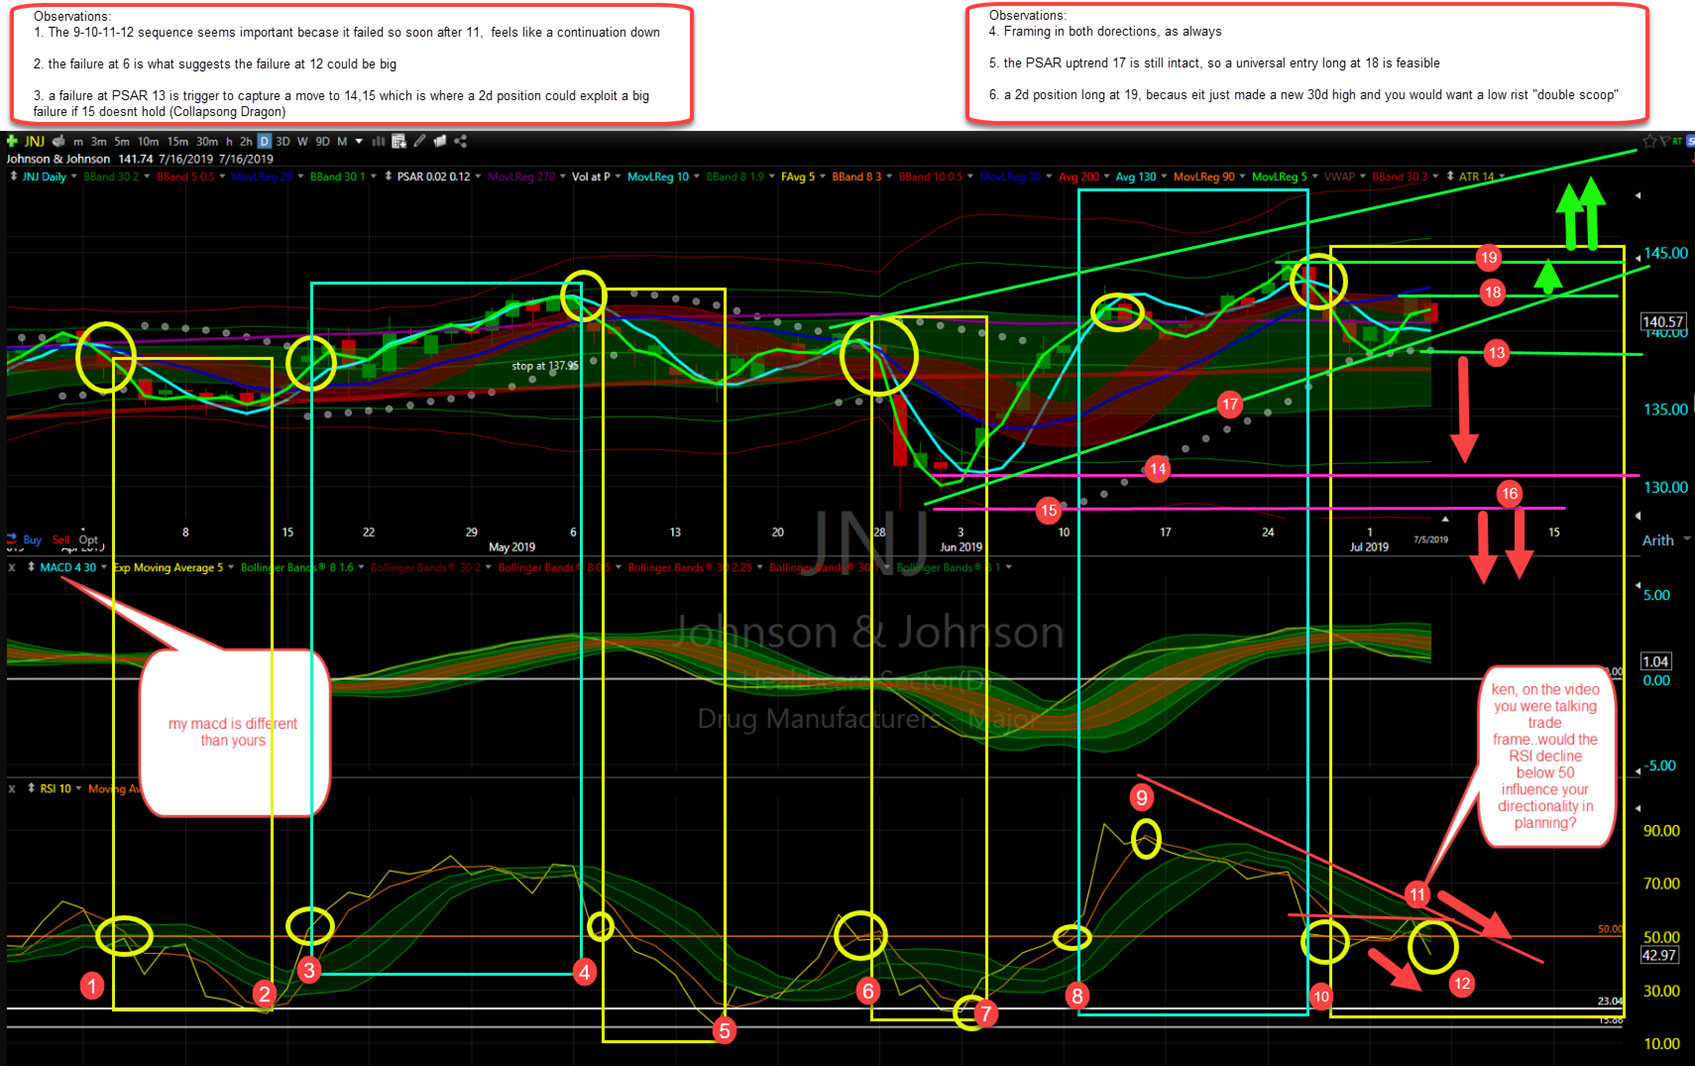
The short answer is that I found his set of indicators useful and tried to demonstrate why through the various markups.
Why Quiz?
We take the position that the time to start developing new ideas and insights is now. We don’t advise waiting until your systems and strategies fail to begin the process of research. The spirit of continuous improvement requires continual care and feeding of your creative and critical thinking skills so that you can be ready for new opportunities when they occur tested and practical tools.
Competent professionals use good time management techniques to ensure that we refine our practical production systems. Example 1 with the Mexico ETF satisfies the need for continuous learning and improvement which is also demonstrated in example 2.
Sharing ideas in this common research and production framework in a collaborative environment is with the tortoise community of practice is all about.
Thanks for your kind attention!