
Ken Long Reviews Successful Trades
Click here to listen to Ken narrate the trade on YouTube
Posted on June 15, 2018
A note to readers: This article is from a previous publication and may contain outdated information, missing links or images.
Notes from a Trading Session
Mastermind groups can help traders identify new opportunities and strategies and provide the technical and emotional support needed to navigate difficult markets. These groups represent the synergistic collaboration that everyone brings to new and exciting trade ideas. The Tortoise mastermind group is a collaborative learning environment where traders can meet and develop a deeper understanding of swing and day trade strategies through the active practice of trading.
At a recent meeting in Kansas City, some Tortoise Mastermind members got together to exchange ideas and research in person and then traded live together for a week to put the ideas into action. One intriguing idea was to reduce the information processing load by making our charts simpler. We experimented with hiding our price candlesticks and found it was easier to see signals without the price noise getting our attention. The chart below reflects a recent example of an interesting trade from the chat room using this technique.
But first let me describe what the indicators on the chart are and how I like to interpret them so that you can see the same low-risk trade I see. The light blue channel is a Bollinger band using a 30-period look-back, with the red line being the 30-period simple moving average. I use this indicator to tell me when the price has moved a significant distance from the mean, thus creating a trading opportunity. The gray, almost invisible line is the closing value of a 3-minute bar. Remember that the main idea is to not be distracted by the price but to use indicators to guide your trading. The black and blue lines are the 30- and 10-period regression lines of the closing price. A regression line is the line that is the best approximation of price action in the given time frame. It smoothes the price action and is more adaptive than a moving average. The last indicator is the purple line, which is the volume weighted average price (VWAP). This tells us the price at which most of the volume of trades has occurred, and could be interpreted as the current “fair market price.”
And now, the trade…
Setup:
Starting around 12:00 p.m., IWM (Russell 2000 small cap index ETF), had settled into a Sideways Quiet Channel (SQC). The Bollinger bands had begun to squeeze, which indicates that pressure is building and something is about to happen. Around 1:30 p.m., the Bollinger band channel had a lower channel support at $82.80 and the 30- and 10-period regression lines were both below the red 30-period moving average, which indicated a possible break-out to the down side.
Trigger:
We entered short at $82.80, when the 10-period regression line broke below the lower Bollinger band channel and below the purple VWAP. We placed a capital preservation stop at $83.00 (twice the width of the channel), with a reasonable potential that the breakdown would go to $82.40 to retest the current low of the day (LOD). The price didn’t hesitate, however, until it went to $81.85 and began to rebound.
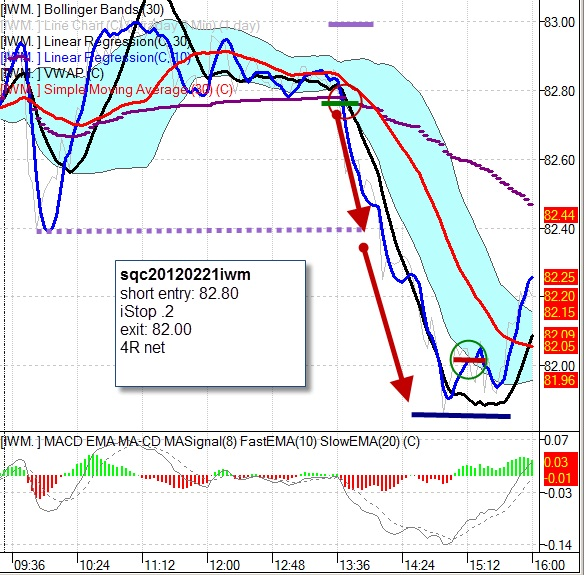
Exit:
We exited at $82.00, when the 10-period regression line re-entered the Bollinger band channel for a profit of $0.80/share on $0.20 risk for 4R.
Using this trading style on a TF futures contract would have captured 8 index points ($800 per contract). This trade has no overnight risk because it will be closed before the end of the day.
These are tough times for everyone, but there are low-risk trades out there. If you would like to see more low-risk trading ideas and discuss those ideas with me and others, I invite you to come to the Mechanical Swing and Day Trading Systems for Equities and ETFs 3-Day Workshop and the Live Discretionary Swing and Day Trading Workshop. It’s a lot of fun, and a lot of new and interesting low-risk ideas are always presented.
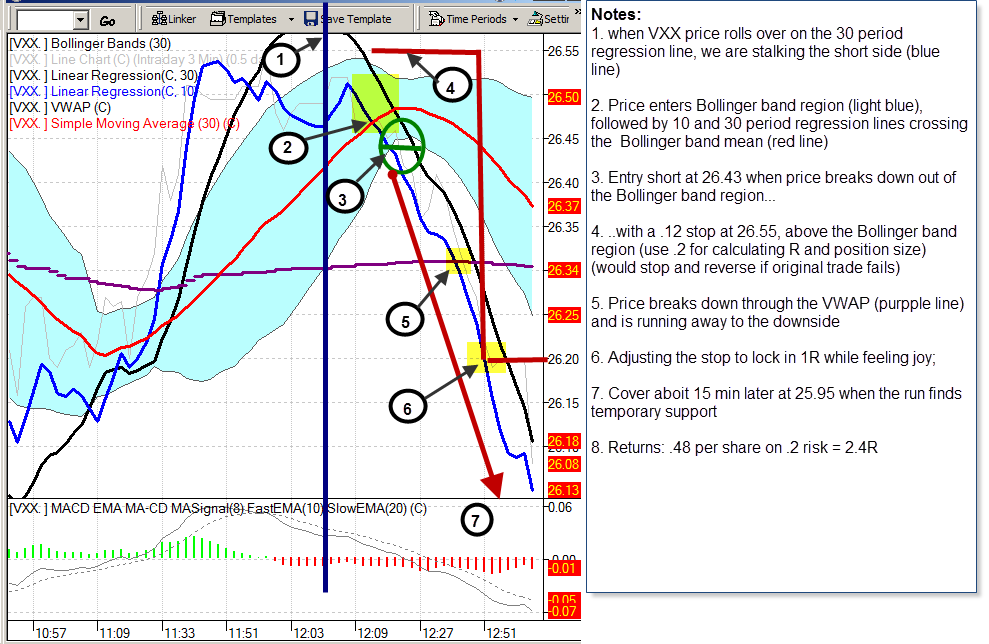
Below is a second trade with the same trading rules as above. Click the video link at the bottom of this page for details
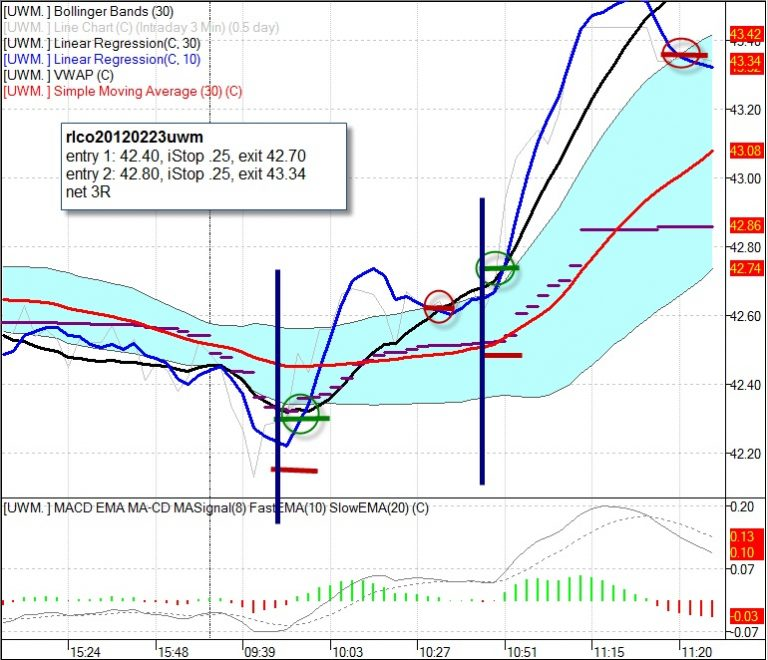
This third trade shows the same idea. We’ve left the text off to see if you can spot the same patterns in play. Do you see what’s going on?
Listen to Ken’s Narration of The Trade Here
Learn about Ken Long’s upcoming workshops and register to attend!