
 I always say that people do not trade the markets; they trade their beliefs about the markets. In that same way, I’d like to point out that these updates reflect my beliefs. I find the market update information useful for my trading, so I do the work each month and am happy to share that information with my readers. If your beliefs are not similar to mine, however, then this information may not be useful to you. Thus, if you are inclined to go through some sort of intellectual exercise to prove one of my beliefs wrong, simply remember that everyone can usually find lots of evidence to support their beliefs and refute others. Simply know that I admit that these are my beliefs and that your beliefs might be different.
These monthly updates are in the first issue of Tharp’s Thoughts each month which allows us to get the closing data from the previous month. These updates cover 1) the market type (first mentioned in the April 30, 2008 edition of Tharp’s Thoughts), 2) the debt statistics for the US, 3) the five-week status on each of the major US stock market indices, 4) our four-star inflation-deflation model, and 5) tracking the US dollar. I also write a report on the strongest and weakest areas of the overall market as a separate SQN™ Report. Significant market changes may mean the SQN Report comes out more than once a month.
Part I: The Big Picture
Equity indexes have been rising since the December 24 lows last year. The most recent highest high in the S&P 500 was on June 20th which took out the September 2018 highs. On June 28th, the S&P closed at 2941.76. In just over six months, that’s an increase of 25% from the market bottom in late December.
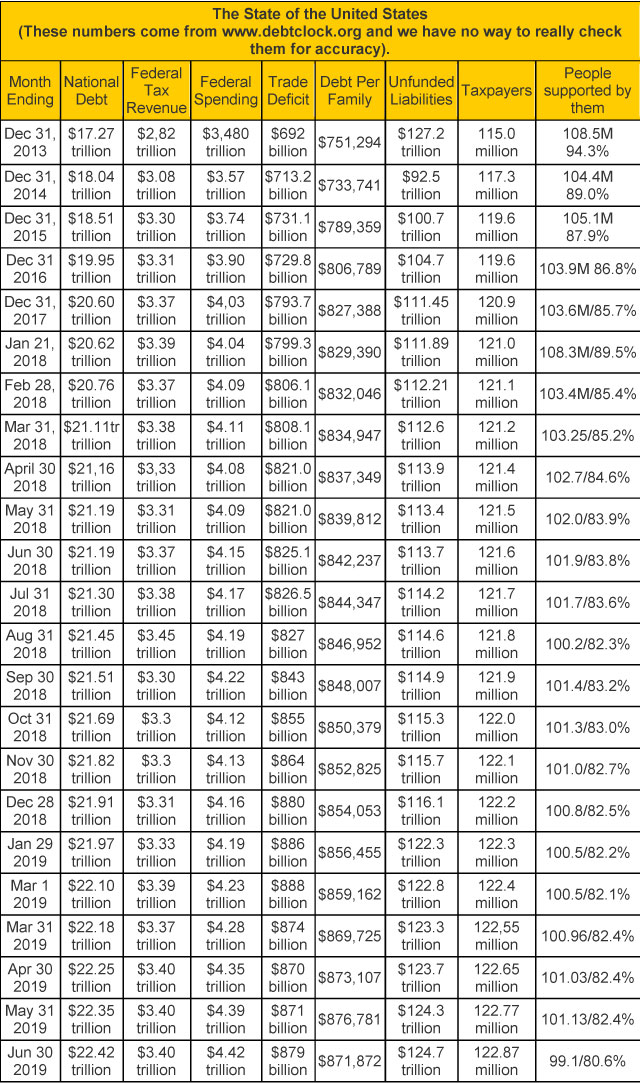
The national debt recently surpassed twenty-two trillion dollars. It went up $170 billion in the last two months. And in the six month since the start of the year, it increased by $260 billion. Your family’s share of the debt went up by $29,545 — about half of the median household income in the US at $61,372.
According to the usdebtclock site, there are 169.7 million people receiving government benefits. For my category above, I include only retirees (54.0 million), disabled (10.1 million), and food stamp recipients (35.0 million). That’s 99.1 million people supported by 122.9 million taxpayers.
A lot of newsletters are now warning of the collapse of the dollar to scare you into buying their product, however, I was worried about the debt when it went over one trillion. $22 trillion later, what is the difference? As you can see, since we’ve been reporting these figures since 2013, the debt has increased by $5 trillion.
The newest scare tactic by newsletters is saying that cash will be outlawed soon and you will have to pay for things electronically. The reason for that is so the banks can charge negative interest rates. In other words, the banks will charge you interest for having your money deposited with them. If that were to happen, most people would want to withdraw their money from the banks and hence the need for the government to outlaw cash. Further, if cash were to be outlawed, cryptoassets will absolutely take off especially the anonymous cryptocurrencies such as DASH and Monero.
Part II: The Current Stock Market Type Is Bull Quiet
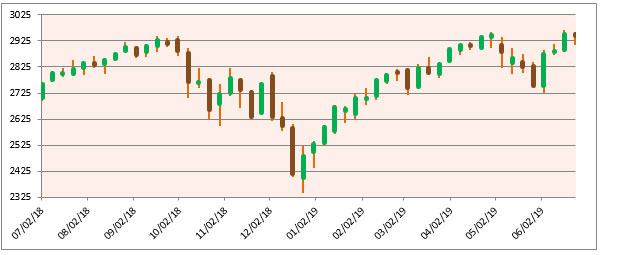
Let’s take a look at the weekly bar chart below for the S&P 500 which shows the late September top, the volatile down moves from October through December, the rapid climb from the Christmas Eve low, and May’s drop. You can see that May’s drop was recovered in June.
I define the market direction based on the Market SQN using 100 days. I also monitor timeframes from 5 weekly bars to 40 weekly bars. Given the bars on the chart, you can probably understand the direction for each of the periods —
- 200 days – Neutral since Jan 23rd
- 100 days – Bull last month and still Bull
- 50 days – Neutral last month, Neutral again
- 25 days – Bear last month, now Bull
So now all of our measured periods are either Neutral or Bull.
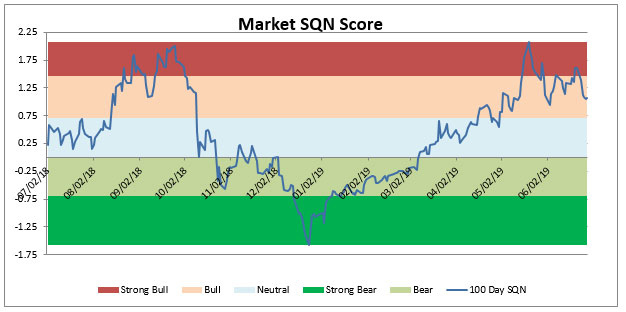
The chart below, shows the strong trend from Strong Bear early in the year to Strong Bull and then the move back down to Bull recently.
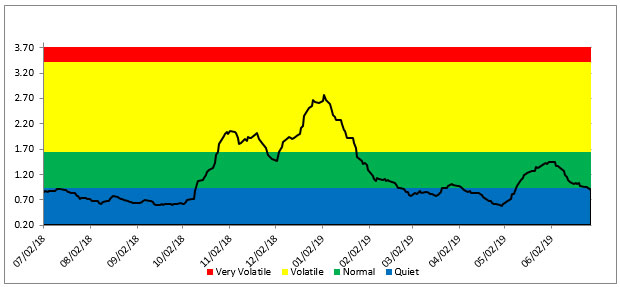
The third chart shows the volatility measurement for the last year. Last month, volatility was Normal and this month it has moved into Quiet.
Lastly here are the weekly changes for the three major stock indices for 2019.
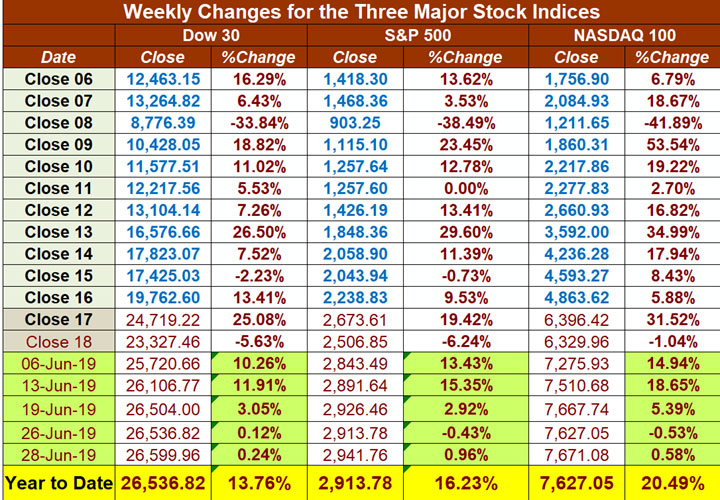
If you had been fully invested in the stock market from January 1, 2019, you would be up double digits in the DOW and the S&P 500. You’d also be up over 20% in the NASDAQ 100. If you had invested in BTC on January 1st of this year, your position would be up about 200% on June 30th.
Part III: Our Four-Star Inflation-Deflation Model
Three of the four model components were showing inflation in June —
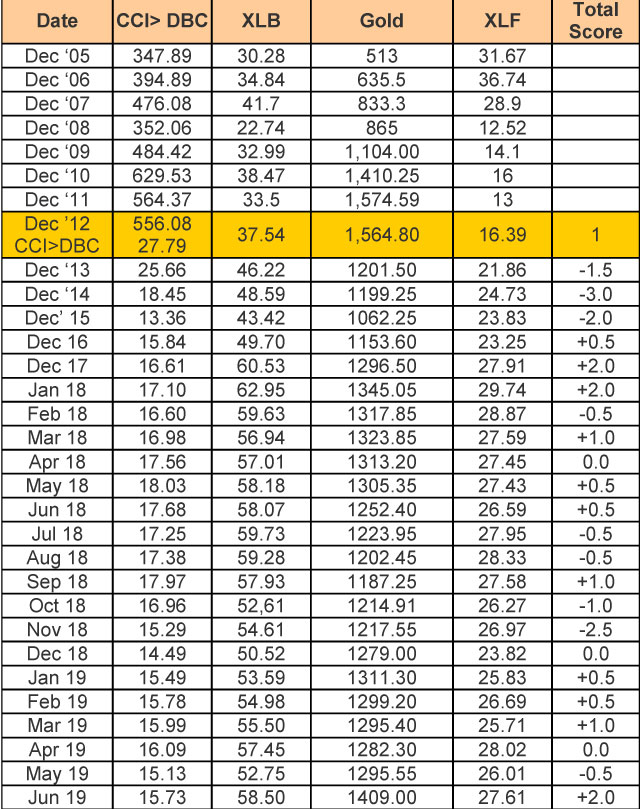
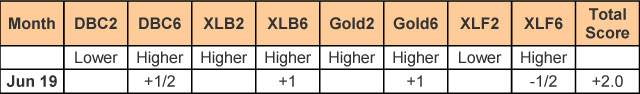
The inflation/deflation model has returned to inflation with June’s reading of +2.0. This is one of the bigger monthly jumps we have seen but we’ll see if it lasts.
Shadowstats.com still shows the inflation rate (as originally conceived in 1980) as being around 10%. Adjusting the GDP for the original inflation calculation suggests that we have been in a recession since 2000 with just one quarter of real growth.
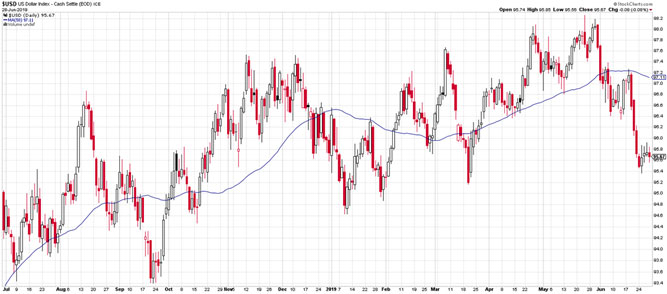
Part IV: Tracking the Dollar
USD is at 95.67 after closing at 97.75 last month. The Dollar declined for most of the month of June as gold hit its highest value in a number of years and BTC soared.
To put the value of the USD in a longer term perspective, remember that the index started in 1973 at 100. Thus (relative to other fiat currencies which tend to inflate as well), it’s pretty close to its starting point. This is partially because other currencies such as the Euro are doing so poorly. For example, the Euro is currently at 1.14 dollars.
Conclusion
Trade wars are not pretty and we are in the middle of a big one. One of my Super Trader candidates has gone back to China to visit his parents for several weeks. He said that Chinese media are pouring a lot of negative information about the US and Donald Trump onto the people so he doesn’t see the trade war ending soon. In the meantime, a lot of Chinese goods are bypassing the tariffs by going out through Vietnam.
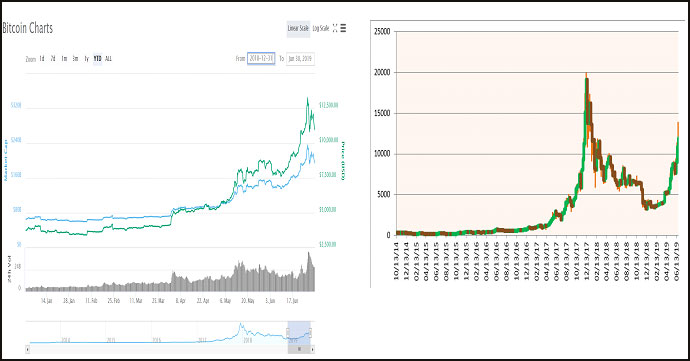
Cryptos are more than making up for the trade war’s effect on equities, however, as shown by the following charts of BTC over the last six months (below left) and the last four and a half years (below right).
Our purpose is not to predict but to merely reflect on what is happening right now. Stay in the now!
Until next month’s update, this is Van Tharp. Trade well and be happy.