
 I always say that people do not trade the markets; they trade their beliefs about the markets. In that same way, I’d like to point out that these updates reflect my beliefs. I find the market update information useful for my trading, so I do the work each month and am happy to share that information with my readers. If your beliefs are not similar to mine, however, then this information may not be useful to you. Thus, if you are inclined to go through some sort of intellectual exercise to prove one of my beliefs wrong, simply remember that everyone can usually find lots of evidence to support their beliefs and refute others. Simply know that I admit that these are my beliefs and that your beliefs might be different.
These monthly updates are in the first issue of Tharp’s Thoughts each month which allows us to get the closing data from the previous month. These updates cover 1) the market type (first mentioned in the April 30, 2008 edition of Tharp’s Thoughts), 2) the debt statistics for the US, 3) the five-week status on each of the major US stock market indices, 4) our four-star inflation-deflation model, and 5) tracking the US dollar. I also write a report on the strongest and weakest areas of the overall market as a separate SQN™ Report. Significant market changes may mean the SQN Report comes out more than once a month.
Part I: The Big Picture
Since the December 24 lows last year, the equity indexes have been rising. After a dip in May, the S&P recovered in June and went on to new highs in July.
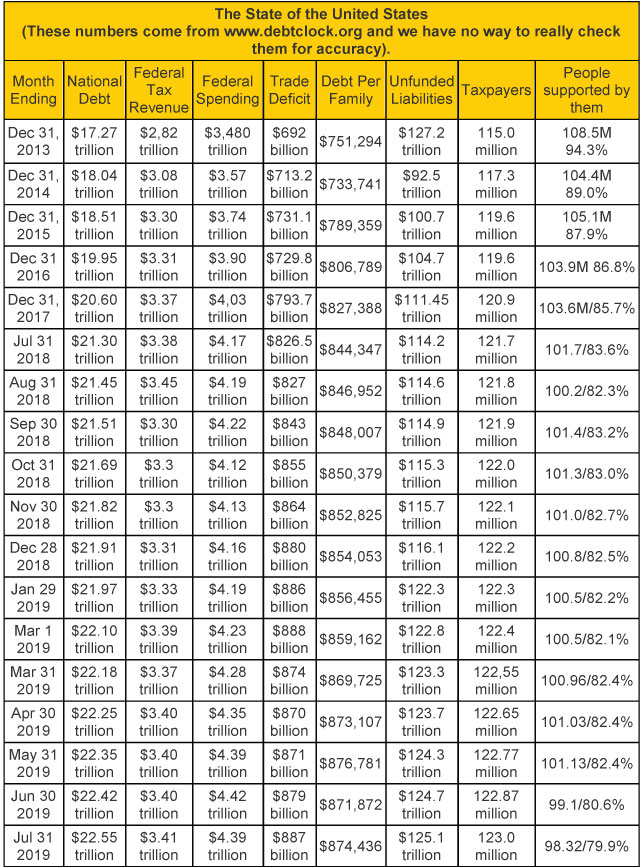
The national debt recently surpassed twenty-two trillion dollars. It has gone up $200 billion in the last two months and in the seven months of 2019, it increased by $640 billion. In that time, your family’s share of the debt went up by $30,089. The median household income in the US is $61,372 – so the increase in your family’s share of the national debt is about half the median income.
According to the usdebtclock.com there are 169.7 million people receiving benefits. In my calculation for people receiving government support, I include only three categories – retirees (53.7 million), disabled (10.06 million), and food stamp recipients (34.56 million). That’s 98.32 million people supported by 123 million taxpayers. What’s interesting is that rate has gone down from 82.4% to 79.7% in the last few months. Is that something the Trump administration is doing or a change the way statistics are gathered and reported? Remember there are lies, damned lies, and government statistics.
A lot of newsletters have been warning recently about the collapse of the US Dollar to scare people into buying their product, however, I was worried about the debt when it went over one trillion many years ago. $22 trillion later, what is the difference? You can see in the table above, it’s increased by $5 trillion since we started reporting these figures in 2013.
There’s another newsletter scare tactic lately where they say that cash will be outlawed soon and you will have to pay for things electronically. Then banks can charge negative interest rates. In other words, the banks will charge you interest for having money on deposit with them. If that were to actually happen, most people would withdraw their money from the banks and hence the need for the government to outlaw cash before that would happen.
You’ve heard me talk about the crypto boom that will happen just because institutions want to put a small percentage of their money (i.e. 2-3%) into cryptos. Well if cash were to be outlawed, cryptoassets will absolutely take off and the ones that will benefit the most will be the anonymous cryptocurrencies such as DASH and Monero.
Plus you are now hearing from the government about what a disaster the Facebook Libra will be. Some government officials want to enact a law preventing high tech firms from entering the crypto space or only if they become chartered as a bank. Well what’s really going on is an attempt at a massive power shift. Old money, those with money and power at the end of the 19th century, have had control of our financial system and government for the last century. That source of money, however, is not the biggest money any more. In fact, one half of the world’s wealth is now controlled by the top 1% of the world’s billionaires and most of that money is new. Think of people who own the biggest tech companies — Jeff Bezos and Bill Gates come to mind. The Google founders and Mark Zuckerberg are in that category too.
Facebook announced that Libra is going to be a stable coin – but not a US Dollar stable coin like Tether. Instead, Libra would be based on a combination of international currencies. Libra poses a huge threat to the old wealth that runs our country — think Rockefellers, DuPonts, Vanderbilts, Rothschilds, etc. Facebook’s Libra would become an alternative currency for the people of many countries. For the Federal Reserve, Libra poses a real threat to its authority and to the the US Dollar. That’s why all the fuss. Libra is disrupting the game big money plays. Those with big money are in power and make the rules. One of their goals is to ensure they stay in power and don’t turn that power over to new wealth.
Part II: The Current Stock Market Type Is Bull Quiet
Let’s take a look at the weekly bar chart below for the S&P 500 which shows the late September top, the volatile down move from October through December, the rapid climb from the Christmas Eve low, May’s dip and June’s recovery. You can see that the tops in July surpassed June.
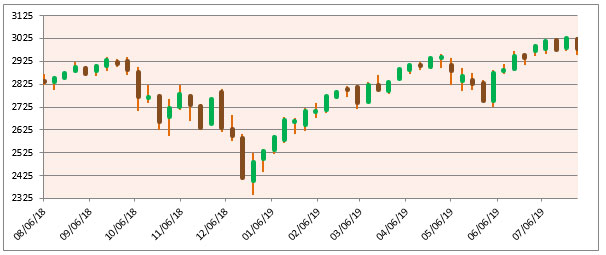
I define the market direction based on the Market SQN using 100 days which puts the start of the period back in late April. I also monitor timeframes from 5 weekly bars to 40 weekly bars. Given the bars on the chart, you can probably understand the direction for each of the periods —
- 200 days – Neutral since Jan 23rd and Neutral now
- 100 days – Bull last month and still Bull
- 50 days – Bull last month, now still Bull
- 25 days – Bull last month, Bull now
So now all of our measured periods are either Neutral or Bull.
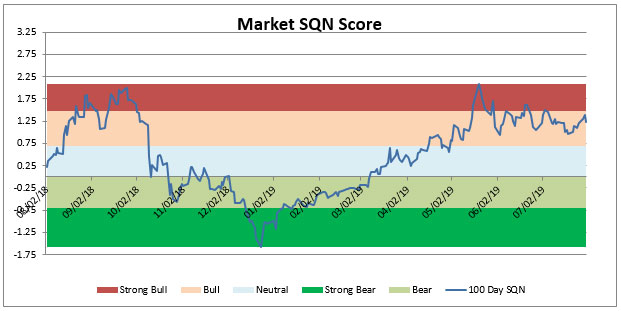
The chart below shows the strong trend from Strong Bear early in the year to Strong Bull and then the bullish range for the last two months.
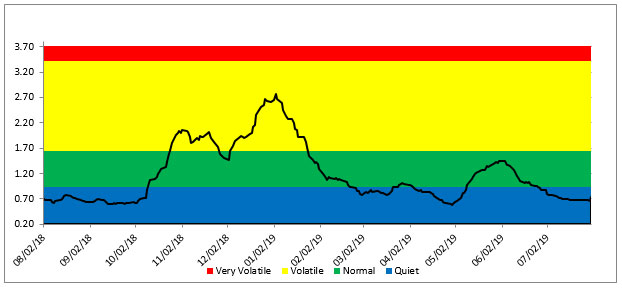
 The third chart shows the volatility measurement for the last year. Last month, volatility was Normal and this month it has moved back into Quiet.
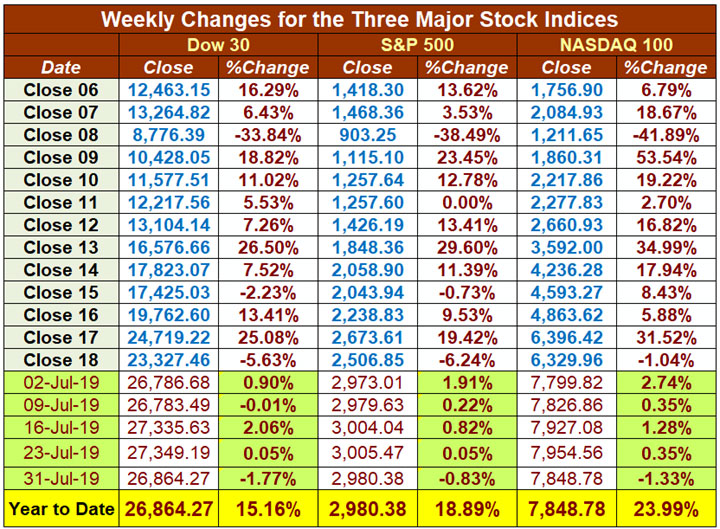
 Lastly here are the weekly changes for the three major stock indices for 2019. The Market SQN for 100 days may be Bull but if had you been fully invested from the beginning of 2019, you’d be up double digits in any of the top three equity indexes. In the S&P, you’d be up nearly 20% and you’d be up nearly 25% in the NASDAQ 100. Our last highest high in the S&P 500 was on July 25th which took out the June highs.
If your account had been in BTC most of this year, it would be up about 300% and that’s much better than anything the stock market could offer. BTC right now, however, is at the low end of a $4,000 wide trading range.
Part III: Our Four-Star Inflation-Deflation Model
Three of the four components of the model were decidedly inflationary again in July —
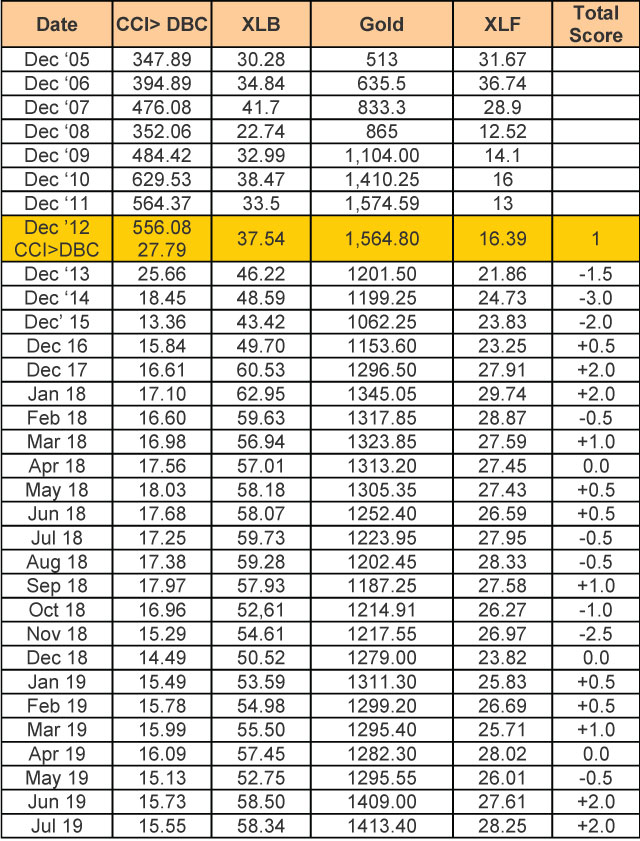
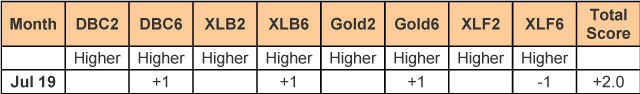
The model indicates inflation forces are strong again in July after a strong inflation signal in June. Both months had readings of +2.0. Two big inflation jumps in a row and the Fed has lowered interest rates — those are generally good signs for the stock market.
Shadowstats.com still shows the inflation rate (as it was originally conceived in 1980) as being around 10%. With that adjustment in the GDP, the original inflation rate suggests that we have been in a recession since 2000 with just one quarter of non-recession.
Part IV: Tracking the Dollar
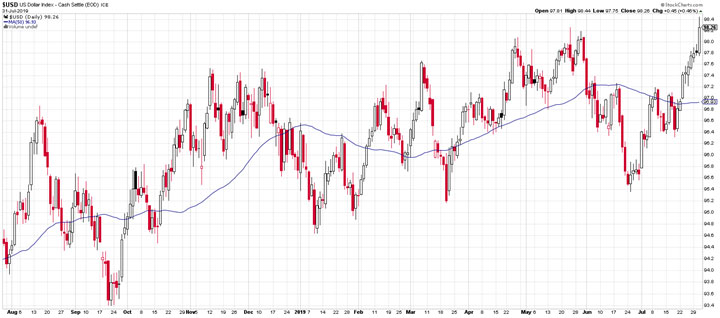
USD is at 98.26 after closing last month at 95.67. For most of June, the Dollar declined and then rose for nearly all of July. While USD is up for the month and at the top end of a trading range for the last few quarters, let’s put the value of the USD in a longer term perspective. Remember that the index started in 1973 at 100 and therefore is pretty close in relative terms to other currencies to its starting point more than 40 years later.
Conclusion
The Fed decreased rates yesterday but then said don’t expect much more. The market went down in response. Where will it go from here? Continued low volatility, lower interest rates, and inflation starting to pick up could help the market stay in a bullish mode.
Our purpose, however, is not to predict. We focus on what is happening right now. Right now, the market is a Bull Quiet market type. Stay in the now!
Until next month’s update, this is Van Tharp. Trade well and create the life you want for yourself.