
 Market Selection is typically the least developed area in most traders’ trading plan. Traders (including me) often spend thousands of dollars and hundreds of hours learning how to improve their trading methods in search for the Holy Grail! Just find that one system or method that will allow you to always be right and you have found your path to riches!! We have all seen it if not in ourselves, then at least in others ;).
My own experiences taught me to pursue a very different path. Let me highlight a couple of events that influenced my thinking.
Early in my career, I started working for a group of agricultural option market makers which included the largest agricultural market maker at the Chicago Board of Trade. The year was 1988 and the Midwest was having one of the worst droughts on record. The soybean market went crazy and I was in awe of the profit and loss statements (PNL) of the soybean traders in the group. By the end of June, each of the traders were up between $1M-$4M each. In 1988, that was a lot of money!! Anyway, in the subsequent years, I learned the 1988 soybean trading results were an exception, not the norm. In the following years, weather was great and crops were abundant while I watched the largest trader struggle to make more than $500k/year. Other traders were in the $150k-$300k range. Every year began with the excitement of possibly having another drought year?!? Why was this? Because everyone knew that their PNL would explode if we had a weather problem such that volatility would soar along with prices. It’s a weird scenario however, when you find yourself rooting for events that would produce profits for you but cause pain to so many others.
Then during the dot-com boom in the late 1990’s, equity option traders were making a killing. There were stories of people trading Netscape, Amazon, Juniper Networks, etc. who were making several million dollars a year. I know one option trader who made $10M trading Yahoo in 2000. There were several new traders who were making $500k/year in 1999 and 2000. Just two years later though, I was interviewing some of these same traders for a $30k/year clerk job. Why would they interview for such a low paying job? Because the equity options market had died down and they could no longer make money. They hadn’t been great traders, they had just been in the right market at the right time.
Across markets and over more than thirty years of trading, I’ve seen this consistently —
- Great traders always make money. The only question is how much? In mediocre markets, great traders make a living. In great markets, great traders become the stuff of legend.
- Mediocre traders can make money trading a great market but in a mediocre market, they go broke.
Profitability, Volume, and Volatility
To further make this point, my old trading firm researched our profitability in different markets and over time for periods with different market volume and market volatility. The results were really interesting.
- Scenario #1 — We found the relationship between our average profit and volume was nearly linear.
- Example — If we made $5,000/day on average in a market that traded 50,000 contracts a day and volume doubled to 100,000 contracts, our profitability would rise to about $9,500/day (95% correlation).
- Scenario #2 — We found the relationship between our average profit and volatility was EXPONENTIAL.
- Example — If we made $5,000/day on average in that same market with a baseline volatility of 10%, we found that when volatility doubled to 20%, we would make $20,000/day. When volatility hit 40%, we would make $60,000 per day.
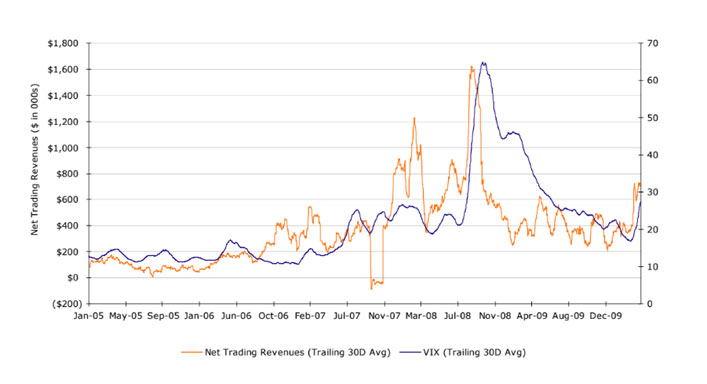
The graph below shows our firm’s trading profitability relative to VIX from 2005-2010. You can see that when VIX took off, so did our profitability. The VIX going up 300% led to an 800% increase in trading profitability!
What Does This Mean For You?
Create an approach that looks for the top markets to trade. How? Search for markets that exhibit two trends — increasing volume accompanied by increasing volatility. These markets will be much more lucrative for you to trade. The examples above were part of major trends that had the movement for us to achieve “Big R” winning trades.
There are only 2 leading indicators in trading, flows and volume. Proprietary trading firms spend millions of dollars to gain access to flows via technology or relationships. The average trader lacks this edge but you do have access to volume information. For volume, realize that the most important aspect is Impactful Volume. Impactful Volume destabilizes the market causing volatility. When this happens, the market loosens up and pockets emerge where there’s a lack of volume because buyers and sellers are unwilling to trade with each other in a particular price range. These pockets show the market has become unstable and produce volatility. Volatility increases the size of the trading range and makes Big R winning trades possible.
Let me show you some examples. To help identify range expansion, Point and Figure (P&F) charts can be a great tool. For those of you unfamiliar with Point and Figure charts, here is a quick link to Investopedia’s explanation on Point and Figure Charting.
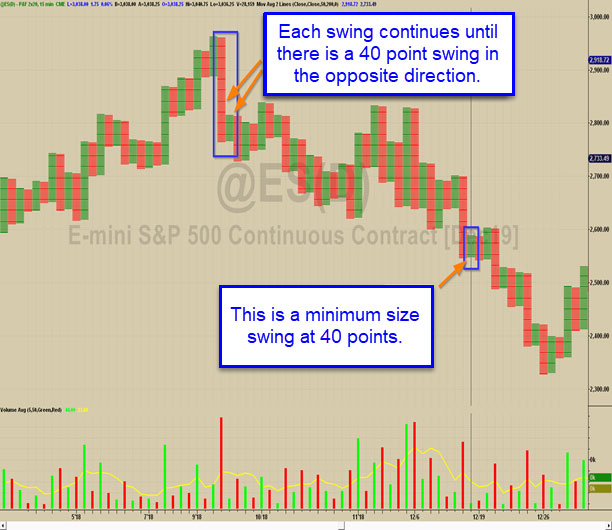
Basically, Point and Figure charts create a chart that can show important price swings independent of time. The following P&F example shows the S&P e-mini contract (ES). The 250 Day (1 year) average of the Average True Range (ATR) indicator for 14 days on the ES is roughly 40 points. We create a Point and Figure Chart using 2-point minimum increments per box and 20 boxes per swing. Each swing will therefore be 40 points or greater. When a swing moves by 40 points, it creates a new column and that column continues to grow until there is a move in the opposite direction of 40 points. When that happens, the chart starts to builds a new column in the opposite direction.
Example of Point and Figure Chart for ES
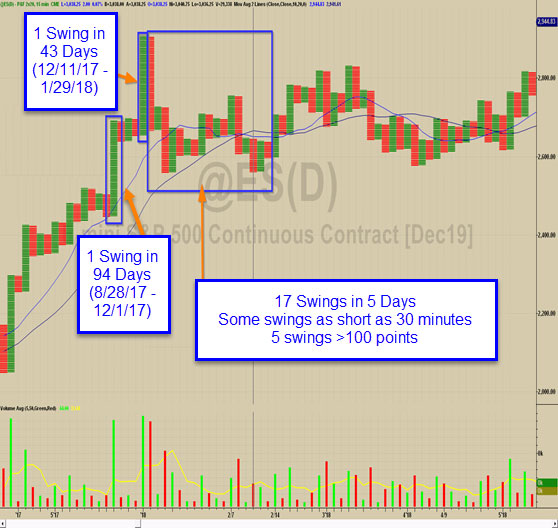
The P&F charts price from April, 2017 through May, 2018. From August 30, 2017 through January 29, 2018, the market moved persistently higher but in smaller and smaller ranges. This pushed VIX to all-time lows, however, that changed dramatically starting on January 29, 2018 as the market started to revert from extreme overbought conditions back to the mean causing volatility to explode. Just one week later, we went through one of the most volatile periods in ES history. We can see both environments in the following chart:
Understanding volatility can pay off handsomely. I know of a trading group which ran a VIX ETF arbitrage strategy where they basically calculated the fair value of VIX and the related VIX ETFs. When they found a mispricing related to fair value between two of the ETFs, they would buy one ETF and sell the other. For several years, this strategy made a consistent $1-$2M per year. In the analysis of the overall strategy, the traders believed that if they would ever have a risk problem, it would be due to one of the ETFs failing to revert to fair value for a long period of time or one of the ETFs actually malfunctioning and ceasing to trade. They saw this scenario really only plausible in a situation where VIX was trading at high levels. Therefore, they decided to be a consistent buyer of low priced VIX calls and considered that simply as a cost of insurance for the strategy. In the weeks from January 29 – February 9, 2018 their long VIX calls exploded in value while the arbitrage strategy benefited from extremely wide bid/ask spreads in the ETFs. As a result, they were able to make $13M over those 2 weeks which was greater than the profits over the life of the strategy to date. This shows the power of volatility on the PNL of your strategy if you know how to position yourself correctly.
Volume and Volatility in Equities
We don’t need the whole equities market to have expanding volume and increasing volatility as good reasons to trade stocks with this approach. We can find individual symbols with expanding volume and increasing volatility if we have a method (a system) that looks for these criteria specifically. Further, stocks have a unique advantage over commodities or FX in that stocks are more likely to have asymmetric payoffs. Whereas stocks can double in just a few months, a 25% move in a commodity or currency over a year could be a really big move. Why is this? There are several reasons.
The inputs for commodities or currencies are well known so changes in fair value for commodities and currencies tends to move slowly. Stock valuations, however, are ultimately driven by earnings. Companies with stable earnings tend to produce fairly stable stock prices. On the other hand, companies that are in the midst of explosive earnings growth tend to also experience explosive stock price growth. The market has trouble evaluating next quarter’s earnings for high growth companies let alone what earnings might look like three years from now. Attempts to identify the future fair value of the stock commonly create higher price earnings multiples.
This unknown aspect of high growth stock’s future value creates volatility via range expansion via institutional demand for the stock. This expansion in range translates into momentum which causes the stock to move explosively higher. Let’s look at some examples of the top performing trades the Reeds system identified in 2019.
Example #1 – YETI
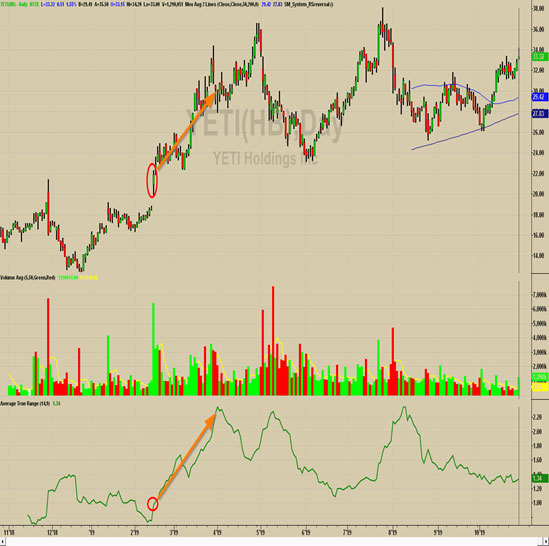
Notice the increase in ATR associated with the high volume gap. Over the next several weeks, ATR moved persistently higher. This increase in range offered a Reeds trade that generated +5.7R in just 4 weeks.
Example #2 — CODA
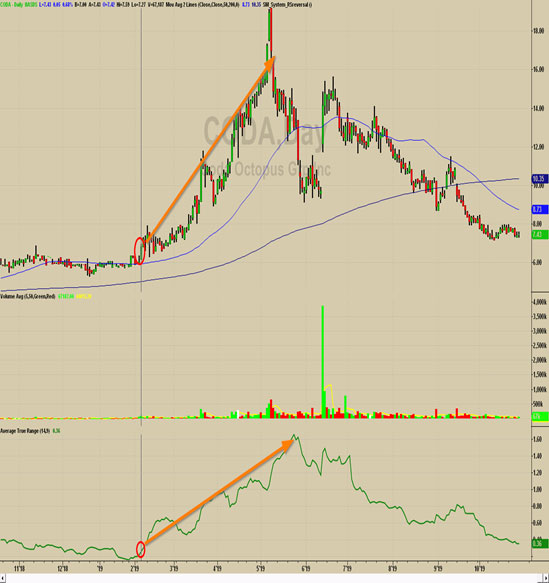
Another increase in volatility associated with a high volume, large range gap up. Again, ranges persistently expanded over the next 3 months and enabled a Reeds trade with over +7R in just one three-week period.
Example #3 – ENPH
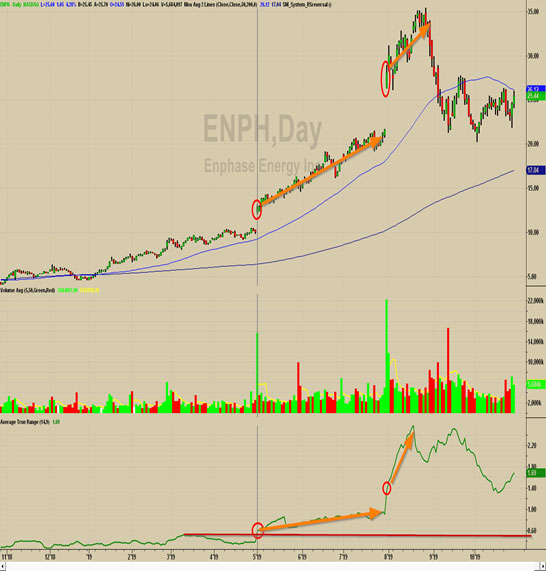
Lastly, we see again a high volume gap up which kicked off a period of range expansion this time in ENPH. In this example, we actually see a high volume gap happen twice. In both cases, ranges expand to a new level and never revert back to prior levels. The Reeds trade caught the range expansion and also caught a 50% gain in 2 weeks!
So, Which MA . . . Or Which Market?
The next time you find yourself debating whether you should use an EMA or a SMA or you are having some similar technical debate, stop and ask yourself a simple question instead — “Which market would be making me the most money right now if I had a position on?” Then follow that with a second question “If I don’t have a position in that market, why not?” These 2 questions are great to cue you to look for the best markets and then force yourself to answer why you don’t have a position on.
The moral of this article is to show you the importance of Market Selection. Learn to identify markets that have volatile ranges or are candidates to have significant volatility expansion. Finding these opportunities will have a much higher impact on your overall profitability than the specific entry and exit rules you use. Time spent identifying the best trading markets is a “Big R” winning trade.