
 The grounds of a Long Island private golf and tennis club I was visiting several years back were quite posh. I went there to meet with one of my hedge fund partners and a quantitative analyst. This quant did deep dives into market data to find actionable patterns. Our hedge fund had been following his work for a while and had grown interested enough to see if he could do some contract work for the fund — or maybe even join the team if the fit was right.
In the conversation, the quant whipped out his programming notes which surprised and amused me at the same time. You might understand my reaction because it was only six years ago and he was still using the Fortran language — a throwback to the 1980s. Fortran was the first programming language I had used (on punch cards back in the day!) as a freshman engineering student so this quant was really rockin’ it old school… The results of his aged programming language and huge statistics database, however, were pretty cool and quite useful.
He didn’t end up working for the fund though we have contracted analysis from him for the years since. I still check in on his work from time-to-time and was unsurprised to see some insightful data that he churned out about current market conditions. In fact, he’s identified a pattern that’s so rare that it’s only happened 33 times since 1950.
The pattern that our friendly neighborhood quant found recently is a monthly price pattern in the S&P 500 which you can see on this chart:
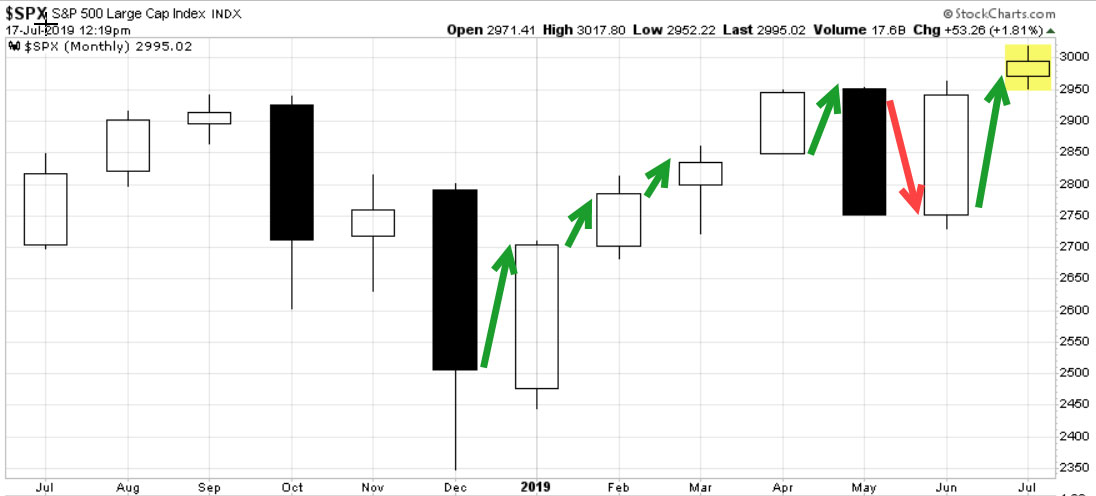
We see four consecutive up months followed by a down month. That fifth month (May, down) was to be expected – after a strong four straight up months. After such a move, it’s normal to get some profit taking and an accompanying pullback month. What is not so usual is for the sixth month of this pattern (June) to be another up month. As I said before, that’s happened only 33 times in the last 70 years.
The thought process here is that when the first down month after a string of winning months doesn’t lead to additional downside, then the uptrend has a firm foundation to continue.
My quant friend provides this data:
- In the prior 33 occurrences, the market was down six months later only 6 times giving an 82% rate of positive follow through.
- More impressively, the average gain was +8.7% six months later vs. an average loss of only -2% when the pattern didn’t work out.
- Most impressively, when the pattern didn’t work out, the average loss six months later was smaller than 2% in five out six occurrences, while gains of 2% or more happened a whopping 25 out of 27 times.
- This means that this pattern has led to outsized moves (more than 2% either direction) by an amazing margin of 25 to 1.
This does not mean you should go out and bet the farm on a rising market for the next six months. It does give us some additional quantitative support for a continued bullish price expectation in the broader market.
And so, until further notice, pullbacks are still to be bought.
Great Trading and God bless you,
D. R.