
 There are numerous ETFs that track everything from countries, commodities, currencies and stock market indices to individual market sectors. ETFs provide a wonderfully easy way to discover what’s happening in the world markets. I apply a version of my System Quality Number® (SQN®) score to measure the relative performance of numerous markets in a world model.
The Market SQN score uses the daily percent change for input over a 100-day period. Typically, a Market SQN score over 1.47 is strongly bullish and a score below -0.7 is very weak. The following color codes help communicate the strengths and weaknesses of the ETFs in this report:
- Dark Green: ETFs with very strong Market SQN scores > 1.47
- Light Green: ETFs with strong Market SQN scores (0.70 to 1.47).
- Yellow: ETFs with slightly positive Market SQN scores (0 to 0.70). These are Neutral/Sideways
- Brown: ETFs with slightly negative Market SQN scores (0 to -0.7).
- Red: Very weak ETFs that earn negative Market SQN scores (< -0.7).
This is basically the same rating scale that we use for the Market SQN Score in the Market Update. The world market model spreadsheet report below contains a cross section of currently available ETFs; excluding inverse funds and leveraged funds. In short, it covers equity markets around the globe, major asset classes, equity market segments, industrial sectors, and major currencies.
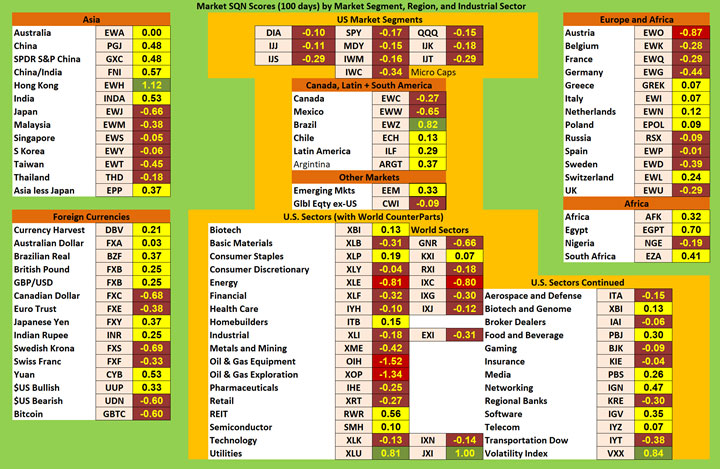
World Market Summary — Equities & Currencies
Each month we look at the equities markets across the globe by segment, region, and sector.
While overall, markets continue to look weak, there are fewer red symbols this month and many more yellow ones.
The US Dollar remains in a trading range where it has been since the 2nd quarter of last year. That range is still at strong level compared to where the USD has been in the last 10-15 years but the long term advance has turned sideways for the time being — and its Market SQN score reflects that.
Most US equity segments were brown last month with a few red ones while this month they are uniformly brown. Every US Market Sector last month looked weak (except volatility) but this month, a number of yellow sectors have appeared and Utilities even turned green.
Elsewhere in the Americas, you see improvement as well with Brazil being one of only two green countries this month. Europe and Africa look much better as well with nearly half of the markets in those region’s countries turning yellow in February.
Asia looks less weak and Hong Kong is the only other green country besides Brazil in the model this month.
Currencies at the end of February are uniformly weak – either slightly positive or slightly negative. Last month, the Brazilian Real was the only green currency but it has turned yellow now. For many months, the USD had been green and Bitcoin had been red but now the Dollar is yellow and Bitcoin has improved to brown — negative but weakly so.
Commodities, Real Estate, Debt, and the Top and Bottom Lists
Commodities were mixed with a varied range of Market SQN scores. Gold is the strongest single commodity and green while Oil and timber are very weak and red. Interestingly, blended commodities (DBC) is weaker than any of the single commodity ETFs listed so it must have components which are weaker than the model’s abbreviated list. Every other commodity ETF is either yellow or brown — again mildly positive or negative.
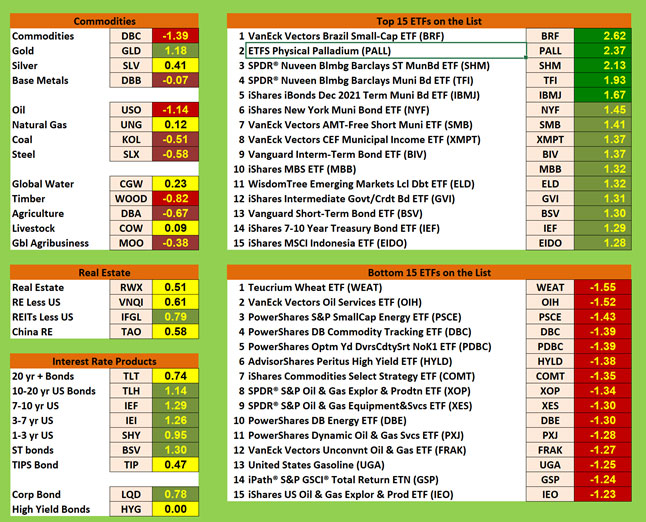
All of the symbols in real estate and debt categories are positive – with more real estate representatives yellow and more debt ETFs green. None of the symbols in these two categories, however, are dark green.
Even though the Market SQN score for the Palladium ETF improved over last month, PALL fell from the number one spot at the end of January to the number two spot on the strongest list being beaten out by the Brazil small cap issue. As a category, muni bonds took a number of spots on the list. Muni bond ETFs have been doing well since the bear volatile period in equities last quarter. Price gains for muni symbols are not dramatic by most stock trading standards, however, their smooth and steep rise gives them strong Market SQN scores.
The bottom list looks less weak overall than last month. Commodities and oil or oil related issues dominate the bottom list.
Summary
Let’s look at the summary table which measures the percentage of ETFs in each of the strength categories. You can see the distribution of the database by Market SQN score in bullish, neutral and bearish categories below —
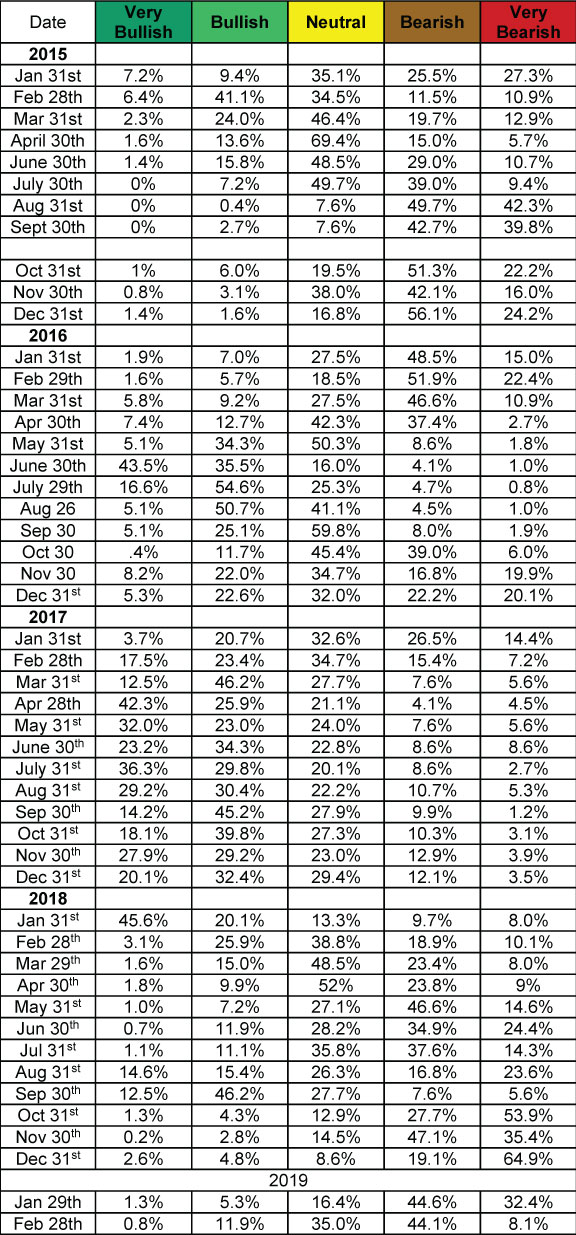
If you look at the Very Bearish column to the far right for the last few months, you can see the shift for so much of the database out of that category into the Neutral category now. Indeed, at the end of October and December, more than half of the database symbols were in Very Bearish. Now slightly more than half of them are in Bearish and Very Bearish combined. The market appears to be healing from the December lows.
Will the healing trend continue? The market will let us know soon enough.
Van will be back from India and will write the next report at the beginning of April.
Be careful to base your actions upon what IS happening, not what you think might happen. The markets always offer opportunities, but to capture those opportunities, you MUST know what you are doing. If you want to trade these markets, you need to approach them as a trader, not a long-term investor. We’d like to help you learn how to trade professionally because trying to navigate the markets without an education is hazardous to your wealth. All the beliefs given in this update are my own. Though I find them useful, you may not. You can only trade your own beliefs about the markets.