
 I always say that people do not trade the markets; they trade their beliefs about the markets. In that same way, I’d like to point out that these updates reflect my beliefs. I find the market update information useful for my trading, so I do the work each month and am happy to share that information with my readers. If your beliefs are not similar to mine, however, then this information may not be useful to you. Thus, if you are inclined to go through some sort of intellectual exercise to prove one of my beliefs wrong, simply remember that everyone can usually find lots of evidence to support their beliefs and refute others. Simply know that I admit that these are my beliefs and that your beliefs might be different. —V.K.T.
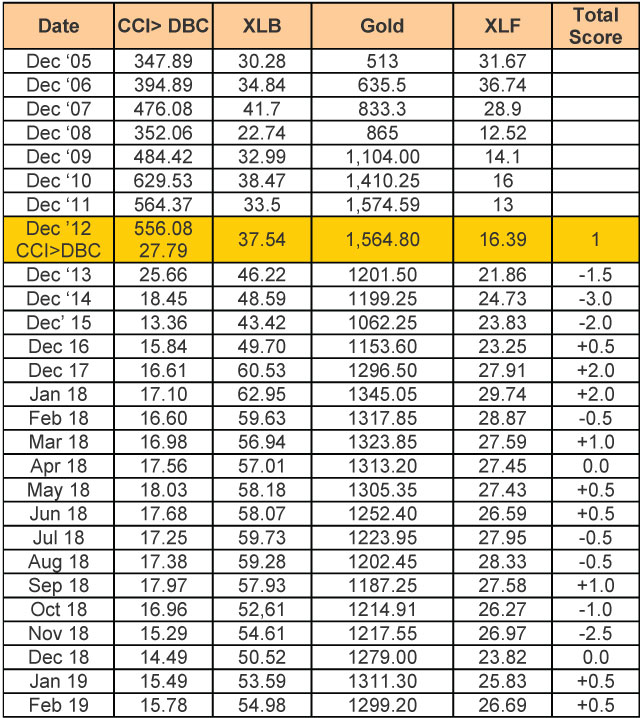
These monthly updates are in the first issue of Tharp’s Thoughts each month which allows us to get the closing data from the previous month. These updates cover 1) the market type (first mentioned in the April 30, 2008 edition of Tharp’s Thoughts), 2) the debt statistics for the US, 3) the five-week status on each of the major US stock market indices, 4) our four-star inflation-deflation model, and 5) tracking the US dollar. I also write a report on the strongest and weakest areas of the overall market as a separate SQN™ Report. Significant market changes may mean the SQN Report comes out more than once a month.
Part I: The Big Picture
Since the December 24 low close, the equity indexes have been on a steady rise. Not enough to be positive using the Market SQN measurement but close. The S&P rose 19% off of the Christmas Eve close at 2,351 in just over two months closing at 2,803 on Friday, March 1. That huge move up has pushed the market type into a Strong Bear Volatile at the end of December to Bear Quiet.
US Debt Clock
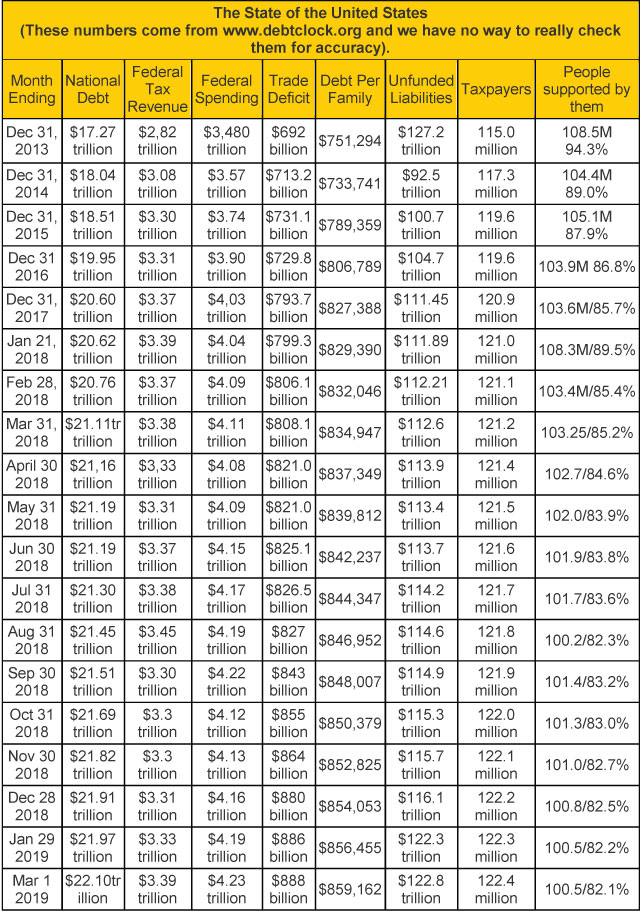
The website usdebtclock.com keeps ticking away while the national debt recently surpassed twenty-two trillion dollars. Is anyone shocked? Surprised? Is anyone even paying attention?
Van includes this section in the newsletter because he believes the debt situation has major effects on the economy and the markets — and it is unsustainable. In addition to the recognized debt, we have major unfunded liabilities for Social Security and federally provided medical care. Lack of adequate funding for pensions has started appearing in the news at the state and city levels recently. How will the politicians, voters, and taxpayers resolve these huge debt situations? Van is prescient in his warnings as governments and markets will have to deal with this historic level of debt at some point and the reckoning may not be orderly.
Part II: The Current Stock Market Type Is Bear Quiet
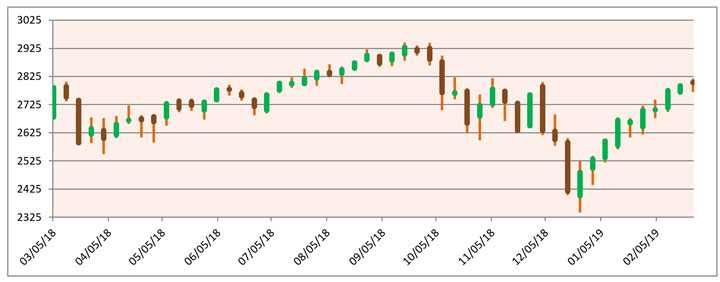
This month, let’s take a look first at the weekly bar chart for the S&P 500. The late September top, the volatile move down from October through December, and the rapid climb from the Christmas Eve low are clearly evident –
Van defines the market type direction based on the Market SQN score for a 100-day period. For the end of February, that period began at the beginning of October – or 20 bars back on the chart. He also monitors timeframes from 5 weekly bars to 40 weekly bars. By checking the bars on the chart, you can understand fairly easily the calculated Market SQN directions for each of the following periods —
- 200 days — Neutral in January, Neutral now (40 bars, began in mid-May)
- 100 days — Bear last month, still Bear (20 bars, began in early October)
- 50 days — Bear last month, now Bull (10 bars, began in mid-December)
- 25 days — Bull last month, now Strong Bull (5 bars, began in late January)
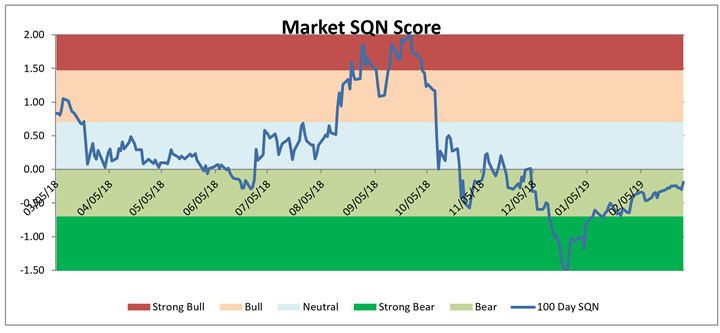
The chart below shows what happened to the 100 day Market SQN score for the past year. As you can see, it started climbing out of Strong Bear territory in late December but has not yet made it out of the Bear zone.
The last chart shows the volatility measurement for the last twelve months —
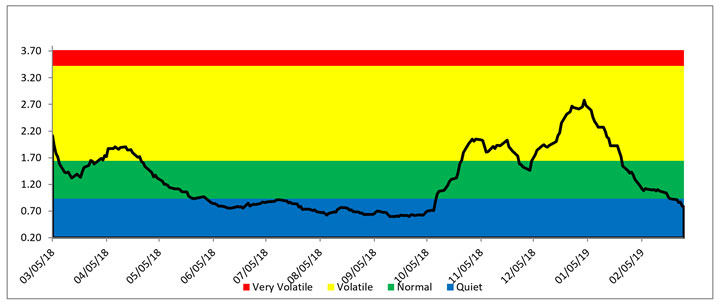
Volatility crossed into the quiet range on February 22 after having steadily declined since early January. Given what happened from October through December, how can the market be back down into the quiet range now? While it may have “felt like” we were in the throws of great volatility in the fourth quarter, the volatility level never reached higher than the mid-range of Volatile on an historic basis. Actually, the reverse of great volatility is more accurate. For the last few years, we have been experiencing historically low volatility. After such a long period of very low volatility, “normal” Volatile conditions emerged but they probably felt “very volatile.”
Lastly here are the weekly changes for the three major stock indices for 2019.
On March 1, the gains in all three indexes could be decent year-end results based on historical averages — but we still have ten months to go – further up, back down, sideways, or some combination of those.
Part III: Our Four-Star Inflation-Deflation Model
The four components of the model were mixed again for the two timeframe measures in February:
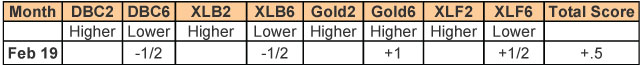
The inflation/deflation model showed a mildly inflationary score for February — though half of the model’s components showed mildly stronger deflationary forces. So is two months of positive scores the start of an inflationary trend? That’s hard to say — if not impossible. The model is not pointing in one direction or the other for now and summing up the scores from the last year reveals a neutral result as well.
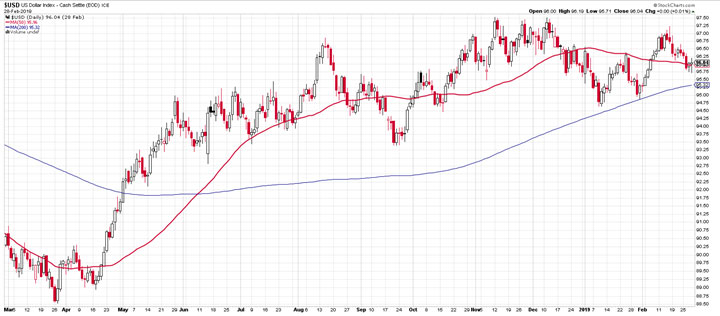
Part IV: Tracking the Dollar
USD remains in about a nine-month trading range though each of the significant lows have been higher. The current range is high in relation to where USD has been in many years.
Conclusion
From an historical perspective, Van’s market type research revealed that Bear Quiet market types happen infrequently and they tend to be short lived. Does that mean dramatic action soon in the market? Not necessarily but it does indicate that most likely, the current market type won’t last long.
What’s next? Market type methodology does not predict though it does offer hints. Market types tend to change in one degree increments by either the direction or by the volatility level. That suggests the next market type could either continue in a bearish direction and go to normal volatility or it could continue to be in quiet volatility mode and change to a sideways direction. Just by looking at the S&P chart, it would not be unusual to consider that the market backtracks here some or consolidates.
Thinking about the next market type is more of an exercise in scenario planning rather than thinking about trades. You would not put on any trades with the idea that a particular market type change is about to happen. Instead, simply consider which of your systems would be tradeable in the market types which are more likely to develop out of the current market type. Are you ready?
Van will return in a few weeks and he will write March’s Market Update at the beginning of April.
Just for fun, I checked out if the Tharp Effect has been in force since Van left. For those of you unfamiliar with Van’s concept, he has a belief that whenever he travels to another country, that country’s currency becomes stronger while he’s traveling. That experience has been so consistent that he’s titled his theory the “Tharp Effect” on currencies. So yes, the Tharp Effect does seem to be in force as the Indian Rupee has gained about a percent in value since Van left. There are still a few weeks to go, however, for the effect to further influence the exchange rate.
Until Van returns next month, trade well.