
February 15th Update on Cryptoassets
by RJ Hixson
This month’s cryptoasset update will be abbreviated for two primary reasons: Van is travelling and we are in the middle of two back to back workshops in the office here.
Market Summary
Cryptoassets are clearly still in a bear market. That’s easy to see just looking at a long term chart of Bloomberg’s Galaxy Crypto Index –
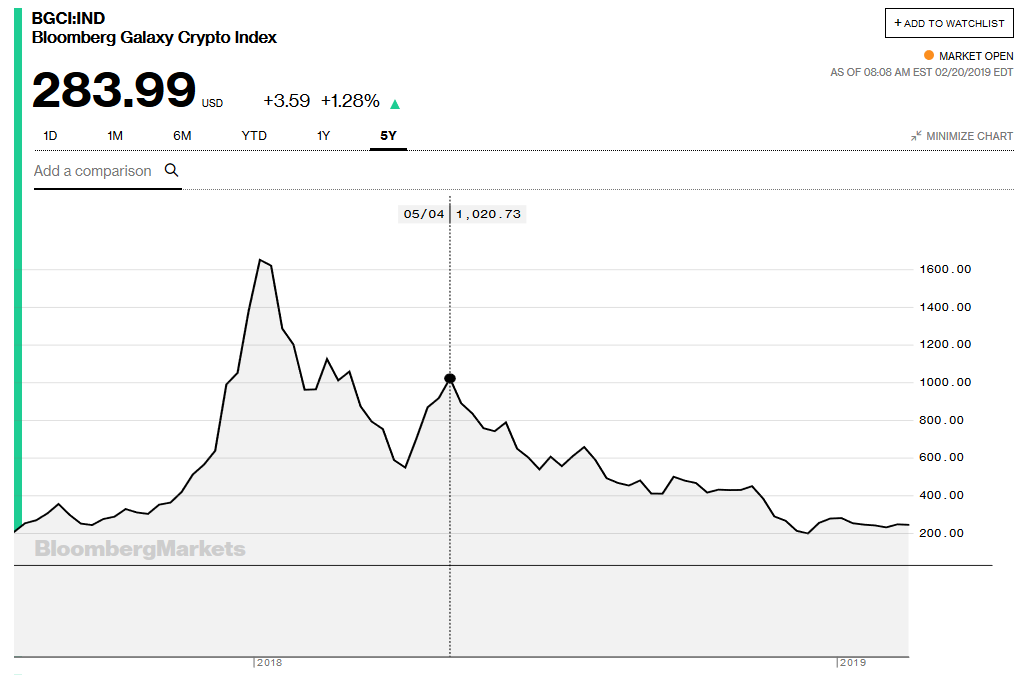
Bloomberg’s Index tracks ten major cryptoassets and Bloomberg started the index in May, 2018 at 1000 – at about the dotted vertical line on the chart. They must have added historical prices from before that to create the chart.
The table below tracks the price of five major cryptoassets across three generations of the technology –
- Bitcoin, a 1st generation crypto asset,
- ETH and NEO, 2nd generation cryptos, and
- Iota + Skycoin, 3rd generation cryptos
Just because BTC is a 1st generation crypto does not mean it is likely to die off and be survived by the later generation cryptos. It’s hard (impossible?) to predict which cryptoasset will thrive or even survive as we move forward as there are so many variables in play. Technology, use case, adoption, support, and multiple other factors come into play. For now, Van monitors these five because they represent aspects of cryptos that seem relevant today (public ledger – BTC, smart contracts – ETH+NEO, scalable contracts at minimal cost – IOTA+SKY.
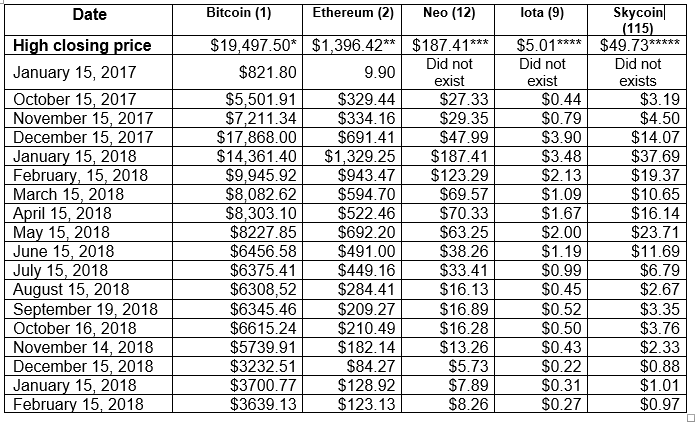
Date of the All-Time High Closes
*Dec 16, 2017 ** Jan 13, 2018 ***Jan 15, 2018 **** Dec 8, 2017 ***** Dec 29, 2017
All five of these cryptos are down from mid-January but they are also up from mid-December. Does that mean we have seen the bottom? A bullish bias might have you thinking that but a one month mild bounce doesn’t mean much – or even anything yet. Van would like to see 100 days of a solid uptrend in these currencies and in the crypto indices before he’d be willing to make much of a renewed commitment to cryptoassets. Cryptos could go back down or go sideways near these lows for a long time – they have followed that kind of behavior in years prior. The market will provide more information in the coming months. For now, cryptos remain in their bear market type.
The market cap table below shows a similar market based pattern to the individual cryptos in the table above. The total market cap for cryptos is higher than January but lower than December.
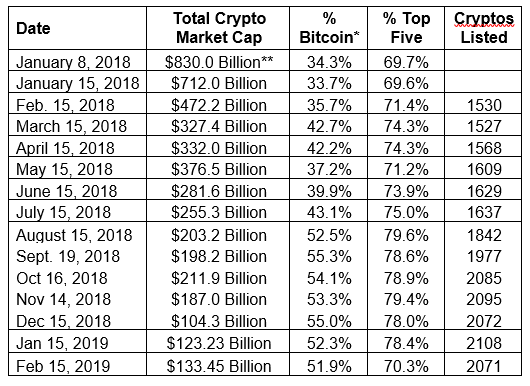
* Bitcoin was as high as 90% of the market cap of all cryptos at the beginning of 2017 to as low as 32% at the top of the market. Part of the difference is that there are now nearly 2000 cryptocurrencies. So the number keeps going up even though the market cap goes down.
** This was the peak of the crypto market in terms of market cap. Data via Tama Churchouse, Asia West Investor email on 4/11/18
The data in both of these tables comes from www.coinmarketcap.com.
Model Results
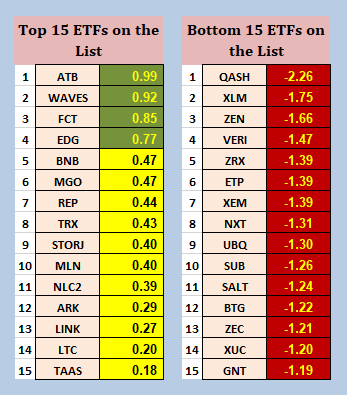
We have two models which help us evaluate cryptos using Van’s Market SQN methodology. Here are the top 15 by the Market SQN score (for 100 days) from the first model –
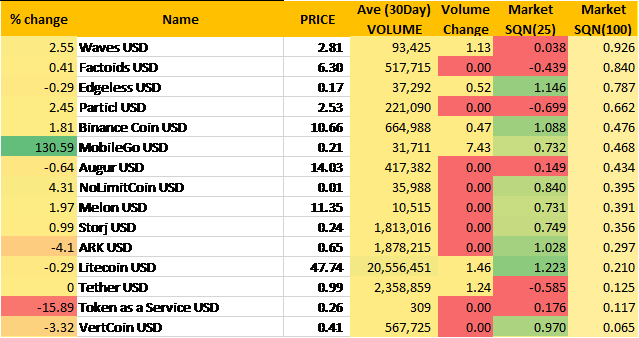
Not a single crypto scored above 1.0, however, it’s probably a healthier sign for the market that all top fifteen cryptos have positive Market SQN scores this month (yellow).
Van’s separate crypto market model has a different top fifteen list with some overlap from the table above. Like the above results, the top fifteen are all positive this month. The worst performing cryptos in the model are on right.
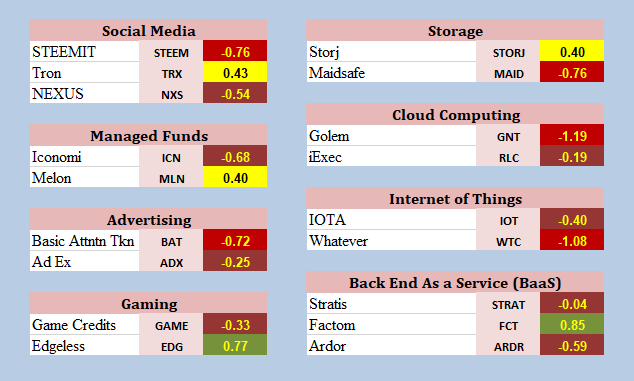
The crypto model map still looks quite bearish as the Market SQN scores are evaluating the price action of the cryptos in a period that starts in late September. The market is down from that point –
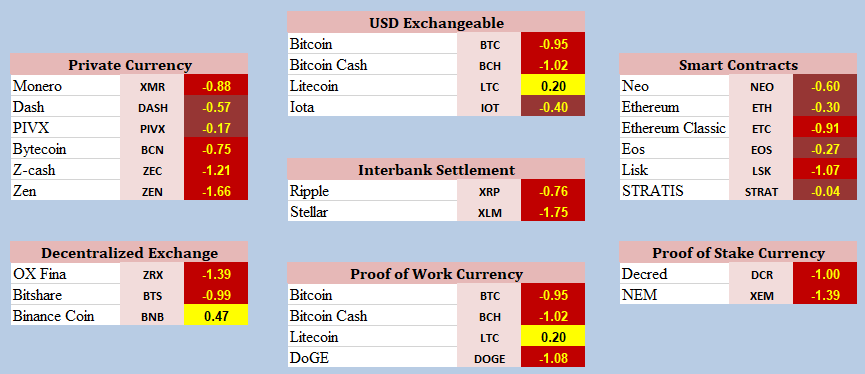
In looking at various categories, you see either negative colors (brown and red) or a mix of negative and positive. No category stands out as overly strong – or overly weak.
In the coming month, we are looking to add a number of crypto symbols to the model. Next month, we will show you the fruits of that work.
An About Face at JP Morgan?
Did JP Morgan just reverse its position on cryptoassets? For a long time, Jamey Dimon has been publicly disparaging Bitcoin and cryptoassets. On Valentine’s Day last week, however, the largest US bank announced it had developed its own cryptoasset called JPM coin and that the bank has already been using it in trials. Like other stable coins, JPM coin’s value is tied to the USD and JPM intends that its larger commercial customers use its coin to transfer large sums – for the time being. Morgan will likely expand the usage of the coin beyond that function in the future. While JPM coin benefits from blockchain technology, it will not have a public ledger – only permissioned entities such as the bank and JPM coin participants will have access to the information. JPM’s coin offers the bank a much more efficient (think faster, cheaper) way to transfer large amounts among its clients than the current transfer system offers.
A smaller bank in New York state, however, has already been using its own crypto for the same basic purposes for many months. We are likely to hear of other banks, companies, and even industries announcing their own crypto initiatives. These are part of the evolving ‘cryptocosm” – a term George Gilder coins in his book Life After Google (an excellent read on many fronts). Gilder sees a ubiquitous application of blockchain technology in the coming years as an evolution of the dominant information technology models with their security challenges. Van refers to the emerging broad based adoption of blockchain technology as an institutional revolution, not a technical revolution. Like the Internet, it’s likely to affect everybody in many ways – many of which we cannot envision right now.
In the meantime, many crypto investors will continue waiting for the cryptoasset market to work its way through the current bear market conditions.
The purpose of this report is to just give you a status quo of the cryptoasset markets. It’s not meant to give recommendations or be predictive in any way.