
Cryptoasset Update: What Happened to the Top 100 in Market Cap on Dec 31st 2016 During 2017
by Van K. Tharp, Ph.D.
Last month I reviewed the disastrous performance of the top 100 cryptocurrencies from Dec 31, 2017 through December 31, 2018. Had you invested equally in each of the top 100 cryptos, you would have been down by about 85%. This month we’ll do a similar study for one of the best years ever – 2017.
Generally, 2018 was a disaster for the crypto market. The market cap of the top 100 cryptos dropped from around $555 billion (still under the market cap of AAPL stock) to about $124 billion – pretty much the value of a large cap stock. Knowing it was a disaster I decided to look at what would have happened if you had put $100 into each of the top 100 in market cap the end of 2017. Did anything go up? What was the likelihood of a top 100 in market cap totally disappearing? How many coins stayed in the top 100?
You can get historical data from Coinmarket cap, so the first step was to download the Dec 31st 2016 data. The next step was to assume that you bought $100 worth of each coin for a total investment of $10,000. Once again we didn’t exclude anything, but I probably would have excluded stable coins since the value should stay the same and obvious ponzi schemes and scams which could have been done just by doing a little research on each coin. However, I didn’t do that. It was simply buy $100 worth of each coin.
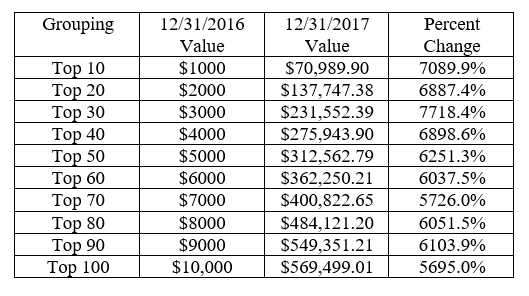
The table below shows the primary results. Your $10,000 would be worth $569,499.01 for a gain of nearly 57 times your money or 5700%. Contrast that with last year’s drop of 85.28%. and there is no comparison. That is if you were up that much and then suffered an 85.28% drawdown, you would still have $86,962.50. That’s how spectacular 2017 was.
The next table shows the return you would have invested if you had just invested in the top 10, top 20, top 30 and so on. The returns are amazing.
In 2017, six coins that started in the top 100 disappears and were worth zero. Another four coins were under $100 in value meaning that you lost money on 10% of your initial coins.
59 out of the top 100 coins fell out of the top 100, and 38 were out of the top 200. Thus, while a substantial number of coins fell significantly in terms of market cap, most of them still made a significant amount of money. In fact, among those coins that dropped out of the top 100 in market cap, four of them increase from $100 to over $10,000.
By December 31, 2018, 14 of the 100 coins had increased in value from $100 to over $10,000. 28 of the top 100 had increased in value from $100 to over $5000. The following table gives the top12 coins, all of which increase by at least 15,000%
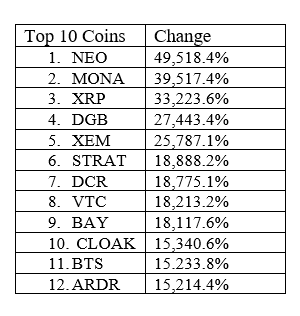
Now some of those decreased dramatically in 2018 but they are all still around. BAY for example went from 0.16 to 0.007995 – that’s a decrease of 95%. Even the top coin, NEO, decrease by 89.2%. Cloak, which I had never heard of prior to this study, decreased by 95.15%. I think the moral of this story is if you have a gain of 10,000% or more, then take about 90% of your profits off the board. You still are up 10 fold.
Next month, around March 15th, I’ll talk about what would have happened if you had invested a $100 in the top 25 coins at the end of 2014, held on to your investment and also invested $100 in each of the top 15 coins each subsequent December 31st that you didn’t already own. Just as a preview, you would have invested less than $3900 in total and that investment would have been worth $51,112 on December 31st 2018 – despite the 85% drawdown in 2018. And it’s interesting what the two coins are that you would have invested in on December 31st last year. But I don’t want to cover everything in that article right now.
We’ll also adopt a rule where you sell 90% when you are up 100 fold or 10,000%.
Until next month this is Van Tharp.