Two months ago, I reviewed the disastrous performance of the top 100 cryptocurrencies from Dec 31, 2017 through December 31, 2018. Had you invested equally in each of the top 100 cryptos, you would have been down by about 85% one year later. No crypto coin price increased in our study of 2018.
Last month I did a similar study for 2017, and showed that your $10,000 investment would have gone to $569,499.01. There were 12 coins that were up somewhere over 15,000% and one of them at nearly 50,000%. But six of the coins disappeared and another four lost money.
This month we’ll do a different study. The market was very unstable before 2015 so we will make the following assumptions:
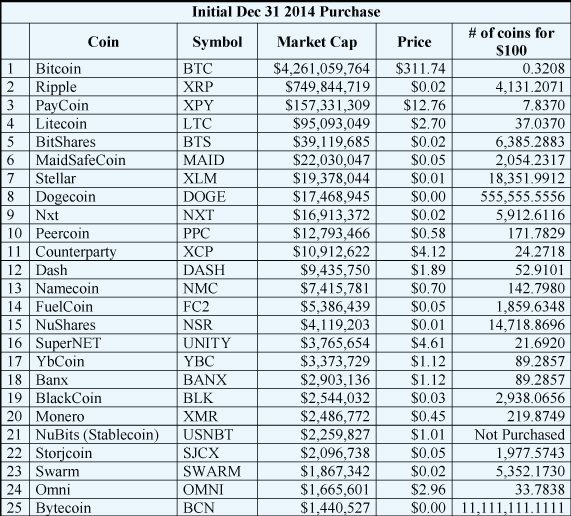
- On December 31st, 2014 we will invest $100 in each of the top 25 crypto currencies by market cap. We will invest in potential Ponzi schemes because I have no idea how easy it would have been to spot them ahead of time.
- On December 31st in 2015, 2016, and 2017, we will add $100 into any new crypto asset that shows up in the top 15 that we don’t already own.
- We will not sell anything. We are looking at just a buy and hold strategy.
The first table show the coins purchased on Dec 31st 2014. We only purchase 24 coins because one of them was a stablecoin – that is it’s value is tied to the US Dollar so it is designed to be stable and not appreciate. Our initial investment is $2,400.
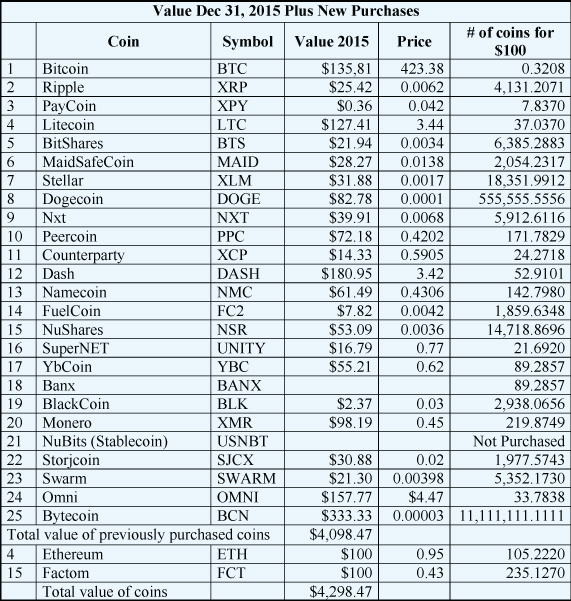
The next table shows the value of the coins on December 31, 2015 plus three new coins purchased at the end of 2015.
The next table shows the value of the coins on December 31st, 2016.
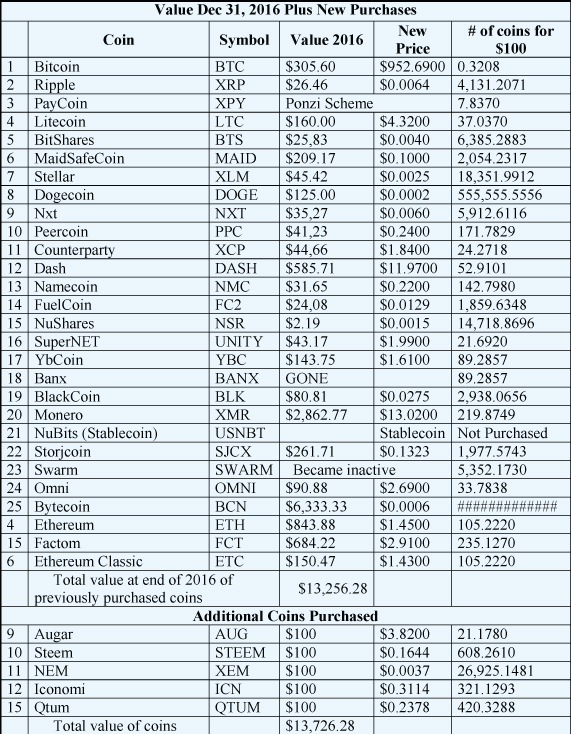
Eleven of our 25 coins are now up. But BCN and XMR have huge gains. We’ve lost a second coin which turned out to be a Ponzi scheme, XYP.
We’ve added one new coin through a spinoff of ETH, Ethereum Classic of ETC. We have the same number of coins as we had with ETH or 105.222 and that went up in value about 50%.
We are also buying five new coins AUG (#9 in market cap), STEEM (#10 in market cap), XEM (#11 in market cap), ICN (#12 in market cap) and WAVES (#15 in market cap). This we have lost one coin and gained six so we now own 30 coins. Our investment is now $3100 and our total value with the new coins is $13,726.28
The next table shows our coin purchases at the end of 2017.
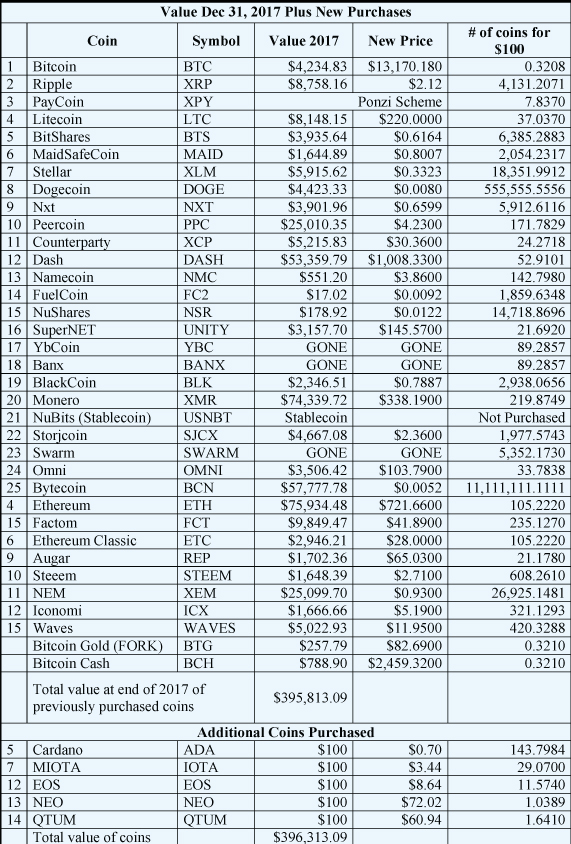
The table above shows the value of the portfolio of 30 coins on Dec 31, 2017. We also added five new coins that are in the top 15 in market cap. These include ADA (#5), IOTA (#7), EOS (#12), NEO (#13), and QTUM (#14). Many of them already have huge gains in 2017, but our rule is to add those in the top 15 at the end of the year. With our losses, our Forks (added for free) and our new gains, we now have 36 coins with a total investment of $3600. Notice that while I haven’t included all the forks (some are very insignificant), we have added as many coins as we have lost.
At the end of the 3rd year, our $3,100 is now worth $395,813.09 for a gain of 12,784%. Four of our 33 coins are now gone, including SWARM that was lost in 2017. Fuelcoin is about to disappear as our $100 is now worth just over $17. But we have 26 coins that are up over 10-fold to $1,000 or more.
You have six outstanding coins in which your investment has moved significantly. From $100 to
$25,013 (PPC),
$25,099 (XEM),
$53,359 (DASH),
$57,777 (BCN),
$73,399 (XMR), and
$75,934 (ETH).
ETH also has a fork ETC which you got for free which adds another $2,946 to its value. Perhaps there should be an exit rule for these (but we don’t have any) and one of these coins disappear in 2018.
At the end of 2017, the market was already going down. BTC peaked on December 17th at $20,089 (from which it was down 35%). DASH peaked at $1,642 on December 20th (by Dec. 31st it is down 40%) and XLM had a peak price of $476.40 on December 17 (down 24% by Dec. 31). ETH didn’t reach its peak price of $1,432.88 until Jan 14 (up 100%) – so not everything had peaked before year end in 2017. At its peak, ETH would have made you a profit of 1,500 times your original investment. It’s important to remember,however, that the peak prices occurred during days when the volatility was about 20% of the price so you probably could not have sold at the peak.
The next table shows what happened to our $3,600 investment at the end of 2018 when you would have had about an 81% drawdown. And remember, we didn’t sell anything when some coins were up 250 to 750 times our original investment.
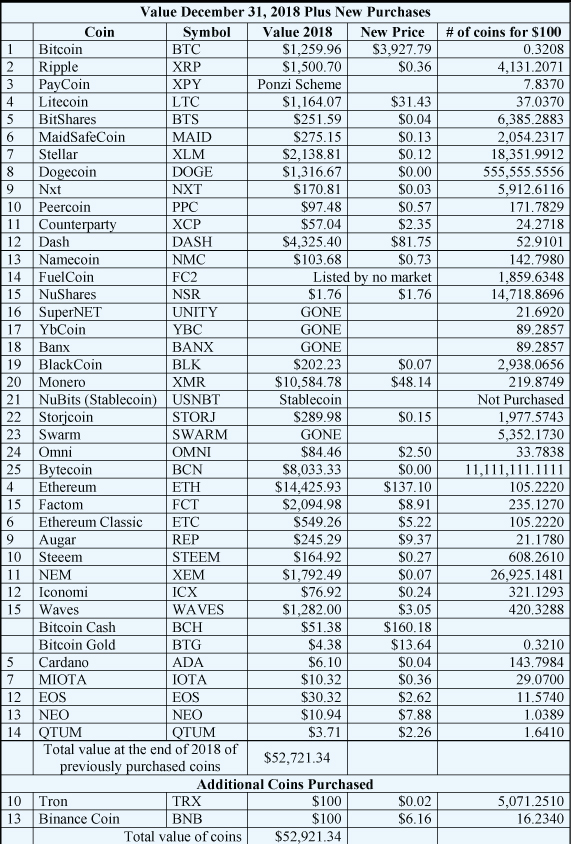
At the end of 2018, our portfolio is in a huge drawdown is now worth $52,721.34. While that’s a drawdown of 86.7%, our $3600 investment in the portfolio is still up 1,464%. There are some minor forks that I probably have not included in the portfolio at the end of 2018 — Super Bitcoin, etc. We only get 0.312 of each of the bitcoin forks so they are not worth including in minor forks.
We now have seven coins that have basically disappeared. Actually, NSR and FC2 are still listed in coinmarketcap.com but they are worthless and have no market. We are adding two new coins which have worked their way into the top 15 market caps — TRX and BNB. So now we have invested $3,800 and we own 35 coins with our two new investments.
One of our coins that was up to over $25,000 at the end of 2017 is now worth less than $100 — the curse of buy and hold. 21 coins of our 35 show a profit and 14 are breakeven or in losing situation at the end of 2018. I’m counting NSR and FC2 as being gone.
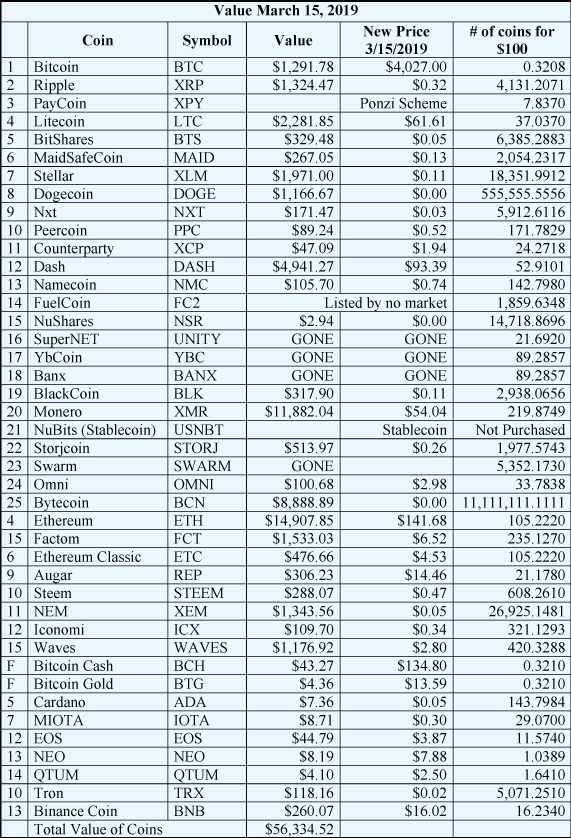
Finally, the last table shows the value of these coins on March 15th —