
I always say that people do not trade the markets; they trade their beliefs about the markets. In that same way, I’d like to point out that these updates reflect my beliefs. I find the market update information useful for my trading, so I do the work each month and am happy to share that information with my readers. If your beliefs are not similar to mine, however, then this information may not be useful to you. Thus, if you are inclined to go through some sort of intellectual exercise to prove one of my beliefs wrong, simply remember that everyone can usually find lots of evidence to support their beliefs and refute others. Simply know that I admit that these are my beliefs and that your beliefs might be different.
These monthly updates are in the first issue of Tharp’s Thoughts each month which allows us to get the closing data from the previous month. These updates cover 1) the market type (first mentioned in the April 30, 2008 edition of Tharp’s Thoughts), 2) the debt statistics for the US, 3) the five-week status on each of the major US stock market indices, 4) our four-star inflation-deflation model, and 5) tracking the US dollar. I also write a report on the strongest and weakest areas of the overall market as a separate SQN™ Report. Significant market changes may mean the SQN Report comes out more than once a month.
Part I: The Big Picture
It’s now been 28 days since we last hit an all time high in the S&P 500. The Market SQN® for the S&P 500 has been Neutral (sideways) for the last 20 days (with one day in Bear on August 23rd). A drop of 3.3% would take the Market SQN into bear territory.
Volatility has been normal for most of the last 20 days but 6 of the last 7 trading days in August were volatile. The last trading day of the month on Aug 30 was normal. Market conditions are not that good.
The Market SQN for 200 days is Neutral also but the 50 day and 25 day periods are both in Bear territory now. This is now a time to be careful.
US Debt Clock
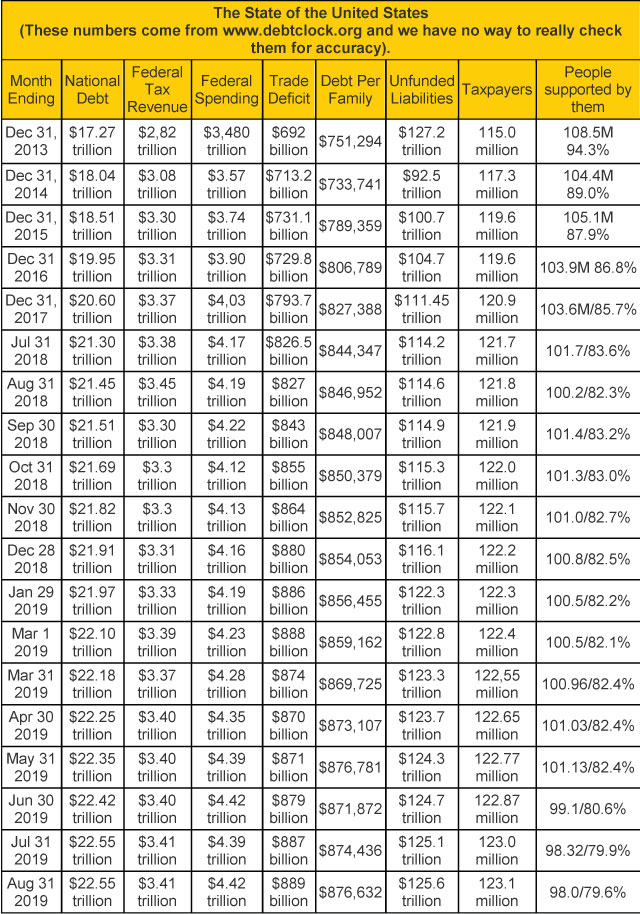
According to the debt clock, there are 169.7 million people receiving federal government benefits. For far right column in the table above, I just include retirees (53.7 million), disabled people (10.0 million), and food stamp recipients (34.3 million). That totals 98.0 million people who are supported by 123 million taxpayers. What’s interesting is that the ratio has gone down from 82.4% to 79.6% in the last few months. Is that something the Trump administration is doing or a change in the way statistics are gathered and reported? Remember there are lies, damned lies, and government statistics.
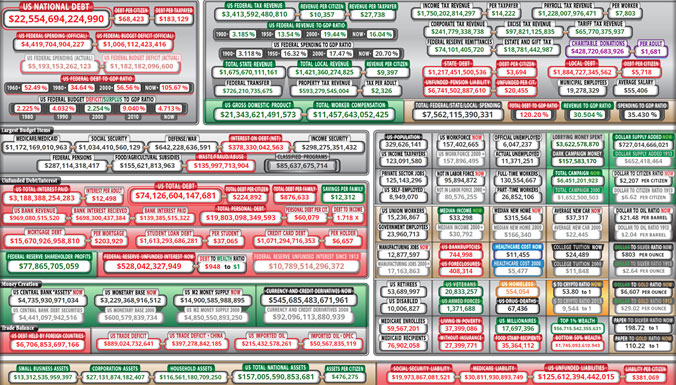
You should really look at the US Debt Clock website periodically (www.usdebtclock.com). They started showing a lot of new statistics in the last month. You can see a copy of the screener as of 2 PM on September 1, below but here are some statistics that the new format highlights.
- The site lists the Federal debt to GDP ratio. In 1960 that was 52.49% and now it is 100.67%
It now lists the largest items in the budget. Medicare is #1, Social Security is #2; War (we want to call it defense) is #3; and interest in the debt is #4. - Given the top budget items and how big money thrives on the war machine, can you see how the debt problem will inevitably be a huge issue?
- The average citizen’s share of interest on the federal debt is now $12,498. And that’s about 1/3 of the median income of $33,298.
- The Federal Reserve’s unfunded interest is now $528 billion; and the Fed has a debt to wealth ratio of 948 to 1. I don’t think this is what the world’s richest families had in mind in establishing a central bank.
- $545.7 trillion in currency and credit derivatives exist now (vs $92 trillion in 2000) and this is certainly something to watch on a monthly basis if it starts changing a lot.
- There are 17.7 US millionaires which make up 5.3% of the US population. For the world, millionaires make up about 1% of the population.
- I assume this is for the US – The top 1% owns $56 trillion, while the bottom 50% owns $1.7 trillion. That says that the top 1% owns 32.9 times as much as the bottom 50%. For the whole world, the ratio is much more extreme given that 26 people own half the world’s wealth.
- There have been 744,999 bankruptcies and 408,315 foreclosures in the last 12 months.
- The Dollar to Crypto ratio is now 54 to 1 and in 2013 it was 9,544 to 1 This is M2 divided by the total market cap of cryptoassets. We will start keeping track of this one regularly.
- Healthcare costs are now $11,455 vs $5,477 in 2000. Our healthcare system treats symptoms and not cause and I understand why – treating symptoms is much more profitable.
- 544,054 people have experienced homelessness in the last 12 months (about 1 in 600).
- There have been 67,436 drug overdose deaths in the US in the last 12 months. These deaths involve prescription drugs as well as illegal drugs.
- The total debt to GDP ratio is now 120.2%
- State debt per citizen is now $3,649; local debt per citizen is now $5,718; and unfunded pension liability is now $20,455 per citizen.
- The Dollar (M2) to gold (yearly production) ratio is now 6,607 per ounce. It was 29.02 in 1913.
Here is a screenshot of the US Debt Clock from September 1st but if you have an iPhone, you can now download it as an app.
The site has also created a world debt clock which compares the listed debt with the GDP of various countries. Countries that are in real debt trouble are easy to spot. For example, Argentina has a national debt of $418 billion vs $618 billion in GDP. Russia shows up with a debt of $295 billion and a GDP of $803 billion. The country in worst shape is Japan with a debt of $12 trillion vs a GDP of $4.6 trillion.
Those with money who are in power, make the rules, and their goal is to make sure they stay in power and don’t turn it over to new wealth.
Part II: The Current Stock Market Type Is Neutral Normal
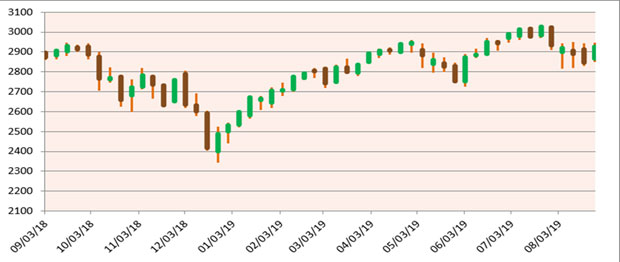
Let’s take a look at the weekly bar chart below for the S&P 500 which shows the late September, 2018 top, the volatile down moves from October through December, the rapid climb from the Christmas Eve low, May’s dip and now August’s dip. You can see that May’s drop was recovered in June and surpassed in July. You can see how the market has moved sideways since the drop in early August and remains in neutral mode.
I define the market direction based on the Market SQN using 100 days which puts the start of the period back in mid-April. I also monitor timeframes from 5 weekly bars to 40 weekly bars. Given the bars on the chart, you can probably understand the direction for each of the periods –
- 200 days – Neutral for July, Neutral again for August
- 100 days –Bull last month, now Neutral
- 50 days –Bull last month, now Bear
- 25 days – Bull last month, now Bear
So now all of our measured periods are either Neutral or Bear.
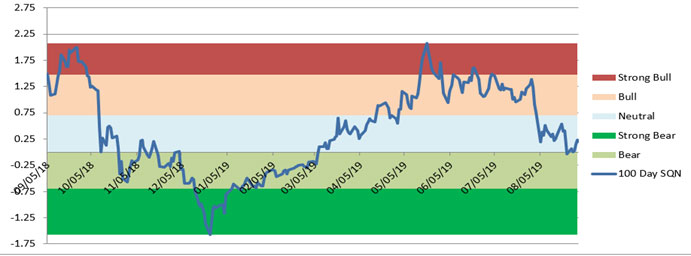
The chart below, shows the trend change from Strong Bear early in the year to Strong Bull and then the move back down to bounce off Bear and stay Neutral.
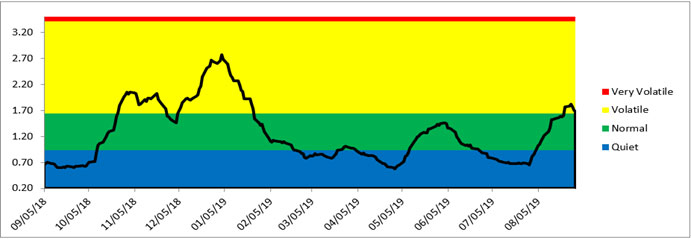
The third chart shows the volatility measurement for the last year. Volatility was Quiet for the whole month of July but in August, it was in Normal mode for most of the month and ended in the Volatile range.
Lastly here are the weekly changes for the three major stock indices for the last month. If had you been fully invested from the beginning of 2019, then you’d been up nearly double digits in the DOW, up over 13% in the S&P 500 and up almost 18% in the NASDAQ 100.
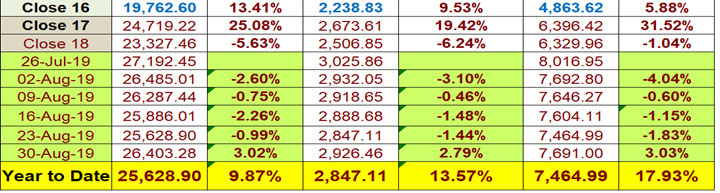
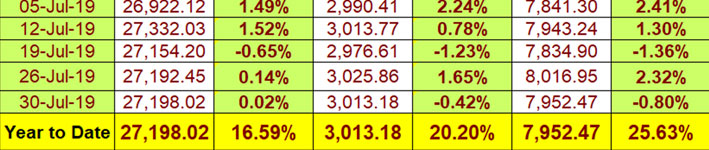
As a contrast, this is what this table looked like at the end of July. Our last highest high in the S&P 500 was on July 26th which took out the June highs. The market came back off of that high and if you have stayed fully invested through August, you have given up over 7% in all three indices last month.
Part III: Our Four-Star Inflation-Deflation Model
The four components of the model were mixed for the two timeframe measures going back from the end of August –
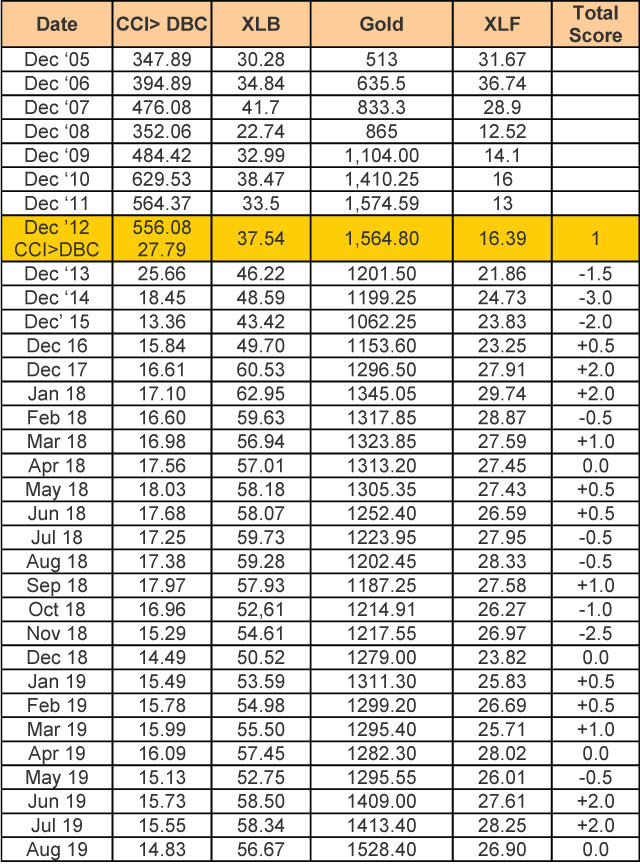
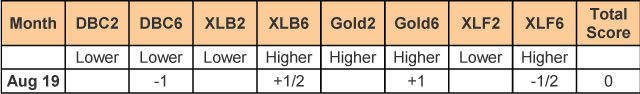 The inflation/deflation model turned to inflation in June and July with scores of +2.0 for both months. In August, however, the model’s score jumped back down to zero. Two big inflation jumps in a row and lowered interest rates from the Fed – good signs for the stock market. But we did also just have a yield curve that inverted – a predictor of a recession beginning sometime next year.
Shadowstats.com still shows the inflation rate (as it was originally conceived in 1980) as being around 10%. With that adjustment in the GDP, the original inflation rate suggests that we have been in a recession since 2000 with just one quarter of non-recession.
Part IV: Tracking the Dollar
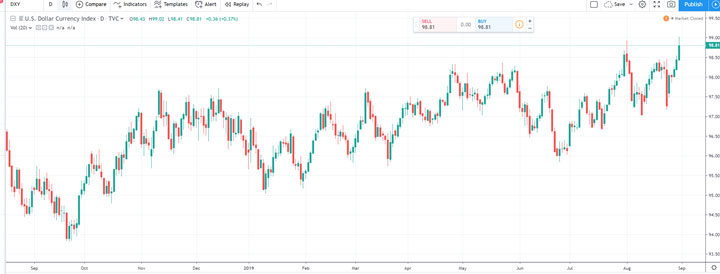
USD ended August at 98.81 after closing at 98.56 last month. USD closed slightly up on the month after going as low as 97.03 around August 10th. To put this into perspective, remember that the index started in 1973 at 100.
The Pound Sterling is at 1.22. The UK now has a prime minister, Boris Johnson, who is a little like Trump in that he absolutely wants to force his agenda – in this case, BREXIT which is supposed to go through on October 31st. This is six days after I return home from the UK so during my travel to the UK in October, I don’t expect the typical Tharp Effect for the British Pound. Instead, I expect that the British pound could fall as much as 10% between now and when I leave the UK in late October. But what do I know? Predictions mean nothing. It’s what the market is doing right now and right now, the Pound is falling.
 Conclusion
As I have said previously, trade wars are not pretty. We are in the middle of a big one which will likely continue for the foreseeable future.
In addition,
- Gold is up.
- BTC is up 200% on the year but has been in a trading range for the last few months.
- The stock market could easily go to a bear market soon.
Our purpose is not to predict but to merely reflect on what is happening right now. Be careful you are not looking only for what you expect to happen. Stay in the now! Pay attention to what is actually happening.
Until next month’s update, this is Van Tharp. Trade well and create the life you want for yourself.