ETF and Mutual Fund Techniques Taught by a Master
$700 Discount Expires Today, March 7th
Presented by Ken Long
March 16-18, 2007 * Raleigh, NC
"You may have heard of Ken because of his Tortoise system for switching between mutual funds. That system made over 100% trading real money in an IRA in 1999. And its generally made pretty good money even during the bear market or you may have heard about the many systems that he has developed with high system quality numbers.
LTC Ken Long is one of the few people I know of, who has a graduate major in systems design. Because of his training, Ken can spot ideas that most people never think of. For example, when Ken attended our systems workshop and learned about the complex training game we were playing he developed a procedure for strategizing about the game that I now teach in that workshop. He�s that good."--Van Tharp
Click Here to Learn What Ken Can Teach You...
Tharp�s Thoughts
Market Update for March 7, 2007
1-2-3 Model In Yellow Light Mode
By
Van K. Tharp
Look for these monthly updates on the first issue of each month. This allows us to get the closing month data. In these updates, we�ll be covering each of the major models mentioned in the Safe Strategies book: 1) the 1-2-3 stock market model; 2) the five week status on each of the major stock U.S. stock market indices; 3) our new four star inflation-deflation model; and we�ll be 4) tracking the dollar.
Part I: Market Commentary.
Last month I commented on the amount of conflicting information about the current market. On the one hand, I had sources that tell me people have cash that they just don�t know what to do with. At the same time, I was hearing market gurus say that the market was overvalued and due for a major correction at any time now. Well, the conflict seems to have resolved itself in terms of a worldwide correction to the downside.
On Tuesday February 27th the Dow Jones Industrials dropped nearly 550 points, closing down 416.02 or down 3.29%. It was the worst drop in the Dow since September 17, 2001, when the market resumed trading after closing after the destruction of the WorldTradeCenter in New York. Historically, it was one of the worst drops for the Dow in terms of points, but as a percentage drop it was fairly insignificant. However, it was only the 5th time in the last 100 years that the Dow has gone from trading above its 50 day moving average to dropping below the lows of the last 50 days in a single day. One day wiped out most of the bull run of the last four months. However, in my opinion it simply shows how shallow this bull run has been.
The move was started by a sudden drop of almost 9% in the Chinese market. When the Chinese make corrections, they don�t mess around with a 0.25% drop in the discount rate. Instead, they cut free reserves dramatically and they�ve done that several times. And that can have a dramatic effect on the market. And then, to show how much the markets are now global, the tidal wave hit Europe and then the U.S. market.
I had also heard the VIX index had hit historical lows just before the drop. I had actually stopped watching the VIX because it didn�t seem to have much predictive value any more. It�s a ratio of put to call selling that the CBOE keeps track of on a regular basis. It hit an all time high of around 150 after the 1987 crash. And it had very low territory for a long, long time � around 10. I actually downloaded VIX data (the old way of calculating) from 1983 to the present (over 5000 data points). I sorted them by price and then looked at the 50 lowest days, which according to theory, are the 50 days when we have the most confidence. Of the 50 lowest days since 1983, 16 of them (32%) occurred in 2007 and we are just hitting March. And 76% of the lowest days have occurred in the last three years (which was one reason I stopped looking at it). However, if you understand that we are in a SECULAR BEAR MARKET, when valuations go down, it would also make sense that people would be the most confident in the early stages of the bear. And that�s where I think we still are.
Incidentally, I just saw an article that talked about the massive bear camp because of the increase in the VIX to 20. That is not a massive bear camp. After the 1987 camp the VIX was at 150. In 2002, the VIX was around 50. When the VIX is around 50 we can start talking about massive fear, not at 20.
Part II: The 1-2-3 Stock Market Model IS IN YELLOW LIGHT MODE and that�s good for stocks.
Let�s look at what the market has done over the last five weeks and compare that with where the averages were December 31st last year. This is given in the table below. Perhaps what stands out the most is 1) the large drops in the market last week; and 2) the fact that the market is no longer up on the year.
| Date | Close | % Change | Close | %Change | Close | % Change |
| Dow 30 | S&P 500 | NASDAQ 100 | ||||
| Close 04 | 10,783.01 | 1211.12 | 1621.12 | |||
| Close 05 | 10,717.50 | -0.60% | 1248.29 | -3.10% | 1645.2 | 1.50% |
| Close 06 | 12,463.15 | 16.29% | 1,418.30 | 13.62% | 1,756.90 | 6.79% |
| 26-Jan-07 | 12,487.02 | 1,422.18 | 1,772.97 | |||
| 2-Feb-07 | 12,653.49 | 1.33% | 1,448.39 | 1.84% | 1,798.13 | 1.42% |
| 9-Feb-07 | 12,580.83 | -0.57% | 1,438.06 | -0.71% | 1,785.53 | -0.70% |
| 16-Feb-07 | 12,767.57 | 1.48% | 1,455.54 | 1.22% | 1,821.49 | 2.01% |
| 23-Feb-07 | 12,647.48 | -0.94% | 1,451.19 | -0.30% | 1,839.77 | 1.00% |
| 2-Mar-07 | 12,114.10 | -4.22% | 1,387.17 | -4.41% | 1,726.05 | -6.18% |
Last month I pointed out that the market had reached a positive efficiency of 77.3% and I was also hearing that something like 80% of all stocks were above their 200 day moving averages. That all changed in one week.
I also find it very interesting that my efficiency portfolio, which looks for long-term trends with the idea that they will probably continue, has not been able to make money under these market conditions. And I believe that says something about the type of bull market we have had.
Part III: Our Four Star Inflation-Deflation Model.
So far our models have been telling us, that inflation/deflation is pretty steady, with a slight inflationary bias and that�s where secular bear markets tend to start.
So what�s our new indicator telling us about inflation? I�ve described the inflation model I�m using in these updates for over six months now, so instead of continuing to list the criteria here each month, click here to read more if it is new to you or you don�t understand it.
Okay, so now let�s look at the results for the last six months.
|
Date |
CRB |
XLB |
Gold |
XLF |
|
December
30th |
347.89 |
30.28 |
513.00 |
31.67 |
|
August
31st |
390.95 |
32.19 |
623.50 |
33.52 |
|
September
30th |
379.10 |
31.82 |
599.25 |
34.62 |
|
October
31st |
383.92 |
33.33 |
603.75 |
35.43 |
|
November
30th |
408.79 |
35.00 |
646.70 |
35.68 |
|
December
29th |
394.89 |
34.84 |
635.70 |
36.74 |
|
January
31st |
393.89 |
36.25 |
650.50 |
37.08 |
|
February
28th |
410.64 |
37.45 |
664.20 |
35.95 |
We�ll now look at the two-month and six-month changes during the last six months to see what our readings have been.
|
Date |
CRB2 |
CRB6 |
XLB2 |
XLB6 |
Gold2 |
Gold6 |
XLF2 |
XLF6 |
Total
Score |
|
October |
Higher |
Higher |
Higher |
Higher |
Higher |
Higher |
Lower |
Higher |
|
|
|
|
+1 |
|
+1 |
|
+1 |
|
-1/2 |
+2.5 |
The results of this model are much more sensitive (I believe) than the model I presented in Safe Strategies for Financial Freedom. The model once again shows that inflation is winning.
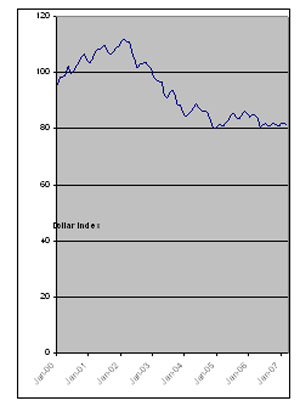
Part IV: Tracking the Dollar.
This month, instead of looking at the specific figures, I thought I�d show you a chart of the dollar index since the secular bear market began. This is given in Figure 1. The dollar started a major decline in 2002 and continued that decline until 2005. Since that time it�s been relatively flat at around 82-85.
I think last week�s market activity overall speaks for itself. Until next month�s update, this is Van Tharp.
About Van Tharp: Trading coach, and author Dr. Van K. Tharp, is widely recognized for his best-selling book Trade Your Way to Financial Fre-edom and his outstanding Peak Performance Home Study program - a highly regarded classic that is suitable for all levels of traders and investors. You can learn more about Van Tharp at www.iitm.com.
Coming in April
Back-to-Back Core Workshops
One trip to Raleigh, NC for six extraordinary days of training.
The combo discount saves you the most!
| April 21-23 Sat-Mon |
Blueprint for Trading Success | Learn More |
| April 25-27 Wed-Fri |
Peak Performance 101 | Learn More |
Overcoming Trading Errors � the Right and Wrong Way
By D.R. Barton, Jr.
What a great weekend! We just finished our first e-mini futures trading workshop. What an amazing group of people!
We had many interesting events during the weekend, with live trading on Monday being one of the most entertaining�
After closing out a good trade to end the session, we carried on with the course and then had lunch. We returned after lunch and decided to have the whole class take a look at the markets to see if there were any interesting developments since we looked earlier in the day.
And there it was�
On my execution platform, I was in a short position in the S&P e-mini futures � a position that I did not intend to be in -- and half of the profits from the morning had been gobbled away.
So I�m standing in front of a classroom full of savvy traders. And I have a decision to make: What do I do with this open trade that I have no idea how, when or why I entered it? These choices ran through my head:
A. Analyze how I got in the trade. Check to see if it was my fault or a software or platform glitch.
B. Take a look and see if the markets might retrace and give me some of my profits back. Analyze the chart technical indicators, look to see if there are key numbers or other support and resistance close by. Check the market internals to see if they confirm or diverge with current direction. Check moon phase and sunspot activity plus...
C. Or I could get the heck out and ask questions later.
And so, right there in front of the class, I chose option �C�. I executed an order to get me out at the market, with no questions asked. (Of course, the little voice in the back of my head kept saying, �Don�t you want to check what the markets are doing?� � But I bravely resisted.)
I did an autopsy of the trading morning and found out that I had failed to cancel a stop order for an earlier trade. This was a mental error that arose from trading in front of a class full of people and multitasking, but it was mental error nonetheless.
This is excellent counsel for anyone who finds themselves in a trade they�re not supposed to be in � just get out immediately and ask questions later.
If you�ve done any number of trades at all, I�m sure you�ve found yourself in a situation where you have gotten into a trade that you weren�t supposed to be in.
� You may have been long instead of short.
� You may have put on too many contracts or shares by mistake.
� You may be in the stock or futures contract.
� Or like me you may have forgotten to cancel an order.
Whatever the reason, unless the market is running furiously in your favor, just get out immediately and ask questions later. Over the long haul, your account will be healthier and your stress levels will be lower.
Of course, during your daily debriefing, you�ll want to cover the psychological and process aspects of why you made the error in the first place and put steps in place to keep it from happening again. But long before the debriefing, decisive action is required to extricate yourself from the situation.
Great Trading!
D. R.
About D. R. Barton: A passion for the systematic approach to the markets and lifelong love of teaching and learning have propelled D.R. Barton, Jr. to the top of the investment and trading arena where he is one of the most widely read and followed traders and analysts in the world.
He is a regularly featured guest analyst on both Report on Business TV, and WTOP News Radio in Washington, D. C., and has been a guest analyst on Bloomberg Radio. His articles have appeared on SmartMoney.com and Financial Advisor magazine.
It is Tax Time Again...
We often get emails and calls from our clients concerning their taxes. As all of you know, Van is not an accountant or tax guy and we can�t really answer all of your questions. The best advice that we can give you is to refer you to one company that has specifically been in the business of helping traders with their taxes for close to ten years - Traders Accounting.
As an active trader, if you are having problems understanding what forms to use and how to file them and if you are interested in finding someone who will get your taxes done correctly and keep you out of trouble with the IRS, then please take the time to visit them and see what they have to offer.
www.tradersaccounting.com/2006tax
Inspiration from a King
by Melita Hunt
I�d like to share a story with you that was sent to me by a friend named Andrew whom I used to coach some years back. He is an engineer and quite analytical by nature, which made it all the more amusing to me.
I hope you enjoy it too:
Hi Mel,
Just wanted to share a moment that I had in an airport a couple of weeks back on Martin Luther King holiday. After a 2 hour layover in Atlanta I decided to buy a book of King's speeches. I sat down and read it but it still didn't feel like King Day to me so I started drifting off when a voice suddenly popped into my head, "Stand up in the Food Court and read one of his speeches to all of these folks - Now."
It took me a while to do it because I almost wimped out; but then I remembered people out there like you and the rest of the team who are just willing to do great things on a whim, so I said �oh what the heck, go for it anyway� I hollered for everyone's attention, introduced my goal, and read a good part of his acceptance speech for the Nobel Peace Prize to maybe 50-60 folks having breakfast. Some clapped, others thought I was crazy and kept their eyes focused on their food, and the airport loud speaker was in the background �if you see any suspicious behavior�.� But I did it and the speech included the quote below:
'I really want to live in a world where folks around me do crazy-ass and meaningful things."
Love Drew
AMEN BROTHER!!!!
You can contact Melita at [email protected]
Van Tharp Will Be Speaking in Phoenix, AZ, March 14-17, 2007
Van Tharp will be a speaker on
the "Dream Team" of experts at
The 9th Annual Investment University
Presented by the Oxford Club
March 14-17, 2007
Join in the discussions on our blog and forum
Do Not Reply to this email using the reply button as the email address is not monitored, your email will not be seen. Please click this link to contact us: [email protected]
The Van Tharp Institute does not support spamming in any way, shape or form. This is a subscription based newsletter.
If you no longer wish to subscribe, Unsubscribe Here
Or, paste this address in your browser: http://www.iitm.com/privacy_policy.htm
The Van Tharp Institute
102-A Commonwealth Court, Cary, NC 27511 USA
800-385-4486 * 919-466-0043 * Fax 919-466-0408
Copyright 2006 the International Institute of Trading Mastery, Inc.