To
Trade Your Way to Financial Freedom readers
Here's a friendly reminder
20% Off Van Tharp Products Expires Today
Market Efficiency Portfolio
January 17, 2007
By
Van K. Tharp
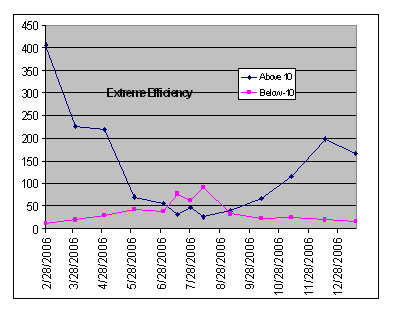
Efficiencies clearly show that the overall market can change quite quickly. In February 2006, the market was amazingly strong in terms of efficiency. We had 406 stocks with ratings above 10 and only 11 stocks with rating below -10. It was very hard to find a good short candidate. However, the market was not into new high ground as it is now. By August 2006, the market moved as low as having 26 stocks above +10 to its current value of +39. Stocks below -10 moved from only 11, to as many as 91. Today, things have reversed and there are 165 stocks above +10 and only 16 below -10.
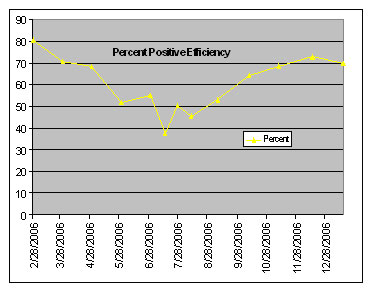
There is another way to measure the efficiency of the market. What percentage of stocks have an efficiency rating above zero? This information has been charted in the second figure. In February 2006, 80% of all stocks showed a positive efficiency. By July 15th only 37.4% were positive, but as of January 16, �07 we�d moved back to 70% efficiency. Last month none of our positive efficiency stocks really took off, but all but one of them is profitable for a change.
Our two best stocks in past, MWP and LQU, both held up last month and both are still up over 1R. In addition, all of our long positions are profitable except PBCT. What�s amazing, however, is that if we picked a new portfolio of the most efficient stocks, only MWP would be among the top. Our favorite and star past performer on the short side, JRCC, is down even more over the last month. However, ERES, our other short, shows a 0.33R loss.
| Stock | Entry | Cost | Shares | Stop | Price | Value | Profit | R-multiple |
| Longs | ||||||||
| LQU | $54.05 | $1,960.80 | 36 | $43.24 | $66.03 | $2,377.08 | $416.28 | 1.05 |
| CXW | $42.33 | $1,919.85 | 45 | $33.86 | $45.90 | $2,065.50 | $145.65 | 0.37 |
| MWP | $35.54 | $1,756.46 | 49 | $28.43 | $45.32 | $2,220.68 | $464.22 | 1.18 |
| EWP | $52.12 | $1,734.96 | 33 | $41.70 | $53.50 | $1,765.50 | $30.54 | 0.08 |
| PBCT | $44.62 | $1,755.18 | 39 | $35.70 | $44.37 | $1,730.43 | ($24.75) | -0.06 |
| NU | $26.52 | $1,765.32 | 66 | $21.22 | $27.67 | $1,826.22 | $60.90 | 0.15 |
| CHL | $42.32 | $1,750.12 | 41 | $33.86 | $43.90 | $1,799.90 | $49.78 | 0.13 |
| ALB | $71.55 | $1,732.20 | 24 | $57.24 | $73.16 | $1,753.16 | $23.64 | 0.06 |
| Shorts | ||||||||
| JRCC | $9.54 | $1,729.58 | 180 | $11.45 | $6.40 | $1,150.24 | $579.34 | 1.69 |
| ERES | $6.33 | $1,744.74 | 278 | $7.60 | $6.74 | $1,873.72 | ($128.98) | -0.33 |
| $1,616.62 | 4.31 |
Some of the top positive efficiency candidates include: MFW, CRVL, PGJ, LFL, BAB, CHU, HXM and MKL. We own MFW, so of the rest, I like BAB and LFL the best. BAB (British Airways) has gone up a long ways and I�m not sure that I understand why, so we will buy another airline LFL for our portfolio.
On the short side there are not many candidates. However, there are a few. JRCC is probably the best negative efficiency chart and we�ve already done very well with it. It�s our best profit among the closed trades and the new position shows the best profit among the open positions. Even though there are not many good looking negative efficiency stocks, there are several good candidates, including: VCI, FICC, and DOM. I like VCI the best, so we�ll substitute that one for ERES.
The percentage numbers suggest that we should have three short stocks, but the numbers above +10 and below -10 suggest that we should only have one short stock. As a result, we�ll stick with two. Thus, I�ll be eliminating positions in PBCT and ERES and adding positions in VCI and LFL.
This is the second month in a row that I�ve only had to make a few changes to the portfolio and hopefully, that is a good sign.
Our closed out loss (before selling the two small losses) totals minus $3,685.17, including commissions. All of the closed out positions to date are listed in Table 1: Closed Positions.
| Table 1: Closed Positions | ||
| On January 16th, 2007 | ||
| Stock | Profit | R-multiple |
| Loss | ||
| FAL | ($2.28) | -0.006 |
| BSX | ($183) | -0.457 |
| DLX | ($184) | -0.459 |
| AETH | ($132.00) | -0.33 |
| AYE | ($56.95) | -0.142 |
| CG | ($66.72) | -0.167 |
| OGE | ($51.06) | -0.128 |
| WPI | ($315.08) | -0.788 |
| EBAY | ($381.78) | -0.954 |
| CHS | ($399.78) | -0.999 |
| HOV | ($346.09) | -0.865 |
| VTR | ($97.51) | -0.244 |
| LEE | $64.04 | 0.16 |
| JRCC | $873.90 | 2.185 |
| GYI | ($175.82) | -0.44 |
| SYX | $137.24 | 0.343 |
| CPY | ($303.60) | -0.759 |
| OMG | ($183.18) | -0.458 |
| ENR | ($130.36) | -0.326 |
| JRC | $77.84 | 0.195 |
| FMT | ($268.38) | -0.671 |
| MLS | ($655.26) | -1.638 |
| MRCY | ($201.60) | -0.504 |
| ASVI | ($352.58) | -0.893 |
| RHB | ($352.16) | -0.903 |
| ($3,685.17) | -9.248 | |
| Average R-multiple | -0.37 | |
Our portfolio, as shown in Table 1, has open profits of $1616.56. Our closed trades show a loss of $3685.17. Thus, our total results to date show a loss of $2,068.61. I�m not happy with those results, but it�s an improvement from last month. Hopefully, we�ll start to see some persistent trends. However, remember that my purpose in doing this is not to produce a great system. Instead, it is to take a simple concept and show you how to test it in real time because that�s the best kind of testing, and you�ll understand more of what you have to go through to trade it. For example, many of you have probably decided that you �d never trade this because it hasn�t made money in seven months. But that�s the nature of trend-following systems sometimes. That doesn�t mean we won�t hit some big ones eventually that will cause the system to take off.
Comment: Dr Tharp, I�m trying to do the math for the R-multiples, but my numbers don�t come out quite the same as yours. I want to understand this so will you please tell me what�s different.
Answer: When you do R-multiples with two decimal places it seems very exact, but it isn�t. There are many areas where numbers can be rounded off. These include:
I add and subtract commissions of $15 in various places, such as when I buy and when I sell.
When you calculate the number of shares, you start with your percent of total equity you will risk. That varies from month to month, depending upon the equity model you are using and what the equity is at the end of the month. For example, we started out with $20,000. �But we have losses of $2068.61. That means that right now our equity is $17,932. You might have used a different equity in your calculations. �And remember it�s different each month because we�re no longer risking 2% of the initial equity. We are risking 2% of the current equity.
For this month�s calculations, we�ll be risking 2% of $17,932 or $358.64.
To determine the position size, I�ll be dividing that number by the risk per share. Let�s say we can buy it at the closing price of $57.96. That means that our risk per share will be 20% of that or $11.592. I�ll round that to $11.60.
Now when we divide $358.64 of total risk by $11.60, we get 30.91 shares. Notice the rounding that has happened. And I can�t buy 0.91 shares, so I�ll buy 30 shares.�
Now if the price is $57.96 and we buy 30 shares, it means that we�ll pay $1738.80, plus $15 in commissions for a total of $1753.80.�
Notice that if we take 20% of that as our risk, we have $350.76 � not $358. And I�d probably round that to $350 or I sometimes use a rounded version of the original risk estimate such as $360.
There are even more sources of rounding errors on the sell side.
So here is the bottom line. Although I use Excel to calculate all of the values, there are numerous potential rounding decisions. So if I get 1.56R and you get 1.65R, it�s probably due to differences in rounding.
However, remember that when I do simulations and when I play marble games, I round even more. I�ll round numbers or when simulating real data, I put the R-multiples into bins. Thus, if you look at the closed out trades so far, I�d probably have the following bins for the losses.
0 to minus 0.25R: 5
Minus 0.26R to minus 0.50R: 6
Minus 0.51R to minus 0.75R: 2
Minus 0.76R to minus 1R: 7
Minus 1.1R to minus 1.25R: 0
Minus 1.26R to minus 1.50R: 0
Minus 1.51R to minus 1.75R: 1
Yes, it�s nice to have two-digit accuracy on your R-multiples and your expectancy, but when you have rounding, it�s never that accurate. And the bins above are fine for simulations.
Until next months portfolio review, this is Van Tharp.
About Van Tharp: Trading coach, and author Dr. Van K. Tharp, is widely recognized for his best-selling book Trade Your Way to Financial Fre-edom and his outstanding Peak Performance Home Study program - a highly regarded classic that is suitable for all levels of traders and investors. You can learn more about Van Tharp at www.iitm.com.
NEW WORKSHOP
Professional E-Mini Futures Tactics
March 3-5, 2007
Presented by D.R. Barton, Jr.
E-mini index futures are among the most popular trading instruments in the world. Low margin rates and low commissions combine to make e-mini futures trading one of the most highly leveraged and profitable areas in all of trading.
Learn how pro traders take consistent profits from the e-mini markets.
Don't become one of those traders who tries futures trading and loses a bundle by trading like the herd.
Discover the tools and tactics that top traders use to gain a huge edge in these volatile and profitable markets.
Trading and Christmas Presents (Part V)
by
D.R. Barton, Jr.
"A thing long expected takes the form of the unexpected when at last it comes. " --Mark Twain
For the past four weeks we�ve discussed one of the big problems with finding a trading system that fits you. I call it the Christmas Present Syndrome because the problem is like the one that faces people as they open presents. When we unwrap a present or dig into new trading system or idea, we are confronted with a difficult emotional and intellectual transition: we move from the world of possibility filled with hope and unlimited expectation into the world of definitive knowledge, filled with the reality that flaws and tradeoffs really do exist and that it may not work as well as it did on TV. During the holidays, having our Christmas presents turn from possibility into reality can cause a bit of post-celebration overeating.
But with a trading system, Christmas Present Syndrome can cause us to toss out good and useful ideas. Or worse yet to blindly tweak systems, killing long-term performance or leading to other unintended consequences.
To combat the knee-jerk of throwing out a trading system or idea the first time we find a tradeoff that has to be considered, we spent the last two articles talking about setting goals for our trading (BEFORE looking for a system) and looking at some key big-picture measurements of system performance that should help be considered. This week we�ll look at some other measure of performance that should be considered when evaluating your trading system. Make sure you look at the following as you review your candidate system (in addition to the items that we discussed last week):
� What percentage of the system�s profits did the top two or three winners generate? This is a frequent problem for systems that have a low frequency of trades or long holding times. Some position trading systems are notorious for generating great track records because they caught one or two phenomenal moves and were mediocre on the rest of the trades. While catching big trades is a good thing, you can�t have a system that is breakeven or even a loser except for that once-in-a-decade move in coffee� One way to test your system to make sure it isn�t a �one hit wonder� is to see how well it performs if you omit the best three and the worst three trades.
� Pay attention to the average profit generated per trade. This is the net profit divided by the total number of trades. When all other characteristics are equal, this is a great tie-breaker. Gravitate toward systems which, for the same time frame (i.e. day trading or swing trading), generate the same amount of net profits in fewer trades. But be sure that all the profits aren�t generated by a few trades (see the first item above).
� Be sure to look at some measure of variability of the trading results. A system with a smooth equity curve is much easier to trade than one that has huge run-ups and scary drawdowns. Look at the standard deviation of your trades, and look at the standard deviation of just the winning trades and just the losing trades. Look at the standard deviation of monthly returns as well. An added benefit of a smooth equity curve is that you can implement more aggressive position sizing when a system exhibits lower variability.
� Once again, make sure you concentrate on the things that matter most to you and your trading style. If you can�t stand long strings of losses, don�t waste your time reviewing long-term trend following systems that only win 35 percent of the time. And if making frequent decisions and taking action now aren�t your thing, then avoid shorter time- frame systems.
� Always look at the tradeoffs that arise when you make changes to increase performance in one area. If you increase winning percentages, then average profit per trade will most likely drop as will the ratio of the average winner divided by the average loser.
� How will transaction costs affect the system performance? Transaction costs usually vary in importance in inverse proportion to the time spent holding each trade. For longer holding times, transaction costs play a smaller role. Shorter holding times increase the significance of transaction costs.
� Think often about the influence of trading frequency. Does the system trade often enough to keep your interest? Does it trade too frequently for you to execute it properly? Do you have sufficient account equity to take all of the signals? This is one of the most overlooked areas of systems analysis.
This list is by no means exhaustive, but includes some of the items that I concentrate on when analyzing systems. Next time we�ll take a final look at trading systems and Christmas presents.
D. R. Barton, Jr. will be teaching our next How to Develop a Winning Trading System Workshop, January 26-28th in Phoenix, AZ. He is the Chief Operating Officer and Risk Manager for the Directional Research and Trading hedge fund group. D. R. has been actively involved in trading, researching, and teaching in the markets since 1986. D. R. has taught extensively in many investment areas including intra-day trading, swing trading, and cutting edge risk management techniques.
His writing credits include co-authoring Safe Strategies for Fin-ancial Fre-edom and co-creator and contributing author on Fin-ancial Fre-edom Through Electronic Day Trading.
D.R. presents the Professional E-Mini Futures Tactics, Proven Swing Trading Strategies Workshop, and Professional Tactics for Day Traders Workshop. Each workshop is only held once per year.
How to Develop a Winning Trading System Workshop
Presented by D.R. Barton and Chuck LeBeau
Phoenix, Arizona January 26-28, 2007
Stop the World � I Want to Get Off
by Melita Hunt
Have you ever had one of those mornings when your head is talking before you even wake up? And then when you actually do wake up, it is spilling out information and has already created a long list of all of the things that are �on your plate� and need to be done before your feet hit the ground? And as they do hit the ground, you are in automatic mode, going through your routine and answering yourself back, adding to the list or trying to rearrange to get everything into the day.
Do you miss hearing the morning and just laying there for a while, enjoying the waking sensation and the peace and quiet? Some of you may think this is a pipedream. I bet others have forgotten that it is even possible to start the day like that. We are so used to radios and alarms, busy households, kids, traffic and the whir of the day. Even when we have a very positive morning ritual, our minds seem to be running the show from the moment that they get our attention.
Some days I get to sleep in and enjoy a quiet morning, and thankfully I live next to a wooded area and running stream. Other times I have to be up and at it straight away, but I have one small routine that I have spoken about for years, and I endeavor to fit it into my morning no matter what. It is the simple art of journaling. I pick up a pad and paper even with eyes half closed, before I get out of bed and I let all of those thoughts that so desperately want to be heard, to just spill onto the paper. I don�t pay much attention to what my hand is writing, nor do I even read it again; it is simply a way to clear my head. Sometimes it�s 3 lines and sometimes its 3 pages, usually much ado about nothing, but clearing the chatter seems to create the space for a new day and new solutions. Then I have a couple of quiet minutes back on the pillow with an empty mind. And it is blissful.
If you don�t make the time to slow down, meditate or have quiet time during the day, then I encourage you to at least try this one simple exercise for 5 days straight and I am sure that you will notice a remarkable difference in the progression of your day.You can contact Melita at [email protected]
Join in the discussions on our blog and forum
Do Not Reply to this email using the reply button as the email address is not monitored, your email will not be seen. Please click this link to contact us: [email protected]
The Van Tharp Institute does not support spamming in any way, shape or form. This is a subscription based newsletter.
If you no longer wish to subscribe, Unsubscribe Here
Or, paste this address in your browser: http://www.iitm.com/privacy_policy.htm
The Van Tharp Institute
102-A Commonwealth Court, Cary, NC 27511 USA
800-385-4486 * 919-466-0043 * Fax 919-466-0408
Copyright 2006 the International Institute of Trading Mastery, Inc.