Do You Want to Join our 20% OFF sale?
It is just ONE of the bonus gifts that you will receive when you pre-order the fully revised edition of Van�s best selling classic:
Trade Your Way to Financial Freedom
Now over 450 pages long
Order Now and get your bonuses including 20% off our core products
November Workshop Winner: Congratulations Jerome Beck!
(Get in the running for the December and January Draws by clicking above)
Tharp�s Thoughts
Market Update for December 5, 2006
1-2-3 Model Still in Red Light Mode
By
Van K. Tharp
Look for these monthly updates on the first issue of each month. This allows us to get the closing month data. In these updates, we�ll be covering each of the major models mentioned in the Safe Strategies book: 1) the 1-2-3 stock market model; 2) the five week status on each of the major stock U.S. stock market indices; 3) our new four star inflation-deflation model; and we�ll be 4) tracking the dollar.
Part I: Market Commentary
We have passed the rough part of the year (May through November) without a significant drop in the major averages. And now is the time the pension money starts pouring into the stock market. In fact, the mutual funds have lots of cash flowing in so that is part of the reason the stock market is going up in 2006.
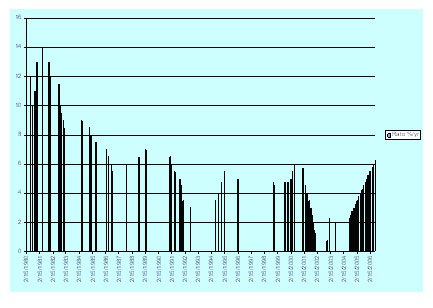
There is also another reason for short term optimism in this secular bear market. The Federal Reserve has not increased the discount rate since July 29th 2006. According to the 1-2-3 stock market model, when the Fed stays out of the way for six months, that indicator turns to green. That will happen at the end of the year on December 29th. However, just to put things in perspective, look at the following bar chart of the discount rate changes over the last 25 years shown in Figure 1. Notice that short term rates are as high as they have been in a long time. They are higher than their peak in 2000, which may have partially triggered the bear market. Also notice that the slow steady rise in rates that we�ve experienced recently is unprecedented.
However, the increase in the stock market must also be tempered by looking at the dollar. The dollar index, against the world�s major currencies, now starts at 81.62. It�s down nearly 5% and that�s under conditions in which money should be attracted to the U.S. dollar because it is being paid a fairly good interest rate. In fact, when the Fed started to increase rates in early 2004, the dollar index was above 90. Money should start to move into the dollar when interest rates start to rise. But as the discount rate has risen from 0.75% to 6.25%, the dollar index has fallen steadily. However, in December of 2003 when the discount rate was still 2%, the ten year bond was at 4.26% interest. Today, with a discount rate at 6.25%, the ten year bond yields 4.425%. In other words, we have a negative yield curve. What does that tell you?
For those of you who have not yet read Safe Strategies for Financial Freedom, the US has had a fiat currency for thirty-five years since August 1971 when Nixon refused to back the dollar by gold. At that time the federal government debt was $US 400 Billion. It has been a net international debtor for more than twenty-one years since March 1985 when federal government debt was just under $US 2 TRILLION. The present Bush Administration, now halfway through its second term, has already amassed nearly HALF of all Federal Government debt borrowed since 1787. That should explain why the U.S. dollar has not gone up.
Figure 1: Changes to the Discount Rate since 1980
Now that the November elections are over, I�d expect that the real inflation data will begin to come up. And, as you�ll see later in this update, data which looked deflationary last month are starting to look very inflationary.
Next, let�s talk about the market making new highs. During the bear market crash, the Dow Jones Industrials and the S&P 500 never retreated that much. This is because most mutual funds were invested in them and they never sold them off. They were quite happy to let their funds drop 20% or more during the market decline because that is what the major averages did.
Well, money is still pouring into pension funds (and thus mutual funds) and being invested in those two indices. Consequently, it is not surprising that the DOW is making new highs. But, ask yourself, what will happen when baby boomers start a net redemption of the retirement funds. It won�t be pretty for the mutual funds or the major averages that they use as benchmarks.
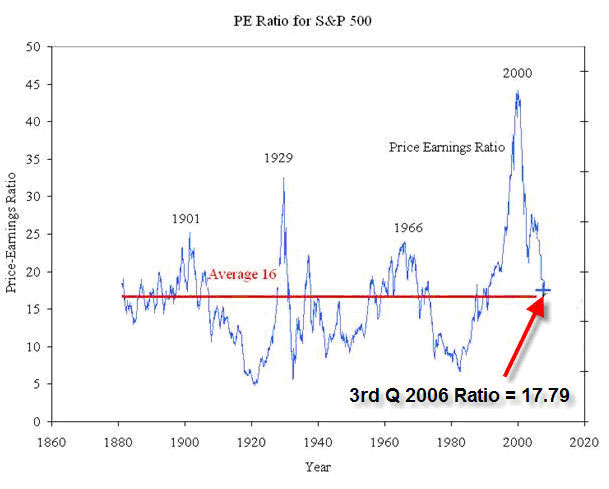
Lastly, let me remind you that a secular bear market simply means that over the long term I expect valuations (i.e., PE ratios) to go down. Below is a chart of PE ratios since the secular bear market began. And I don�t expect this secular bear to be over until the PE ratio of stocks in the S&P 500 reach the single digit mark. The PE ratio of the S&P 500 is currently estimated to be about 17.79, which is still above the historical average of 16. And remember that secular bear markets (defined by decreasing PE ratios) do not end until those ratios are single digit numbers.
Part II: The 1-2-3 Stock Market Model IS IN RED LIGHT MODE
The Fed has stopped tightening, so are we still in Red Light Mode? Yes, we are, but that could change on December 29th if the market continues to rise as I explained earlier.
Let�s look at what the market has done over the last five weeks and compare that with where the averages were December 31st last year. This is given in the next table. Incidentally, this data is calculated by hand based upon last Friday�s close (i.e., December 1st, 2006), so there is always a possibility of human error in our numbers.
|
Table
1: Weekly Changes for the Three Major Stock Indices |
||||||
|
|
Dow
30 |
S&P
500 |
NASDAQ
100 |
|||
|
Date |
Close |
%
Change |
Close |
%Change |
Close |
%
Change |
|
12/31/2004 |
10,783.01 |
|
1211.12 |
|
1621.12 |
|
|
12/30/2005 |
10,717.50 |
-0.60% |
1248.29 |
3.10% |
1645.20 |
1.50% |
|
27-Oct-06 |
12,090.26 |
|
1,377.34 |
|
1,717.61 |
|
|
3-Nov-06 |
11,986.04 |
-0.86% |
1,364.30 |
-0.95% |
1,703.98 |
-0.79% |
|
10-Nov-06 |
12,108.43 |
1.02% |
1,380.90 |
1.22% |
1,751.11 |
2.77% |
|
17-Nov-06 |
12,342.55 |
1.93% |
1,401.20 |
1.47% |
1,800.67 |
2.83% |
|
24-Nov-06 |
12,280.17 |
-0.51% |
1,400.95 |
-0.02% |
1,815.53 |
0.83% |
|
1-Dec-06 |
12,194.13 |
-0.70% |
1,396.71 |
-0.30% |
1,775.12 |
-2.23% |
The market is continuing to rise and it looks like the major averages could be up 10% or more by the end of the year. If that happens, it�ll be interesting to compare the U.S. Market with the rest of the world for the same period.
Part III: Our Four Star Inflation-Deflation Model
I now strongly believe that we are in an inflationary bear market and that our inflation rate is simply masked by government statistics.
So far our models have been telling us, that inflation/deflation is pretty steady, with a slight inflationary bias and that�s where secular bear markets tend to start.
So what�s our new indicator telling us about inflation?
1) The CRB Index
2) The Basic Materials Sector (XLB)
3) The London Price of Gold and
4) The Financial Sector (XLF)
Since the description of the model we�re now using is not in any of my books, I�ll continue to give it here.
1) The CRB Index. I believe that the CRB index is the one we have currently that is the least manipulated by the government. But what�s the best way to measure it? For consistency, I plan to give two measurements.
� Is the CRB index higher than it was six months ago? If it is, we are on track for inflation.
� Is the CRB index higher than it was two months ago?
Now there are several ways to monitor these two indices.
� If both differences are higher, we�ll count one star for inflation.
� If the six-month change is higher, but the two-month change is not, then we will only count � star for inflation.
� And if both the two and six month changes are lower, then we�ll be minus one for inflation.
� However, if the six-month change is lower, while the two-month change is higher, then we�ll be minus � star for inflation. Obviously, the two minus scores will point to deflation.
2) The Basic Materials Sector ETF (XLB). In an inflationary environment, basic materials will definitely go up and this sector, to the best of my knowledge, is not manipulated by the government. Thus, we will use this sector to monitor inflation and we�ll use the same measurements use for the CRB. (1) Is the XLB higher than it was six months ago? (2) Is the XLB higher than it was two months ago? These two measurements give us four possible results.
� If both differences are higher, we�ll count one star for inflation.
� If the six-month change is higher, but the two-month change is not, then we will only count � star for inflation.
� And if both the two and six month changes are lower, then we�ll be minus one for inflation.
� However, if the six-month change is lower, while the two-month change is higher, then we�ll be minus � star for inflation. Obviously, the two minus scores will point to deflation.
3) The London PM Gold price at the end of each month. Although the government can manipulate Gold, I still like to look at monthly gold prices. However, to be consistent, we�ll use the same two measurements that we�ve used for the other indices that we are monitoring. (1) Is the price higher than it was six months ago? (2) Is the price higher than it was two months ago? Again, these two measurements give us four possible results.
� If both differences are higher, we�ll count one star for inflation.
� If the six-month change is higher, but the two-month change is not, then we will only count � star for inflation.
� And if both the two and six-month changes are lower, then we�ll be minus one for inflation.
� However, if the six-month change is lower, while the two-month change is higher, then we�ll be minus � star for inflation. Obviously, the two minus scores will point to deflation.
4) The Fourth Measurement we�ll use is related to the Financial Sector of the S&P 500. The financial sector (XLF) tends to do well when we have deflation and poorly when we have inflation. Martin Pring, in fact, has used an index in which he divides the XLB by the XLF. Since we already use the XLB, we�ll use the XLF by itself as well. Again, we�ll use the change over six months and over two months. However, the four possible outcomes with give us a different interpretation.
� If both differences are higher, we�ll count one star for deflation (i.e., minus one for inflation).
� If the six-month change is higher, but the two-month change is not, then we will only count � star for deflation (i.e., minus � for inflation). And if both the two and six month changes are lower, then we�ll be plus one for inflation.
� However, if the six-month change is lower, while the two-month change is higher, then we�ll be plus � star for inflation. Obviously, the two minus scores will point to strong inflation.
Okay, so now let�s look at the results for the last six months.
|
Date |
CRB |
XLB |
Gold |
XLF |
|
November
30th |
332.49 |
29.67 |
495.85 |
31.87 |
|
December
30th 2005 |
347.89 |
30.28 |
513.00 |
31.67 |
|
January
31st 2006 |
363.30 |
31.74 |
568.25 |
31.95 |
|
February
28th |
353.27 |
31.06 |
556.00 |
32.63 |
|
March
30th |
364.70 |
32.35 |
582.00 |
32.55 |
|
April
28th |
379.53 |
33.50 |
644.00 |
33.96 |
|
May
31st |
379.80 |
31.95 |
653.00 |
32.56 |
|
June
30th |
385.63 |
32.10 |
613.50 |
32.34 |
|
July
31st |
391.49 |
30.90 |
632.50 |
33.08 |
|
August
31st |
390.95 |
32.19 |
623.50 |
33.52 |
|
September
30th |
379.10 |
31.82 |
599.25 |
34.62 |
|
October
31st |
383.92 |
33.33 |
603.75 |
35.43 |
|
November
30th 2006 |
408.79 |
35.00 |
646.70 |
35.68 |
We�ll now look at the two-month and six-month changes during 2006, to see what our readings have been.
|
Date |
CRB2 |
CRB6 |
XLB2 |
XLB6 |
Gold2 |
Gold6 |
XLF2 |
XLF6 |
Total
Score |
|
October |
Higher |
Higher |
Higher |
Higher |
Higher |
Higher |
Higher |
Higher |
|
|
|
|
+1 |
|
+1 |
|
+1 |
|
-1 |
+2 |
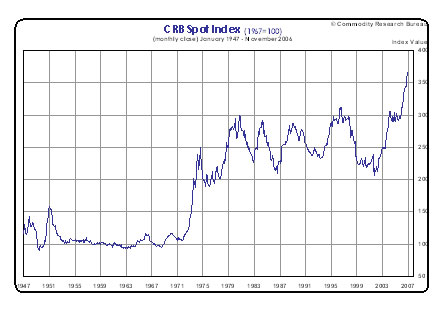
The results of this model are much more sensitive (I believe) than the model I presented in Safe Strategies for Financial Freedom. The model once again shows that inflation is winning. And, by the way, thanks for those of you who gave me the CRB data for September. I think the CRB is one of the best measures of inflations and I�d like to show you a long-term chart of the monthly CRB. Notice the great commodity boom of the 1970s, which ended in a hugely inflationary period. And notice what�s happened to the index since the secular bear market started in 2000.
Part IV: Tracking the Dollar
The U.S. dollar is still looking weak. It was relatively flat for about six months and then it started a major fall against the Euro which is still going on. This is another reason that the Federal Reserve needs to keep rates high. When interest rates are high, people are attracted to the dollar. But when rates are falling, they will dump it quickly. The IMF has already said that the dollar, at current rates, is 35% overvalued. Can you imagine the impact of the dollar falling another 35%?
|
The Dollar Index |
|
|
Month |
Dollar Index |
|
Jan
05 |
81.06 |
|
Jan
06 |
84.44 |
|
Feb
06 |
85.22 |
|
Mar
06 |
85.17 |
|
Apr
06 |
84.05 |
|
May
06 |
80.77 |
|
June
06 |
81.66 |
|
July
06 |
82.09 |
|
Aug
06 |
81.33 |
|
Sep
06 |
81.75 |
|
Oct
06 |
82.52 |
|
Nov
06 |
81.62 |
There is almost a magic number to the dollar index. Since the U.S. dollar became a fiat currency in 1971, the U.S. dollar index has generally stayed above 80. In fact, 80 is like the major support for the dollar index. It has only traded below 80 for 13 days of its 34 year history. So if the dollar should fall below that level and do so for a significant amount of time, our currency might be in real danger of a free fall. Remember, there are major currency players all over the world who look at long term charts and should they see the dollar fall below 80 for a significant period, it�s a danger. And should it fall below its all time low of 78.33, then every currency trader in the world, every hedge fund, every derivative issuer, every banker, and every holder of US Dollars and US Dollar denominated instruments of any kind would literally be flying blind. (Incidentally, I track the major currency dollar index and not the 17 major trading partner�s index).
With that little scare in mind, and many people are aware of it because of the IMF evaluation of the dollar, let me remind you that the dollar has not fallen below 80. More importantly, there is a lot of fear about the dollar and that usually signals a turning point. And perhaps most significantly, the cover of the Economist magazine recently features the falling dollar as a major headline. This is usually means that the dollar is due for a rally.
Right now there is no currency around to replace the dollar. It�s not going to be the Euro and I don�t think a major Asian currency becoming the world�s reserve is very close.
On the other hand, I�m going to Europe for the start of the New Year. And my experience is that when Van needs the dollar to be high, it usually falls.
Until
January�s update, this is Van Tharp.
Trade Your Way to Financial Freedom
2nd edition
Over the years, I occasionally run across beliefs that seem to help people even more than those reflected in the first edition of this book. And after seven years, I�ve adopted many new, more useful beliefs. As a result, even though most of the core concepts have not changed, I still believe that enough things have changed that I can help people even further with a new edition of this book. ~Van K Tharp~
HAPPY BIRTHDAY D.R. !
A
Review of Market Models:
Steidlmayer�s
Market Profile III
by
D.R. Barton, Jr.
This is the third article in our series on J. Peter Steidlmayer�s Market Profile tool.
The next couple of paragraphs are a repeat from last week to give everyone the basics.
For those not familiar with Market Profile, it is characterized as �a dynamic technical tool that organizes price, time, and volume into powerful trading structures based on the bell curve� in the CBOT�s literature.
A typical market profile would look like this:
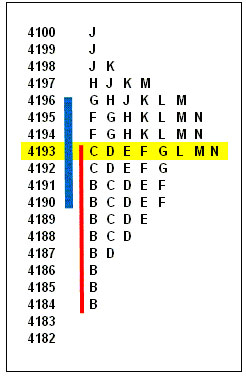
Each letter represents a time frame (30 minutes is the default) and a letter is printed at each price traded during that 30 minute period. Most days, prices align themselves in a bell curve, giving us useful information about buying and selling pressures.
Now for this week�s update: The five Market Profile Structures give users a framework within which they can classify any market day according to the profile that is built during the day. Here are the five structures and a brief description of each:
Non-Trend Day. This structure has a small initial balance that contains the entire day's price range. A non-trend day typically occurs when the market is resting or stagnating.
Normal Day. The normal day has a wide initial balance price range that equals approximately 80% of the day's total range. This is the most common pattern.
Normal Variation. This structure's initial balance equals approximately 50% of the day�s total price range. Normal variation days have initial balance range extension in one direction or the other.
Trend Day. The trend day has a small initial balance representing less than 25% of the entire day's range. This profile shows domination by either buyers or sellers with long range extension in one direction. The trend day will close within 5% to 10% of its daily high or low price.
Neutral Day. This profile is not characterized by its initial balance but by a range extension in both directions and a close near the center of the day's range. This structure demonstrates lack of buyer and seller conviction.
How can this framework be used?
Even without Market Profile software, this structure gives you some key clues about how Market Profile works. A key concept is the �initial balance�. This is defined as the price range during the first hour of trading. The fact that all of the structure types reference this area shows how important it is!
How the rest of the day trades relative to this �initial balance� can give you key information and a distinct edge in deciding what side of the market to favor.
For example, if price can�t break outside of (or stay outside of) the initial balance zone, then you can play channeling type plays. When price breaks out in either direction, then the possibility for a trend day is greatly increased. This info alone can give you a really nice edge in your trading
Great Trading!
D. R. Barton, Jr. is the Chief Operating Officer and Risk Manager for the Directional Research and Trading hedge fund group. D. R. has been actively involved in trading, researching, and teaching in the markets since 1986. D. R. has taught extensively in many investment areas including intra-day trading, swing trading, and cutting edge risk management techniques.
His writing credits include co-authoring Safe Strategies for Fin-ancial Fre-edom and co-creator and contributing author on Fin-ancial Fre-edom Through Electronic Day Trading.
D.R. presents the IITM Proven Strategies Swing Trading Workshop and Professional Tactics for Day Traders Workshop. Each workshop is only held once each year.
The Gift in the Moment
by Melilta Hunt
In a particularly challenging week, I was wondering how to come up with an inspirational piece that was uplifting as well as appropriate. That is when I realized that it is during the difficult times that we need inspiration the most.
This morning I just wanted to jump on a plane and head off to a tropical island somewhere in the sun and then I thought �wherever you go, there you are.� How did I want to feel differently? Who was I hoping to see, or spend time with or who did I want to get away from? I think the short-lived thought was just a means of �escape�, and then reality kicked in: I have responsibilities and a life that is happening right here right now. A life that is full of ups and downs; but that�s what makes it so precious.
Life is all about the fleeting moments. We strive so hard to be happy, peaceful or just to feel okay; yet working through the tough times and sometimes feeling down is what allows us to appreciate the good times. Life doesn�t happen later, nor does it happen in a place where we imagine everything will be rosy. Life is being lived right now, in this moment wherever you are, regardless of what it feels and looks like.
And surprisingly, there is a gift in every one of those moments.
You can contact Melita at [email protected]
Join in the discussions on our blog and forum
Do Not Reply to this email using the reply button as the email address is not monitored, your email will not be seen. Please click this link to contact us: [email protected]
The Van Tharp Institute does not support spamming in any way, shape or form. This is a subscription based newsletter.
If you no longer wish to subscribe, Unsubscribe Here
Or, paste this address in your browser: http://www.iitm.com/privacy_policy.htm
The Van Tharp Institute
102-A Commonwealth Court, Cary, NC 27511 USA
800-385-4486 * 919-466-0043 * Fax 919-466-0408
Copyright 2006 the International Institute of Trading Mastery, Inc.