Re-Release of Van's Best Selling Classic
Trade Your Way to Financial Freedom
Updated and Completely Revised
Pre-Order Your Copy Now For Just $19.77 and Get Six Great Bonus Gifts
USING NEWSLETTER RECOMMENDATIONS AS SAMPLE SYSTEMS
By
Van K. Tharp
An Adapted Excerpt from the NEW Updated and Fully Revised
Trade Your Way to Financial Freedom
I thought you�d find it interesting to look at the recommendations generated by various newsletters as sample trading systems. In doing so, I wanted to (1) determine if newsletters as a whole represented good systems, (2) determine if certain trading ideas were better than others, and (3) give you some information about what you can expect if you follow the recommendations of various newsletters. In order to do this, I approached three groups of newsletters. I told them I would only mention the names of the newsletters if they did well. Two of the groups were eager to cooperate and sent us the data we needed to calculate and analyze their R multiples over a large number of years. The head of one group, even said to me, �You can mention the names of all of our newsletters. If we have one that isn�t any good, then we�ll just close it down.� In contrast, another group leader said, �We have no idea what our performance is, and we certainly would not want you to mention the names of our newsletters if we don�t look good.� These newsletters were all involved in options strategies, and we elected not to even look at them.
Data Analysis
For each newsletter we took the entry date and price and the stop recommended by the newsletter. Most of the newsletters we looked at had 25 percent trailing stops. However, if the newsletter didn�t have a stop, we made the assumption that the initial risk was 25 percent of the entry price. Thus, if the stock went to zero, it would present a 4R loss, and if the stock doubled in value, it would represent a 4R gain. Some of the newsletters make only one recommendation each month (or less), and they tend to hold on to their recommendations. As a result, we assumed that all active positions were closed on June 30, 2006, and we took the closing price on that date as the exit price. For several of them, we only had data through March 31, 2006, so that date was taken as the closing date.
For each newsletter, we calculated several key variables. What was the expectancy of the recommendations for the entire data set we had? How many positions were opened per month on the average? We used that data to determine how many trades to expect in a two-year period so that we could calculate the expectunity of each newsletter. And last, we used a proprietary measure to determine how well one could use position sizing with the recommendations in order to meet one�s objectives.
The Newsletters
Here�s some information about each one. (Full Names are given in the book but not in this article):
Newsletter One This newsletter is put out monthly by a portfolio manager. It�s designed to give you his best picks, and these are all stock picks that you should hold onto for at least a year. The newsletter was tracked from the end of December 2003 to March 2006. During that time there were 32 recommendations that were closed out. In this case, we didn�t look at open positions. This newsletter did not give stops, so we assumed that a 25 percent drop was equivalent to 1R. This newsletter also does not track its own performance, showing the initial recommended price along with the current price.
Newsletter Two reminds me of a stock analyst�s top picks. The editor looks for stocks that have new products (that is, usually in a research stage) that he believes could have a major impact on the consumer. He holds a monthly conference call with the CEO and other representatives of the company once the stock is recommended. They don�t recommend any stop loss (so we used 25 percent of the entry price to determine 1R), and it will hang on to losers for a long time if the editor thinks there is still potential (that is, even after it has dropped a long way). We tracked this newsletter from January 2001 through March 2006. During that time there were 36 recommendations, of which 44.4 percent made money. Of the original recommendations, 22 are still in the portfolio. However, for our calculations we assumed they were closed on March 31, 2006. This newsletter closed down shortly after we did our analysis.
Newsletter Three focuses on various value models for picking stocks. The basic investment idea is to find stocks that are extremely undervalued. No stops are given for these stocks, so we assumed that 1R was a 25 percent drop in price. We tracked this newsletter from September 2002 until June 2006. During that time the editor made 37 recommendations, and he�s still in 21 of them, so we used the June 30, 2006 price to assess the R multiples of those trades.
Newsletter Four This newsletter makes the assumption that when insiders of major companies are buying their stock in a big way, then the stock is probably a great buy. We tracked the newsletter from March 2004 through June 2006. During that time there was a trade recommendation each month for a total of 27 positions. We also included the editor�s �special holdings� recommendations for an additional 6 positions. This newsletter was still holding on to 58 percent of the recommendations over the two years. Again, we used a 25 percent decrease in price as the initial risk.
Newsletter Five was started by a young man who decided to find efficient stocks that were micro caps. Small stocks tend to move a lot more than large-cap stocks, so this idea has the potential for some real �home run stocks.� We followed this newsletter from October 2003 through June 2006. The original editor left on March 18, 2005, with the words, �The choppy market conditions of the last few months could drive a person to drink. Who�s with me?� The next week he was replaced with another editor who has been handling the letter since that time. There are clear stops with this newsletter, which we followed in assessing the R multiples.
Newsletter Six This newsletter represents the recommendations of a number of different people, so it is somewhat eclectic. This was the first newsletter I know of to institute a clear stop-loss policy, using 25 percent trailing stops (on a close-only basis) to control losses and tell them when to take profits. The newsletter has several different portfolios. However, we tracked only one of them. We tracked 166 recommendations made between September 1999 and June 2006. Of those positions, 27 were still open so we used the price on June 30, 2006, to determine the R multiple of those positions.
Newsletter Seven These recommendations are mostly momentum stocks. We tracked the recommendations from July 1998 through March 2006. During that 93-month period, we tracked 174 recommendations, and we included the 10.9 percent that were still open. Here we used their stops.
Newsletter Eight This is one of the more popular newsletters in the United States Basically, it is based on looking for investments that everyone else hates and that have limited downside potential and great upside potential. The recommendations must be moving up before they are made.
Newsletter Nine Is the most expensive newsletter that we tracked. It gives weekly trades by e-mail with the idea of going for 100 percent growth or more. The editor who writes it is great at marketing, so if you are on his list, you�ll be told that (1) he�s got a secret system for picking stocks; (2) while some of his other newsletters might make 100 percent or more, this one is designed to be the best of the best; (3) he�s one of the top-ranked newsletter writers in the world according to an independent source.
The Performance of the Newsletters
The Table shows the overall performance of the newsletters. It gives the total number of trades, the expectancy, the expectunity of the method over two years, and my proprietary evaluation of how likely you are to be able to meet your objectives using position sizing. With this indicator, a system that significantly makes money at the 0.05 percent level would have a rating of about 1. A rating above 2 is very good, and a rating above 3 is superb. However, at one of our workshops we teach some systems that have ratings above 5.
| Newsletter |
Trades |
Win Rate, % |
Expectancy |
Expectunity (in 2 years) |
System Quality |
| Newsletter One | 32 | 36.5 | 0.05 | 1.37R | 0.21 |
| Newsletter Two | 36 | 44.4 | 1.67 | 22.37R | 1.17 |
| Newsletter Three | 37 | 89.1 | 1.40 | 27.06R | 2.99 |
| Newsletter Four | 27 | 48.1 | 0.35 | 8.4R | 1.47 |
| Newsletter Five | 79 | 49.4 | 0.28 | 16.09R | 1.59 |
| Newsletter Six | 168 | 54.2 | 0.79 | 38.84R | 2.17 |
| Newsletter Seven | 174 | 48.0 | 0.61 | 26.68R | 1.65 |
| Newsletter Eight | 77 | 67.5 | 0.68 | 21.68R | 2.54 |
| Newsletter Nine | 241 | 36.5 | −0.01 | −2.2R | −0.05 |
Newsletter Analysis
The two value-oriented newsletters came out with the highest win rates and with the highest system quality, meaning that you are more likely to meet your objectives with these newsletters with proper position sizing. Both of these newsletters still had a high percentage of active trades�57 percent with Newsletter 3 and 29 percent with Newsletter 8, which we have been tracking much longer.
Newsletter Six came in with the highest expectunity over two years. It showed a total R gain of 38.84R over two years. Thus, at 1 percent risk per position, you probably could have easily made 20 percent or more each year with this newsletter.
Newsletter Two showed the highest expectancy at 1.67. This is because it hit a few home runs, as was its intention. However, it also had a number of stocks that lost 50 percent or more and are still in the portfolio. Because of the large performance variability, Newsletter Two didn�t have very high rankings in any of the other categories. It could be a much better newsletter if some of the techniques suggested in Trade Your Way to Financial Freedom were used with it. However, some of the home run stocks might have stopped out before they became home runs had such stops been in place.
These newsletters all represent different types of ideas, and most of them made pretty good profits. The value-oriented newsletters seemed to perform best, but that doesn�t mean that value investing is a better concept than trend following. I�ve also seen some trend-following systems with system quality numbers that are off the charts (that is, above 5.0). Thus, I don�t think this proves that the value concepts are better than any other concept.
What was quite surprising was the negative expectancy produced by the most expensive newsletter that was evaluated. What can be learned from that? Well, that newsletter did not track its own performance. If you decide to subscribe to a newsletter, be wary of any that don�t give you regular performance updates.
Conclusion
If you want a newsletter-following system, you still must find a newsletter with trading concepts and an overall strategy that fit your beliefs. I�d also recommend that you do the same kind of analysis that I did here for each newsletter you plan to follow. This means that (1) they must make back issues available to you and (2) they must track their own performance. If you talk to a newsletter editor and he or she doesn�t even know his or her track record (that is, it is not likely that they�ll tell you that), then run for the hills. Better yet, see if the newsletter publishes a list of their past recommendations along with the entry price, the initial risk, and the exit price. You can determine the R multiples and expectancy on your own from that.
This article was an adaptation from the soon to be released second edition of Van K Tharp�s bestselling book Trade Your Way to Financial Freedom. The full article plus the names of the actual newsletters used in this test can be found in Chapter Thirteen of the new book.
| Pre-order and secure your copy NOW from Amazon.com for just $19.77 (usual price $29.95) and receive a package of FREE BONUS gifts, including access to the Van Tharp Institute limited time 20% off sale. |
About Van Tharp: Trading coach, and author Dr. Van K. Tharp, is widely recognized for his best-selling book Trade Your Way to Financial Fre-edom and his outstanding Peak Performance Home Study program - a highly regarded classic that is suitable for all levels of traders and investors. You can learn more about Van Tharp at www.iitm.com.
Proven Swing Trading Strategies
Offered only once each year!
December 1-3, Phoenix, AZ
Presented by D.R. Barton and Brad Martin
Discover
15 Simple Secrets of Swing Trading Success-
Secrets That Can Help
You Maximize Your Profits.
A
Review of Market Models:
Steidlmayer�s
Market Profile
by
D.R. Barton, Jr.
We�re going to spend a few articles together delving into the truly interesting world of J. Peter Steidlmayer�s Market Profile tool.
For those not familiar with Market Profile, it is characterized as �a dynamic technical tool that organizes price, time, and volume into powerful trading structures based on the bell curve� in the CBOT�s literature.
A typical market profile would look like this the following chart.
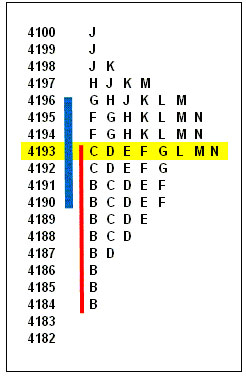
Each letter represents a time frame (30 minutes is the default) and a letter is printed at each price traded during that 30 minute period. Most days, prices align themselves in a bell curve, giving us useful information about buying and selling pressures.
In weeks to come, we�ll look at some key concepts that are derived from the Market Profile charts and how many professional traders use this information.
But for today, let�s look at Market Profile using our �market model� rubric:
Is it theoretically credible? Very much so. The theory of making a statistically interpretable diagram of how the markets have moved during a certain time period is very sound.
Who�s it most useful for? Mostly shorter term traders (day and swing traders). While there are some longer terms uses, most traders and investors use market profile to understand intra-day market activity; this information is also very useful for swing traders.
How Fanatic are the fans? Moderately. While Market profile fans tend to be very dedicated, they�re not overly excited about winning converts. They just use it to make money.
Is it being used by real-life traders? Indeed. Though I don�t know personally anyone who uses it on a stand-alone basis, I know plenty of traders who use Market Profile on a daily basis.
Great Trading!
D. R. Barton, Jr. is the Chief Operating Officer and Risk Manager for the Directional Research and Trading hedge fund group. D. R. has been actively involved in trading, researching, and teaching in the markets since 1986. D. R. has taught extensively in many investment areas including intra-day trading, swing trading, and cutting edge risk management techniques.
His writing credits include co-authoring Safe Strategies for Fin-ancial Fre-edom and co-creator and contributing author on Fin-ancial Fre-edom Through Electronic Day Trading.
D.R. presents the IITM Proven Strategies Swing Trading Workshop and Professional Tactics for Day Traders Workshop. Each workshop is only held once each year.
Three in One Workshop Package
We want you to win in the markets, so if you are really serious about taking your trading to the next level, we are offering a time-limited Three in One Package to Van Tharp's foundation workshops. You will be paying LESS THAN HALF price for each workshop.
Buy any two of the Foundation Workshops, and you can attend the third one absolutely FREE.
You have 2 years to attend the workshops and some of them will be scheduled back- to- back to help with travel arrangements.
Positive Expectancy on Life
By Melita Hunt
Do you have a positive expectancy on life? And what do you really expect from your trading?
We throw the term positive expectancy around a lot here at the Van Tharp Institute in the context of trading; however, it can also be used to refer to life in general. I would expect that traders, who focus on success, would have a much better chance of achieving success than those who primarily focus on their failures. Sure it�s important to learn from our mistakes; however, take a moment to consider where your attention is focused most of the time. Do you expect to win in the long run or is failure in the markets lurking just around the corner? Then take a look at the other five areas in your life: 1) Personal 2) Health 3) Financial 4) Job 5) Family. Do you have a positive or negative expectancy about each one of these areas? You may be surprised at your answers.
And if you do have a negative expectancy � what do you plan on doing to shift the odds in your favor?
Join in the discussions on our blog and forum
Do Not Reply to this email using the reply button as the email address is not monitored, your email will not be seen. Please click this link to contact us: [email protected]
The Van Tharp Institute does not support spamming in any way, shape or form. This is a subscription based newsletter.
If you no longer wish to subscribe, Unsubscribe Here
Or, paste this address in your browser: http://www.iitm.com/privacy_policy.htm
The Van Tharp Institute
102-A Commonwealth Court, Cary, NC 27511 USA
800-385-4486 * 919-466-0043 * Fax 919-466-0408
Copyright 2006 the International Institute of Trading Mastery, Inc.