Tharp�s Thoughts
Market Update for Period Ending October 31, 2006
1-2-3 Model Still in Red Light Mode
By
Van K. Tharp
Look for these monthly updates on the first issue of each month. This allows us to get the closing month�s data. In these updates, we�ll be covering each of the major models mentioned in the Safe Strategies book: 1) the 1-2-3 stock market model; 2) the five week status on each of the major stock U.S. stock market indices; 3) our new four star inflation deflation model; and we�ll be 4) tracking the dollar.
Part I: Market Commentary.
In the September edition, I raised the possibility that we are in a recession because the economy only expanded by 2.9% in the 2nd quarter, while the CPI was running at 4.1%. Since that time, commodity prices have shrunk dramatically and the Dow Jones actually has hit new all time highs. Does that mean that I was wrong? Does that mean that we are no longer in a secular bear market? In my opinion, the answer to both is a resounding �NO�.
First, let�s talk about the economy: Two things are going on. First, we still have a fair amount of inflation. Our government has not stopped the printing press by any means.
Second, we also have a tremendous amount of debt. When you count future entitlements, according to a report issued by the St. Louis, Federal Reserve, our debt now stands at $67 trillion. If we pay 5% on that debt, then the cost to service it is about $3.7 trillion. In 2005, the GDP of the United States was $12.5 trillion. This means that it costs over 25% of the GDP just to service our debt. I doubt that our economy has ever grown at a rate of over 25% per year, but that�s what it must grow just to stay even. So we are having serious difficulty. Of course, much of our debt is owned by Social Security and is never paid. The entitlement of Social Security just continues to get bigger and bigger and, in my opinion, will one day be defaulted upon by our government.
Third, the government doesn�t ever want you to know this and it certainly doesn�t want you to know about inflation, especially before the November elections. And our government does have the means to make the economy look better than it really is before an election. However, after the election, I�d expect the real numbers to come to light and for the markets to react appropriately.
Next, let�s talk about the market making new highs. During the bear market crash, the Dow Jones Industrials and the S&P 500 never retreated that much, because most mutual funds were invested in them and they never sold them off. They were quite happy to let their funds drop 20% or more during the market decline because that is what the major averages did.
Well, money is still pouring into pension funds (and thus mutual funds) and being invested in those two indices. Consequently, it is not surprising that the DOW is making new highs. But, ask yourself, what will happen when baby boomers start a net redemption of the retirement funds. It won�t be pretty for the mutual funds or the major averages that they use as benchmarks.
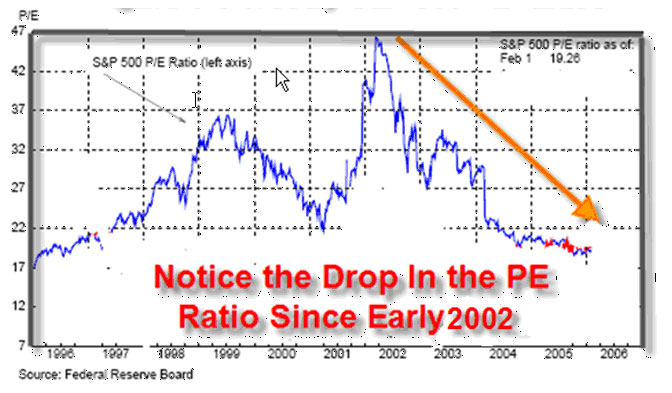
Lastly, let me remind you that a secular bear market simply means that over the long term I expect valuations (i.e., PE ratios) to go down. Here�s a chart of PE ratios since the secular bear market began. And I don�t expect this secular bear to be over until the PE ratio of stocks in the S&P 500 reach the single digit mark. Note that if inflation drove the dollar to be worth 10 cents over the next ten years, then we could easily see a Dow Jones Industrials at 50,000. However, it would still be worth less in today�s dollar than it is now and by that time we might have single digit PE ratios.
Also, if this occurs, then our 1-2-3 model would be fairly useless even though it�s only designed to suggest what stocks might do over the next 12 months.
While I cannot predict this, it�s quite possible that after the elections our government will release figures that are much worse than the figures we�ve seen previously about the economy. And if that is the case, we could easily see a large decline in the stock market in November. Am I predicting this? No, I have no idea what will happen. But I would be very cautious about your market positions over the next two months.
Part II: The 1-2-3 Stock Market Model IS IN RED LIGHT MODE
The Fed has stopped tightening, so are we still in Red Light Mode?
The answer is �yes.� If the Fed doesn�t tighten again for six months (i.e., several more months yet), then a second signal will change and we�ll be in Green Light Mode. But remember that the PE ratio is still around 19 and perhaps even higher with the market run up. And we won�t know that data until 3rd quarter earnings for the S&P 500 are out.
Let�s look at what the market has done over the last five weeks and compare that with where the averages were December 31st last year. This is given in the next table. Incidentally, this data is calculated by hand based upon last Friday�s close (i.e., October 27th, 2006), so there is always a possibility of human error in our numbers.
Weekly Changes in the
Major Stock Market Indices
|
||||||
|
Date Week
Ending |
DOW
30 |
% Change |
SP500 |
Change |
NAS
100 (NDX) |
%
Change |
|
12/31/04 |
10,783.01 |
|
1211.12 |
|
1621.12 |
|
|
12/30/05 |
10,717.50 |
-0.6% |
1248.29 |
+3.1% |
1645.20 |
+1.5% |
|
|
|
|
|
|
|
|
|
9/29/06 |
11,718.05 |
|
1339.25 |
|
1666.03 |
|
|
10/06/06 |
11,865.49 |
+1.3% |
1353.22 |
1.0% |
1682.42 |
1.0% |
|
10/13/06 |
11,947.22 |
+0.7% |
1362.82 |
.71% |
1717.39 |
+2.1% |
|
10/20/06 |
12,013.01 |
+0.6% |
1366.94 |
+0.3% |
1706.37 |
-0.6% |
|
10/27/06 |
12,164.78 |
1.3% |
1388.89 |
1.6% |
1740.00 |
+2.0% |
Efficient stocks. What�s the market telling me in terms of efficiency? On October 10th the market was 64.3% positive efficient. That is 64.3% of the stocks I track (over 4000) showed positive efficiency scores. I�m beginning to think that extreme efficiency scores might be a contrary indicator. But we�ll need 4-5 years of data before we know that.
Part III: Our Four Star Inflation-Deflation Model
I now strongly believe that we are in an inflationary bear market and that our inflation rate is simply masked by government statistics.
So far our models have been telling us, that inflation/deflation is pretty steady, with a slight inflationary bias and that�s where secular bear markets tend to start.
So what�s our new indicator telling us about inflation?
1) The CRB Index
2) The Basic Materials Sector (XLB)
3) The London Price of Gold and
4) The Financial Sector (XLF)
Since the description of the model we�re now using is not in any of my books, I�ll continue to give it here.
1) The CRB Index. I believe that the CRB index is the one we have currently that is the least manipulated by the government. But what�s the best way to measure it? For consistency, I plan to give two measurements.
� Is the CRB index higher than it was six months ago? If it is, we are on track for inflation.
� Is the CRB index higher than it was two months ago?
Now there are several ways to monitor these two indices.
� If both differences are higher, we�ll count one star for inflation.
� If the six-month change is higher, but the two-month change is not, then we will only count � star for inflation.
� And if both the two and six month changes are lower, then we�ll be minus one for inflation.
� However, if the six-month change is lower, while the two-month change is higher, then we�ll be minus � star for inflation. Obviously, the two minus scores will point to deflation.
2) The Basic Materials Sector ETF (XLB). In an inflationary environment, basic materials will definitely go up and this sector, to the best of my knowledge, is not manipulated by the government. Thus, we will used this sector to monitor inflation and we�ll use the same measurements use for the CRB. (1) Is the XLB higher than it was six months ago? (2) Is the XLB higher than it was two months ago? These two measurements give us four possible results.
� If both differences are higher, we�ll count one star for inflation.
� If the six-month change is higher, but the two-month change is not, then we will only count � star for inflation.
� And if both the two and six month changes are lower, then we�ll be minus one for inflation.
� However, if the six-month change is lower, while the two-month change is higher, then we�ll be minus � star for inflation. Obviously, the two minus scores will point to deflation.
3) The London PM Gold price at the end of each month. Although the government can manipulate Gold, I still like to look at monthly gold prices. However, to be consistent, we�ll use the same two measurements that we�ve used for the other indices that we are monitoring. (1) Is the price higher than it was six months ago? (2) Is the price higher than it was two months ago? Again, these two measurements give us four possible results.
� If both differences are higher, we�ll count one star for inflation.
� If the six-month change is higher, but the two-month change is not, then we will only count � star for inflation.
� And if both the two and six-month changes are lower, then we�ll be minus one for inflation.
� However, if the six-month change is lower, while the two-month change is higher, then we�ll be minus � star for inflation. Obviously, the two minus scores will point to deflation.
4) The Fourth Measurement we�ll use is related to the Financial Sector of the S&P 500.
The financial sector (XLF) tends to do well when we have deflation and poorly when we have inflation. Martin Pring, in fact, has used an index in which he divides the XLB by the XLF. Since we already use the XLB, we�ll use the XLF by itself as well. Again, we�ll use the change over six months and over two months. However, the four possible outcomes with give us a different interpretation.
� If both differences are higher, we�ll count one star for deflation (i.e., minus one for inflation).
� If the six-month change is higher, but the two-month change is not, then we will only count � star for deflation (i.e., minus � for inflation). And if both the two and six month changes are lower, then we�ll be plus one for inflation.
� However, if the six-month change is lower, while the two-month change is higher, then we�ll be plus � star for inflation. Obviously, the two minus scores will point to strong inflation.
Okay, so now let�s look at the results for the last six months.
|
Date |
CRB |
XLB |
Gold |
XLF |
|
November
30th |
332.49 |
29.67 |
495.85 |
31.87 |
|
December
30th |
347.89 |
30.28 |
513.00 |
31.67 |
|
January
31st |
363.30 |
31.74 |
568.25 |
31.95 |
|
February
28th |
353.27 |
31.06 |
556.00 |
32.63 |
|
March 30th |
364.70 |
32.35 |
582.00 |
32.55 |
|
April 28th |
379.53 |
33.50 |
644.00 |
33.96 |
|
May 31st |
385.65
(6/2) |
31.95 |
653.00 |
32.56 |
|
June 30th |
385.63 |
32.10 |
613.50 |
32.34 |
|
July 31st |
391.49 |
30.90 |
632.50 |
33.08 |
|
August 31st |
390.95 |
32.19 |
623.50 |
33.52 |
|
September
30th |
|
31.82 |
599.25 |
34.62 |
|
October
31st |
383.92 |
33.33 |
603.75 |
35.43 |
We�ll now look at the two-month and six-month changes during 2006, to see what our readings have been.
|
Date |
CRB2 |
CRB6 |
XLB2 |
XLB6 |
Gold2 |
Gold6 |
XLF2 |
XLF6 |
Total
Score |
|
October |
Lower |
Higher |
Higher |
Lower |
Lower |
Lower |
Higher |
Higher |
|
|
|
|
+1/2 |
|
-1/2 |
|
-1 |
|
-1 |
-2.0 |
The results of this model are much more sensitive (I believe) than the model I presented in Safe Strategies for Financial Freedom.
The model is only showing the second month, since I�ve been tracking it, in which deflation seems to be winning. (Incidentally, I was in Australia on September 30th and was unable to get the CRB cash price. If you know what it was on that data, I�d be delighted to hear from you.
Part IV: Tracking the Dollar
The U.S. dollar is still looking weak, although it�s relatively flat for the year and at a fairly low rate. This is another reason that the Federal Reserve needs to continue to raise rates. When interest rates are high, people are attracted to the dollar. But when rates are falling, they will dump it quickly. The IMF has already said that the dollar, at current rates, is 35% overvalued. Can you imagine the impact of the dollar falling another 35%.
|
The Dollar Index |
|
|
Month |
Dollar Index |
|
Jan 05 |
81.06 |
|
Jan 06 |
84.45 |
|
Feb 06 |
85.26 |
|
Mar 06 |
85.17 |
|
Apr 06 |
84.05 |
|
May 06 |
80.78 |
|
June 06 |
81.66 |
|
July 06 |
81.32 |
|
Aug 06 |
82.09 |
|
Sep 06 |
81.33 |
|
Oct 06 |
81.75 |
Incidentally, notice what I said above two months ago. Basically, the Fed has not raised rates, but the dollar is only a little weaker than it was in August. Our dollar has remained relatively flat for the past four months. Considering that I went overseas, it�s amazing that the dollar didn�t fall. It usually does when I�m overseas. (Editors note: Melita says it was because she was traveling with him this time J )
Watch for my portfolio update which is coming out soon. Until next time, this is Van Tharp.
About Van Tharp: Trading coach, and author Dr. Van K. Tharp, is widely recognized for his best-selling book Trade Your Way to Financial Fre-edom and his outstanding Peak Performance Home Study program - a highly regarded classic that is suitable for all levels of traders and investors. You can learn more about Van Tharp at www.iitm.com.
$500 Discount Expires Soon
Proven Swing Trading Strategies
December 1-3, Phoenix, AZ
Presented by D.R. Barton and Brad Martin
Swing trading methodology offers you the convenience of planning your trades and making your preparations at a time that fits your own busy lifestyle, while at the same time offering enough trading opportunities to allow for profitable returns.
Learn all the proven "insider" trading secrets that work in any market condition - directly from experienced professional trader, Brad Martin.
D.R. Barton will show you the best ways to create a technically sound trading system to maximize your profits...how to use the most important secret of swing trading...and key psychological factors that affect traders (just one of these secrets alone could be the "missing link" in your own trading).
Discover 15 Simple Secrets of Swing Trading Success-Secrets That Can Help You Maximize Your Profits. Learn more...
Re-invest Your Investment Returns
By John R. Burley
We�ve all heard the saying that we should �pay ourselves first�. However, there is a very important second step that should be adhered to as well. To ensure that the money that we save or make from our trading continues to work for us, we must be willing to reinvest our investment returns. This step is critical to your long-term financial success.
Many investors and traders start out on a good path. They set up a savings plan and watch their account grow until they have enough capital to start trading. Everything is working exactly like it should. Then it all stops working because they sabotage the entire program by �stealing� the earnings to consume and spend. Or they stop the flow from other sources of income and use their trading money to support their lifestyle. By prematurely spending these earnings, you take away the power of compounding your trading gains and send yourself right back to being a beginner in the investing world.
Am I saying you�ll never spend the money? Of course not, I�m just saying you need to look at this from a long-term point of view. Putting aside money for a couple of years will not change your life. However, filling the bucket until the earnings can comfortably support your lifestyle will. This is why it is critical that you follow the money habit Reinvest Your Investment Returns.
The exciting thing about applying this money habit is that it will allow you to retire early and rich with almost no effort. All you have to do is let your money fulfill the only purpose money has, which is to make more money. That�s right, all money knows how to do is make more money if you let it. So leave your money alone and let it have children (more money). Then let its children have more children, and so on and so on and so on. That�s all money knows how to do, so continue to re-invest your returns and resist the desire to spend the money or to dig into your capital, until you are really ready to live off the earnings.
In simple words, leave your money alone until you are ready to live off the fruits of its labor. Avoid the temptation to tap the money for consumption purposes. If you do, you will never get to where it is that you want to go financially.
To learn more about the John Burley and his �Money Secrets and Habits� � Join him at a live two day event in Phoenix, Arizona this month (Nov 18 and 19). Go to http://johnburley.com/events.html for more information - and mention the Van Tharp Institute to secure an additional $100.00 off the enrollment price.
Recommendations on System or
Newsletter to use
Author: sully
I've read "Trade Your Way" and "Safe Strategies" as well as listening to one of Van's audio series. So I am familiar with trading systems, etc. I am quite familiar with the "Turtle" trading system.
I see tremendous value in taking Van's coursework, but since I'm a "part time" trader, it seems like a wise choice to purchase a trading system or find a newsletter (like van suggests) - instead of taking the time to attend the course and develop a system from scratch.
I'm looking at a few strategies - then it occurred to me that there were many great minds on this forum and that I'd profit from some of your suggestions.
Do any of you have any systems or newsletters that you can suggest I look at ?
Re: Recommendations on system or newsletter to use
Author: PMK
Unless you develop your own system using your own beliefs, your own objectives, and your own requirements for return, drawdown, available time, market selection and level of automation you will find it difficult to have enough confidence in your trading methods to consistently stick to them through the inevitable losing periods.
My advice: take the courses - even if someone could give you a great recommendation for an excellent system or newsletter you would not be in a position to benefit from it unless you have the skills to evaluate it properly and adapt it to your specific requirements.
Hope this helps
Paul King
Re: Recommendations on system or newsletter to use
Author: Mark
As you've probably already discovered if you're honest with yourself, the answers aren't tangible--no specific newsletter, black box system, or "secrets" will pop up to provide the Holy Grail.
On the contrary, the most difficult thing to acknowledge, accept, embrace, and FINALLY capitalize on is that this industry has very little to do with someone else's ideas and has everything to do with your concept of reality.
On the downside, this means that following someone else's recommendations, no matter the track record, will bring to you at best some shortcomings and at worst catastrophic loss.
On the upside, this means having a profitable record without truly understanding why or how.
You are looking for a quick solution, an "insider secret" if you will to making your fortunes in the trading business. Do you think with any seriousness that minimal risk equals major fortune? The best approach you can take to trading is to assume it is like any other endeavor: that is research, hard work, creativity, and investment will over the long term result in profitable gains.
Please don't think I take this lightly--I made my money in a different profession and had to learn the hard way. Tuition in my original industry cost me $150,000 to learn how to make money and then after 5 years of experience I made $5000 a day. Now, I spent 3 times that much in the tuition of learning to trade and only after a much larger investment now I make 5000 to 50000. You have to have it to invest to make it.
So there is no secret, just your own desires to accomplish, overcome, adjust, and take the long road.
Yes there are great riches in trading but it takes an equal sweat investment to realistically see that reality. The best trading advice I can give you is to take Van Tharp's Peak Performance Course. If you approach it seriously it will change your life--it did for me.
Good luck,
Mark
Join
in on the forum where students of Van Tharp's discuss trading.
Also join in the discussions on our
Van Tharp's Peak Performance Home Study Course
The
Ultimate Home Study Course for Traders. 
Contains the five books listed above, and four CDs. �Your course is the most powerful material I have
ever come across on trading. It is challenging and
therapeutic for those who want to be better traders and
less neurotic in their personalities.�
�J.M. |
Do Not Reply to this email using the reply button as the email address is not monitored, your email will not be seen. Please click this link to contact us: [email protected]
The Van Tharp Institute does not support spamming in any way, shape or form. This is a subscription based newsletter.
If you no longer wish to subscribe, Unsubscribe Here
Or, paste this address in your browser: http://www.iitm.com/privacy_policy.htm
The Van Tharp Institute
102-A Commonwealth Court, Cary, NC 27511 USA
800-385-4486 * 919-466-0043 * Fax 919-466-0408
Copyright 2006 the International Institute of Trading Mastery, Inc.