|
Raleigh, NC Course Starts Next Week, August 25-26-27
|
September 27-28-29
Scheduled
Back-to-Back with
|
|
September 16-18, 2006 - Raleigh, NC Presented by: D.R. Barton and Brad Martin |
|
Market Efficiency Portfolio
One Month Later
By
Van K. Tharp
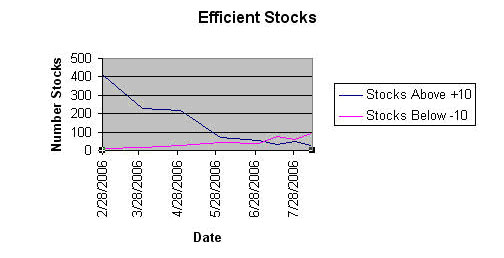
Efficiencies have continued their downward trend since we started the portfolio. In February this year the market was amazingly strong in terms of efficiency. We had 406 stocks with ratings above plus 10 and only 11 stocks with rating below minus 10. It was very hard to find a good short candidate. Now look at the chart below and you�ll see how things have changed. As of August 11, there were 91 stocks with efficiencies below minus 10 and only 26 stocks with efficiencies above plus 10.
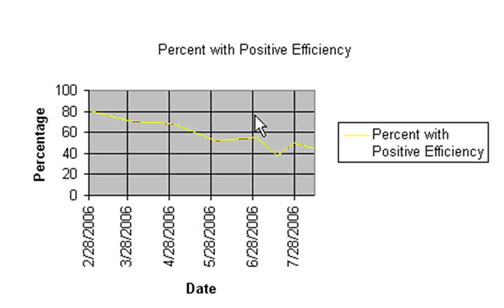
There is another way to measure the efficiency of the market: the percentage of stocks have an efficiency rating above zero? This information has been charted in the second figure. In February of this year, 80% of all stocks showed a positive efficiency. As of August 11th, only 45.5% of the market was positive. While this is not as low at the rating when we started, we�re still in a clear downtrend.
One of the great things about this sort of live testing of a system is that within a month or two you will answer a lot of questions about your system or at least come up with a lot of issues that you�ll need to address. After one month of trading this system, that is true for us as well.
The primary thing that is clear to me about this trading system is that it is much too active for what I intended. I was concerned that 10% stops would be too active, but I also assumed that at least half the portfolio would take off and the 25% trailing stops would then take effect. That has not occurred in this sort of choppy market. We only have one stock for which the trailing stop is now in effect.
First, we were stopped out of two stocks about two weeks ago. In addition I made some discretionary changes to the portfolio two weeks ago. That�s a 40% change in the portfolio. And now we�re about to be stopped out of at least one more stock if we keep the old stop.
As a result, we are making some simple rule changes. First, because the portfolio is too active, we are going to double the size of our stops to 20%. This means that all of our initial positions will have 2% risk, which means we have 20% portfolio heat. That might be too much, but our portfolio consists of both long and short positions so it�s very unlikely that a large market move would stop us out of everything. It might stop us out of one side of the market, but we�d be making large gains on the other side to offset that. Right now we have three long positions and seven shorts. That basically means the portfolio is net short four positions. Thus, our portfolio heat (total risk in the portfolio) is more like 6%.
In addition, if we moved to 20% stops with 1% risk, that would give us as many as 20 positions. And in today�s market I could probably find 14 short positions I like (70%) but I�d be hard pressed to find even six long positions that I like (30%). Thus, we�ll use wide stops and make the initial risk 2%.
Secondly, I said I�d look at the efficiency of the market every two weeks and make the appropriate changes. Well, in my opinion, that also makes the portfolio too active and has me making too many discretionary changes to the portfolio. Thus, I�ll only be making mid-month decisions about market efficiency.
With those changes in mind, let�s look at our portfolio.
The Portfolio
The portfolio was purchased (most of it shorted) at about 1:30 PM EDT on July 16th, 2006. Since that time, we�ve been stopped out of two of our short stocks, BSX and DLX.
Remember that we made decisions about the portfolio two weeks ago, based upon the following rules:
- When we get stopped out of a stock, we will replace it with the strongest (weakest, if short) stock on the same side of the market. This will be done the following Monday. This rule remains the same, only our stops have increase to 20%.
- Every two weeks, we will assess the market. If it calls for us to move to a different allocation (i.e., long or short), we will sell off the weakest stock in order for us to do so. This has now changed back to once each month during the middle of the month.
- Once each month (around the 15th) we will look at the market to determine if there is a better short (or long) than any of the stocks in the portfolio. This will be a purely discretionary call. When such a stock is found, it will replace the weakest stock on that side of the market. This rule has not changed.
Because of these old rules, I made several discretionary changes to the portfolio two weeks ago. First, I deleted FAL from the portfolio. It was a takeover candidate with two bidders, but when one bidder dropped out and the price was at about the takeover price, I decided that it was pointless to continue to hold the stock. In addition, at the same time, I elected to go to 40% long and I deleted the worst performing short stock at the time at a slight loss. That turned out to be a mistake. The stock I eliminated was SCT. And within a few days of eliminating it, the stock plunged to as low as $3.50. That�s what you get sometimes when you make discretionary decisions. It would have been a home run within the first month of our portfolio, but unfortunately we don�t get to count it. We�d have been stopped out when the stock climbed above $4.00 again.
This month the market looked much worse and suggested that move down to 30% long. We were close to a stopped exit on AETH, so I�ve elected to get out of that stock. I actually owned that position and I got out at $5.65, so that�s the price I used for an exit in the portfolio. I replaced that stock with the best looking negative efficiency stock. In this case, the price is below 10, but stocks below 10 could easily go to zero. Thus, we have shorted JRC as well. At the time I exited AETH, I could have shorted JRC at $7.15, so that�s the price I used.
Here�s what our exited stocks look like. The sale price is in red, which for the short sales occurred first. The R-multiple now assumes a 20% initial stop, rather than a 10%.
Remember that SCT, FAL, and AETH were discretionary exits. SCT closed on the 15th of August under $7, so we would have had a huge profit if we were still in it. BSX and DLX were stocks that we were stopped out of, DLX may have started an uptrend, but I would not be that unhappy to still be in BSX.
|
Stock |
Entry |
Cost |
Share |
Exit
Price |
Exit
Cost |
Loss |
R-Multiple |
|
SCT |
$15.70
|
$1,978.20
|
126 |
$16.00
|
$2,031.00
|
($53) |
(0.132) |
|
FAL |
$54.25
|
$1,968.00
|
36 |
$55.02
|
$1,965.72
|
($2.28) |
(0.006) |
|
BSX |
$15.74
|
$1,983.24
|
126 |
$17.31
|
$2,166.06
|
($183) |
(0.470) |
|
DLX |
$14.55
|
$1,978.80
|
136 |
$16.01
|
$2,162.36
|
($184) |
(0.459) |
|
AETH |
$6.05
|
$2,011.50
|
330 |
$5.65
|
$1,879.50
|
($132) |
(0.330) |
|
|
|
|
|
|
|
($554) |
(0.277) |
Now let�s look at our current portfolio. This is shown in the next table. We have three long positions AYE, CG, and OGE and all together the long positions show a slight profit. We also have seven short positions. JCCC hit a low on Aug 15 of 14.69. If we take a 25% trailing stop from that point, then our new stop is $18.36. This is closer than our original 20% stop, so it is now the new stop for this stock. Notice that we already have better than a 1.6R profit in this stock.
Overall our total profit in the active portfolio is not quite as big as our total losses. Thus, after our first month we are down about $7. Without my discretionary exit on SCT, however, the portfolio would be up about $1000 or 5%.
|
Efficiency
Portfolio as of the Close August 15, 2006 |
||||||||
|
Stock |
Entry |
Cost |
Shares |
Stop |
Price |
Value |
Profit |
R-multiple |
|
Now |
Loss |
|||||||
|
Longs |
|
|
|
|
|
|
|
|
|
AYE |
40.55 |
$2,001.95
|
49 |
$32.44
|
$42.16
|
$2,065.84
|
$63.89
|
0.160
|
|
CG |
58.21 |
$1,994.14
|
34 |
$46.57
|
$60.57
|
$2,059.38
|
$65.24
|
0.163
|
|
OGE |
$35.97
|
$1,957.38
|
54 |
$28.78
|
$35.47
|
$1,915.38
|
($42.00) |
(0.105) |
|
Shorts |
|
|
|
|
|
|
|
|
|
PFCB |
$33.90
|
$1,966.20
|
58 |
$40.68
|
$35.24
|
$2,043.92
|
($92.72) |
(0.232) |
|
LEE |
$26.29
|
$1,998.04
|
76 |
$31.55
|
$24.77
|
$1,882.52
|
$100.52
|
0.251
|
|
WPI |
$22.61
|
$1,989.68
|
88 |
$27.13
|
$24.65
|
$2,169.20
|
($194.52) |
(0.486) |
|
JRCC |
$22.06
|
$1,985.40
|
90 |
$18.36
|
$14.77
|
$1,329.30
|
$641.10
|
1.603
|
|
EBAY |
$24.22
|
$1,971.04
|
82 |
$29.06
|
$24.93
|
$2,044.26
|
($88.22) |
(0.221) |
|
HOV |
$27.33
|
$1,980.09
|
73 |
$32.80
|
$25.82
|
$1,884.86
|
$80.23
|
0.201
|
|
JRC |
$7.15
|
$2,002.70
|
278 |
$8.58
|
$7.10
|
$1,973.80
|
$13.90
|
0.035
|
|
|
|
|
|
|
|
|
$547.42
|
0.1369
|
Questions
I had numerous comments on the portfolio such as:
Q Why don�t you consider stocks below $5 for shorting?
When there are literally dozens of candidates, it seemed to me that a higher priced stock can fall a lot more. As a result, I actually used price to pick some of my initial short candidates, choosing the higher priced ones. That may have been a mistake. I think the smoothest down slopes may be my primary criteria right now. That�s why I selected JRC as the most recent short.
Q What was the $26 in the portfolio?
After I calculated the cost of all the stocks plus a $15 commission, it left $26. However, that was slightly misleading since we got cash for the shorts. Therefore, I'm not showing the $26 anymore. Overall I plan to keep track of the value of the portfolio plus the value of the closed trades to see how we are doing. For example, right now our closed trades lost $554 (rounded) and our open profit on the portfolio is $547 (rounded). Thus, we have a net loss of about $7.
Q Why are you using a single position size?
I don�t understand the logic of your question. I usually advocate for simplicity that people risk no more than 1% of their portfolio on each position. That�s what we are doing here. We�ve since upped that to 2%, but I think we can tolerate the increased portfolio heat since the portfolio combines both long and short positions.
About Van Tharp: Trading coach, and author Dr. Van K Tharp, is widely recognized for his best-selling book Trade Your Way to Financial Fre-edom and his outstanding Peak Performance Home Study program - a highly regarded classic that is suitable for all levels of traders and investors. You can learn more about Van Tharp at www.iitm.com.
|
To increase your chances of success and to be super effective as a trader, trading should be treated as a business. This applies to full time professionals as well as the long term investor who does not trade with frequency. Either way, the mind-set of operating your trading activities as a business rather than as a hobby is very useful and creates positive results. Business
Planning For Traders and Investors ---------------- Learn the tools and techniques that you need to transform your trading and investing results. Make bigger, more consistent profits with less stress. Covering discipline, mental state control, how to fix mistakes, two tasks of trading--rehearsal and daily debrief, games people play, self-sabotage, goal setting and personality type and trading. Psychology
of Trading Series |
A Review of Market Models: Day Trading Strategies
by D. R. Barton, Jr.
**Special Note � please see the shameless plug for my upcoming Day Trading course at the end of this commentary! And now back to your regularly scheduled article�
Day trading (or intraday trading) has one huge and undeniable advantage over every other trading time frame: Reduced Risk.
The bottom line is this � position traders and even swing traders must deal with overnight risk. This shows up in those unavoidable gaps that happen between the closing price and opening price every day. Usually these gaps are small; but sometimes these gaps are very big, thanks to news or market moves, etc. And there�s very little protection against such gaps. Traders and investors just have to make sure that stops are wide enough to stay outside of the �market noise� and reduce their position size accordingly.
Intraday traders don�t have to deal with this overnight risk. This allows them to use tighter stops and therefore larger position size. We�ve all heard stories of people blowing out their accounts while intraday trading. This comes from abusing larger position sizes and a combination of poor trading strategies and bad discipline.
Successful day traders capture the advantages of increased position sizes by using strategies with positive expectancies and applying good discipline to higher frequency trades.
There are many elements that are required to day trade well: good trading psychology, execution skills, a decisive nature. But proven trading strategies make all of this much easier. Let�s get an overview of some of the strategies being used by day traders today and then we�ll dig into them in more depth over the next couple of weeks.
Day Trading Strategies � An Overview
Gap Trading: One of my personal favorites - this is a combination of strategies that allow traders to fade the gap (or go against the direction of the gap) or go with the gap depending on other market indicators. Since gaps occur every day, this is a very useful and consistent strategy.
Trend Continuation Strategies: After a trend has started have you ever wondered how to climb into a trade in the direction of the trend without being the last buyer in an uptrend or the last seller in a downtrend? There are many patterns and indicators that are useful for catching a trend during a pause or a pullback.
Key Numbers Trading (Support and Resistance Levels): This is a trading style used by many top day traders. Key numbers are generated based on a variety of indicators and historical data. Key levels are then used to go short or long based on current market conditions. This is one of the most powerful methods around and has stood the test of time across many market conditions.
Breakout trading: There are many methods for trading breakouts. During the 1998 � 2000 internet-driven bull market, tons of people were doing nothing but trading intraday breakouts. While best used in directional markets, this is still a useful trading style.
Momentum trading: This differs from breakout trading in that one can enter on a change in momentum or a momentum �pop� at any price level. Another useful method if you have a good momentum indicator set that you trust.
While there are lots of other good trading strategies, most fall under these categories. And these are all used in trading stocks, futures and currencies.
**This is our only Day Trading Workshop of the year! If you have any interest in day trading, you can�t miss the three-day workshop that I will be leading with my good friend and great trader, Brad Martin. Brad was a floor trader in Chicago for 14 years and made the transition to electronic trading with incredible results. Join us in Cary, NC, September 16 � 18 to learn complete trading systems that work, along with insights in how to deal with the key issues that day traders face every trading day. We�ll be covering stocks and futures in this course, so be sure to join us. Learn More...
Great Trading!
D. R. Barton, Jr. is the Chief Operating Officer and Risk Manager for the Directional Research and Trading hedge fund group. D. R. has been actively involved in trading, researching, and teaching in the markets since 1986. D. R. has taught extensively in many investment areas including intra-day trading, swing trading, and cutting edge risk management techniques.
His writing credits include co-authoring Safe Strategies for Fin-ancial Fre-edom and co-creator and contributing author on Fin-ancial Fre-edom Through Electronic Day Trading.
D.R. presents the IITM Swing Trading Workshop and Professional Tactics for Day Traders Workshop. Each workshop is only held once each year.
Special Reports By Van Tharp
Market Mastery Reports - Downloadable
$39.95 each
[Regularly $59.95]
BUY ALL 4 Reports for $129.00!
Click on any title below to read an excerpt
VAN THARP HAS A NEW BLOG: www.SmartTraderBlog.com
and
Do Not Reply to this email using the reply button as the email address is not monitored, your email will not be seen. Please click this link to contact us: [email protected]
The Van Tharp Institute does not support spamming in any way, shape or form. This is a subscription based newsletter.
If you no longer wish to subscribe, Unsubscribe Here
Or, paste this address in your browser: http://www.iitm.com/privacy_policy.htm
The Van Tharp Institute
102-A Commonwealth Court, Cary, NC 27511 USA
800-385-4486 * 919-466-0043 * Fax 919-466-0408
Copyright 2006 the International Institute of Trading Mastery, Inc.