How to Develop a Winning Trading System - Workshops
New Location! SYDNEY AUSTRALIA
|
Raleigh, NC, USA August 25-26-27
|
Sydney, Australia September 27-28-29 Scheduled
Back-to-Back with
|
You cannot Improve your trading performance through some indicator that predicts the market. You must learn the art of trading and understand how to create a trading system that fits your wants, needs, desires and lifestyle.
Tharp�s Thoughts
Market Efficiency Portfolio
The First Look
By
Van K. Tharp
I suspect a lot of people have been losing money in the market. We�re starting this model portfolio in what appears to be the second major downleg of our secular bull market. It is ironic because I first started tracking the efficiency model in my Market Mastery newsletter, during the first downleg of the bear market. At that time, we were only purchasing long stocks. And I gave up on the project in the fall of 2002 because there were no positive efficiency stocks above 10 � None. And that was about the bottom of the market.
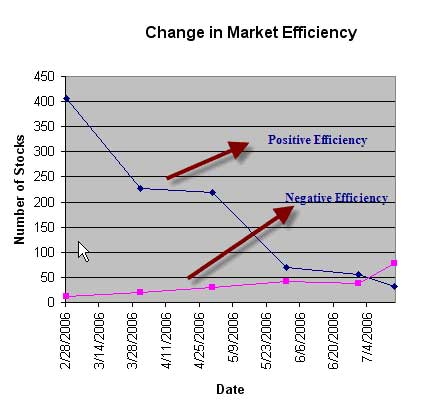
Well, in February this year the market was amazingly strong in terms of efficiency. We have 406 stocks with ratings above 10 and only 11 stocks with rating below minus 10. It was very hard to find a good shorting candidate. Now look at the chart above and you�ll see how things have changed.
Today, there are 77 stocks with efficiencies below minus 10 and only 31 with efficiencies above plus 10. As you can see in the chart, the market has clearly changed .
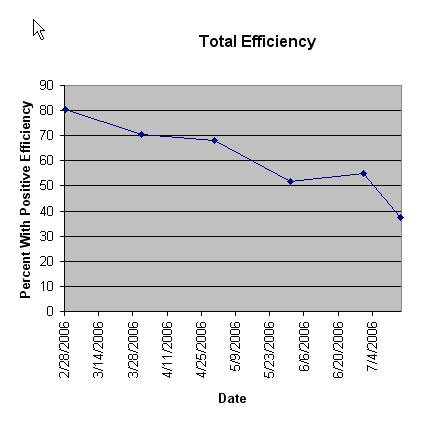
There is another way to measure it: What percentage of stocks have an efficiency rating above zero? I�ve charted that in the second figure and the results look similar. In February, 80% of all stocks showed a positive efficiency. As of July 13th, only 37.4% of the market was positive. That's a very large change.
THIS IS A MAJOR CHANGE FROM THE LAST MARKET UPDATE AT THE BEGINNING OF THE MONTH. I didn�t think the entire market could change that quickly, but obviously it can. For that reason, I plan to look at market efficiency every two weeks to determine if there are any changes in the overall composition of the portfolio, not every month as I first suggested. Therefore I�ve started the portfolio as of July 16th.
Key Determinants
As of July 13th the market was 37.4% positive. However, only 31 stocks were above 10, while 77 stocks were below minus 10. As a result, we will start our portfolio with 70% short candidates and 30% long candidates. Another reason for that suggestion was among the 31 possible long candidates, I could only find three that I would consider buying. Those were FAL (Falconbridge), OGE (Oklahoma Gas and Electric), and AETH (Aether Holdings).
Among the short candidates, there were many excellent possibilities. As a result, I sorted the list of acceptable shorts by price and decided to short the seven highest priced stocks. These included, by ranking of their closing prices on the 13th, PFCB (PF Chang), LEE (Lee Enterprises), WPI (Watson Pharmaceuticals), JRCC (James River Coal), BSX (Boston Scientific), SCT (Scottish Annuities), and my old favorite for a positive efficiency stock in 2002, DLX (Deluxe Checking).
As I described before, we�ll take a $20,000 portfolio and divide it evenly into the 10 stocks. Thus, there will be approximately a $2000 investment in each, including commissions. Each stock will have a 10% initial stop, so our total initial risk will be 10%, with about a $200 risk on each stock.
The Portfolio
The portfolio was purchased (most of it shorted) at about 1:30 PM EDT on July 16th, 2006. I used that particular time, because that is when I looked at the market on the 16th. All of the stocks have a 10% stop and that will be replaced by a 25% trailing stop when that becomes closer. The current stocks in the portfolio are shown in Table 1 and reflect just over one day of trading. Eight out of ten of them went up yesterday and even after commissions, we only show a loss in four of them.
It�s interesting to note that LEE, which I pointed out as a great negative efficiency stock was one of them. WPI is also in the process of acquiring another company and the price of the company doing the take over usually suffers. We may get rid of this stock when the takeover date approaches.
We will also be making adjustments to the portfolio as often as every two weeks. These will be made as follows:
- When we get stopped out of a stock, we will replace it with the strongest (weakest, if short) stock on the same side of the market. This will be done the following Monday.
- Every two weeks, we will assess the market. If it calls for us to move to a different allocation (i.e., long or short), we will sell off the weakest stock in order for us to do so. If I do anything, I will mention it in the monthly update.
- Once each month (around the 15th) we will look at the market to determine if there is a better short (or long) than any of the stocks in the portfolio. This will be a purely discretionary call. When such a stock is found, it will replace the weakest stock on that side of the market.
|
Our Portfolio After the first Day (8 out of 10 stocks went in our direction) |
||||||||
|
Stock |
Entry |
Cost |
Shares |
Stop |
Price |
Value |
Profit |
R-multiple |
|
Now |
Loss |
|||||||
|
Longs |
|
|
|
|
|
|
|
|
|
FAL |
$54.25
|
$1,968.00 |
36 |
$48.83
|
$54.60
|
$1,965.60
|
($2.40) |
(0.012) |
|
OGE |
$35.97
|
$1,957.38 |
54 |
$32.37
|
$35.93
|
$1,940.22
|
($17.16) |
(0.086) |
|
AETH |
$6.05
|
$2,011.50 |
330 |
$5.45
|
$6.10
|
$2,013.00
|
$1.50
|
0.007 |
|
Shorts |
|
|
|
|
|
|
|
|
|
PFCB- |
$33.90
|
$1,966.20 |
58 |
($37.29) |
$33.44
|
$1,939.52
|
$12
|
0.058 |
|
LEE |
$26.29
|
$1,998.04 |
76 |
($28.92) |
$26.59
|
$2,020.84
|
($38) |
(0.189) |
|
WPI |
$22.61
|
$1,989.68 |
88 |
($24.87) |
$21.95
|
$1,931.60
|
$43
|
0.215 |
|
JRCC |
$22.06
|
$1,985.40 |
90 |
($24.27) |
$21.75
|
$1,957.50
|
$13
|
0.064 |
|
SCT |
$15.70
|
$1,978.20 |
126 |
($17.27) |
$15.32
|
$1,930.32
|
$33
|
0.164 |
|
BSX |
$15.74
|
$1,983.24 |
126 |
($17.31) |
$15.59
|
$1,964.34
|
$4
|
0.020 |
|
DLX |
$14.55
|
$1,978.80 |
136 |
($16.01) |
$14.54
|
$1,977.44
|
($14) |
(0.068) |
|
|
Cash |
$13,913.12 |
|
|
|
$21.26
|
|
0.175 |
|
|
Total |
$19,850.00 |
|
|
|
19661.64 |
|
|
* reflects the initial entry commission
My Efficiency Index
I've had numerous comments on the index, such as:
What is your specific formula for calculating efficiency?
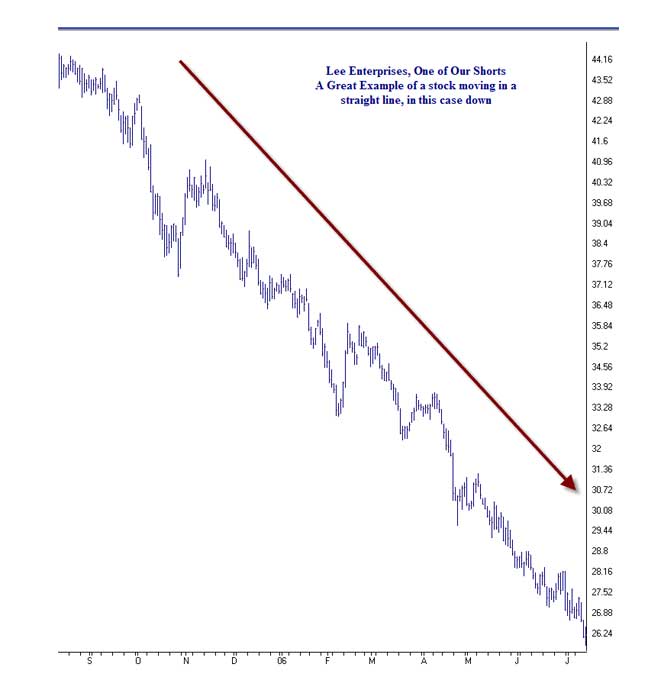
Answer: My formula is proprietary because I don�t want to answer questions such as �Why don�t you calculate it this way or that way or why did you do this?� My goal was to screen the market and find stocks that are moving up or down in a fairly straight line. Those are the ones I tend to use.
The chart below, of Lee Enterprises, one of the shorts in the portfolio, is an example of what I�m looking for. But believe me, most of them don�t look that perfect.
Efficiency might not even be the best way to find such stocks and many of the one�s you find are stocks you�d never want to trade, so discretion must be used.
Many of my prior favorite shorts have now moved so low (i.e., below $5) that I wouldn�t consider them for this portfolio.
One reason that I�m trading this as a sample portfolio is so you can get some sort of idea how to test such a discretionary system in real time for yourself.
How can we calculate our own efficiency index?
Answer: Methods for calculating efficiency are found in both Trade Your Way to Financial Freedom and Safe Strategies for Financial Freedom.
How can I use relative strength or some other formula to generate a similar list?
Answer: You can use any measure of trend following to generate such a list for yourself. You could use ADX, positive DI and negative DI, stocks at new highs or new lows, relative strength, relationship to 200 day moving average. Any of them could be used. I just like efficiency.
Why don�t you just give us a total list of the stocks that you like so we can pick for ourselves?
Answer: This is not an investment advisory newsletter. It is a free, educational newsletter. My job is to teach you to fish, not to hand the fish to you.
Why don�t you give us the best stocks on the day the newsletter is published so we can trade the system.
Answer: The last thing I want is for you to trade the portfolio we�re tracking. THIS IS NOT EVEN A TESTED SYSTEM. This is simply a system that makes a lot of sense logically. However, over time, I may find that some of the rules don�t work. Perhaps a 10% initial stop is too tight. I�m tracking this system to give you some ideas about trading system development. I may change the rules in midstream or start again if something doesn�t work.
The last time I did this was in my newsletter Market Mastery in 2001-2002. My purpose was to show that there were good long stocks even in a bear market. The portfolio was actually doing quite well until the depths of the bear market. However, toward the bottom of the bear market the strategy was totally useless because there were no stocks with efficiencies above 10. In fact, if this market keeps going, we may find the same result. However, for the current portfolio, that won�t be a problem because we�ll be 100% short. A problem might arise if the market becomes too low and all the best short candidates sell for $5 or less.
About Van Tharp: Trading coach, and author Dr. Van K Tharp, is widely recognized for his best-selling book Trade Your Way to Financial Fre-edom and his outstanding Peak Performance Home Study program - a highly regarded classic that is suitable for all levels of traders and investors.
Can't Come to the Workshop?
That shouldn't stop you from developing your trading system.
|
How to Develop a Winning Trading System Home Study Program
- Get specific ideas for making better market entry and exit decisions. - Get specific money management principles from two experts in the industry. - Learn the psychological pitfalls that hold so many people back. Just knowing about them will help you avoid them. - Work through Dr. Tharp�s model, developed after 15 years of research with top traders and investors, on how to design, develop, and customize a trading system in the most effective way possible. |
Remember, if you do attend the workshop the Home Study Course is included in the price of your tuition!
A Review of Market Models: Spreads & Pairs � the Pros and Cons
by D. R. Barton, Jr.
Last week in this space, we gave an overview of different types of spreads and pairs trading. And we looked at the myth (or at least partial myth) that spread and pairs trading is safer than going only long or short one side of the trade.
Today, let's look at the pros and the cons of spreads trading in general. Then next week we�ll look more in depth a the individual strategies for spread and pairs trading and see which ones are really being used, and which ones are just fodder for literature.
The Positives of Spread and Pairs Trading
* Lower volatility: Last week I mentioned that many folks are drawn to spread and pairs trading by the promise of lower risk. Whether you have lower risk vs. taking only a long or short poison in one instrument is really based on your position size. But what you really do achieve through spread and pairs trading is lower volatility. This is reflected in the margin rates that exchanges set for trading different instruments. Take soybeans for example. The Chicago Board of Trade sets the margin for one contract of soybeans at $750. But a for a month-to-month spread of soybeans (say short the November contract and long the January contract), the margin is only 135 dollars.
But remember our discussion from last week. Most traders put on larger spread positions precisely because the volatility is lower. So be sure you manage your risk through normal position sizing practices instead of just assuming that lower risk will occur because of the nature of spreads and pairs.
* Well established historical norms: For many types of spread and pairs trading, there is a good history of price relationships that traders can use to guide their strategies. Ratios between gold and silver and the typical price of a soybean crush (soybean prices versus a combination of soybean meal soybean oil) have been well established for years and the outer boundaries of those relationships are well known. Likewise, the price ratio between two stocks in a takeover arbitrage pairs trade is well established, allowing traders to speculate on the likelihood that the deal will fall through or on psychological factors that affect the ratio.
The Negatives of Spread and Pairs Trading
* Transaction costs: The simple math is that you pay double commission and slippage for most types of spreads and pairs trading. In the height of the day trading feeding frenzy back in 2000, one of the biggest day trading brokers was extolling the benefits of pairs trading and doing everything they could to get their clients to do rapid-fire pairs trading. This, of course, was very self serving; what they were really interested in was doubling their commissions.
* When things go wrong, they can go really wrong: One of the strengths of spread and pairs trading is that relationships between well-established spreads and pairs tend to move in very narrow price channels. BUT... when those relationships are temporarily broken, they can move very far, very fast. And since this style of trading is done because it's typically a low volatility trade, when volatility picks up violently, people get caught with large positions. An extreme example of this is in takeover arbitrage pairs trading. When company �A� buys company �B,� the ratio of their value is set by the terms of the takeover. The ratio usually trades at a slight discount to take into account the uncertainty that the deal might fall through. When the ratio gets a little wider people bet that it will return to a tighter ratio. However, when there are rumors that the deal will fall through or if it actually does fall through, anyone who is arbitraging the deal gets taken to the cleaners. It doesn�t happen often, but when it does, it can be devastating.
Next week, we�ll look more in depth at some of the individual types of spread and pairs trades. Until then�
Great Trading!
D. R. Barton, Jr. is the Chief Operating Officer and Risk Manager for the Directional Research and Trading hedge fund group. D. R. has been actively involved in trading, researching, and teaching in the markets since 1986. D. R. has taught extensively in many investment areas including intra-day trading, swing trading, and cutting edge risk management techniques.
His writing credits include co-authoring Safe Strategies for Fin-ancial Fre-edom and co-creator and contributing author on Fin-ancial Fre-edom Through Electronic Day Trading.
D.R. presents the IITM Swing Trading Workshop and Professional Tactics for Day Traders Workshop. Each workshop is only held once each year.
VAN THARP HAS A NEW BLOG
Blog Entry from: July 16, 2006
What's the Most Important Entry So Far?
What's the most important entry blog I've made so far? Well, it again depends upon your perspective.
Most people think that success is all about predicting the market and picking the right investment or trade.If that's your perspective, then the most important entry so far is the blog on my outlook for the market (assuming you think it is correct).
However, our research shows that picking the right investments is the least important aspect of success. And predicting the market is equally unimportant... you merely have to notice what the market is doing and that's pretty obvious: It's going down.
Instead, our research shows that success has everything to do with psychology, treating trading like a business, and developing systems that fit who you are. And if that's the case, then my most important entries are the first ones, which give some of the essence of my core thinking and the entry on "how to make a living as a trader." That entry may seem "promotional" to some, but if you take the essence of what I said, without reference to IITM products, it's probably the most important entry I've made to date. It's the essence of what I ask my Super Traders to do.
Special Reports By Van Tharp
Click below to read page one of each report, or to order.
Do Not Reply to this email using the reply button as the email address is not monitored, your email will not be seen. Please click this link to contact us: [email protected]
The Van Tharp Institute does not support spamming in any way, shape or form. This is a subscription based newsletter.
If you no longer wish to subscribe, Unsubscribe Here
Or, paste this address in your browser: http://www.iitm.com/privacy_policy.htm
The Van Tharp Institute
102-A Commonwealth Court, Cary, NC 27511 USA
800-385-4486 * 919-466-0043 * Fax 919-466-0408
Copyright 2006 the International Institute of Trading Mastery, Inc.