Tharp�s Thoughts
Market Update from June 30, 2006
1-2-3 Model Still in Red Light Mode
By
Van K. Tharp
Look for these monthly updates on the first issue of each month. This allows us to get the closing month data. In these updates, we�ll be covering each of the major models mentioned in the Safe Strategies book: 1) the 1-2-3 stock market model; 2) the five week status on each of the major stock U.S. stock market indices; 3) our new four star inflation-deflation model; and we�ll be 4) tracking the dollar.
Part I: Market Commentary.
The downturn since May in almost everything has now leveled off with the major averages only down about 1% last month. However, the downturn was on a worldwide basis and included commodities such as gold. Furthermore, the Fed continues to see inflation in the future and will continue to raise interest rates. Remember what happened with interest rate increases in 1999.
The market is pretty typical of a secular bear market. The major averages are all within 4% of their levels 18 months ago, and that�s not good performance. And the NASDAQ is actually down 2.8% over the last 18 months. As I�ve said before, 2006 is definitely not a great year to have your money in mutual funds.
Part II: The 1-2-3 Stock Market Model IS IN RED LIGHT MODE.
Let�s look at what the market has done over the last five weeks and compare that with where the averages were December 31st 2005. This is given in the next table. Incidentally, this data is calculated by hand, so there is always a possibility of human error in our numbers.
| Weekly Changes in the Major Stock Market Indices | ||||||
|
Date Week Ending |
DOW 30 |
Change |
SP500 |
Change |
NAS
100 (NDX) |
Change |
| 12/31/04 |
10,783.01 |
1211.12 |
1621.12 |
|||
| 12/30/05 |
10,717.50 |
-0.6 | 1248.29 |
+3.1 | 1645.20 |
+1.5% |
| 6/02/06 |
11.247.87 |
-0.4% | 1288.22 |
+0.2% | 1612.90 |
+0.4% |
| 6/9/06 |
10,989.09 |
-3.1% | 1252.30 |
-2.7% | 1550.97 |
-3.8% |
| 6/16/06 |
11,014.54 |
+1.1% | 1251.54 |
-0.0% | 1562.84 |
+0.7% |
| 6/23/06 |
10.989.09 |
-0.2%` | 1244.50 |
-0.6% | 1551.05 |
-0.7% |
| 6/30/06 |
11,150.22 |
+1.4% | 1270.30 |
+2.1% | 1575.23 |
+1.5% |
All of the major averages are down slightly from the last week in May (Shown as 6/2/06), but not a lot.
Efficient stocks. What�s the market telling me in terms of efficiency? Here, the data is very interesting. I now have a proprietary indicator of the entire market � its efficiency. What percentage of the stocks that I screen show positive efficiency? What percentage of the stocks that I screen show negative efficiency? I�ve only been doing this for about six months so I don�t have much historical data. However, the market has now shown a dramatic turn. In February, about 80% of the 4000 + stocks I monitor showed a positive efficiency. Now the market shows a neutral bias with about 55% showing a positive efficiency. In February I had 406 stocks with efficiency ratings above 10 with only 11 stocks with efficiency ratings below minus 10. As of July 3rd, that�s changed dramatically. Only 5 stocks show efficiency ratings above 10, while 38 stocks show efficiency ratings below minus 10.
I�m not going to give examples of efficient stocks in this section anymore, because I�m actually going to track an efficiency portfolio, starting in two weeks. I have the belief that it�s fairly easy to develop a good trading strategy and that the simpler the strategy the better. As a result, we�re going to track such a strategy in Tharp�s Thoughts starting in two weeks. Watch for that issue.
I want to again show you the graph that I published last month showing the PE ratios of the S&P500. They show a general downturn since 2000, which is typical of a secular bear market. Secular bear markets usually don�t end until such PE ratios reach single digit ranges, so this bear market has a long way to go. However, PE ratios going down do not necessarily mean that prices go down. It just means that stocks will not get a boost, like they did in the 1990s from strongly increasing PE ratios. Instead, there will be a downward pressure.
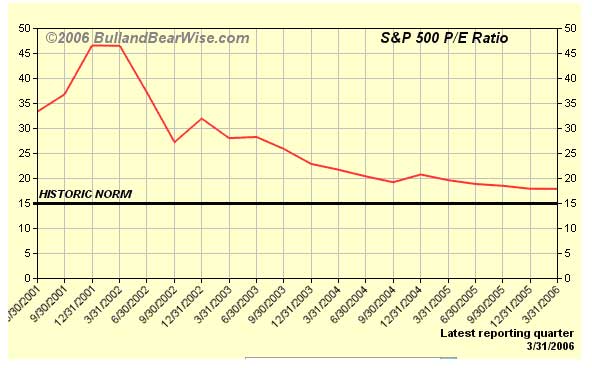
There was a slight upturn in 2003, but the ratios have dropped from over 40 to 17.48 as of the quarter ending March 31, 2006. They are estimated to be about 16.5 for the quarter that just ended. That would give the 1-2-3 model a boost, but we will be changing that model as soon as we get some good 2nd quarter estimates of the PE ratios.
Part III: Our Four Star Inflation-Deflation Model.
I now strongly believe that we are in an inflationary bear market and that our inflation rate is simply masked by government statistics.
So far our models have been telling us, that inflation/deflation is pretty steady, with a slight inflationary bias and that�s where secular bear markets tend to start.
So what�s our new indicator telling us about inflation?
1) The CRB Index
2) The Basic Materials Sector (XLB)
3) The London Price of Gold and
4) The Financial Sector (XLF)
Since the description of the model we�re now using is not in any of my books, I�ll continue to give it here.
1) The CRB Index. I believe that the CRB index is the one we have currently that is the least manipulated by the government. But what�s the best way to measure it? For consistency, I plan to give two measurements.
� Is the CRB index higher than it was six months ago? If it is, we are on track for inflation.
� Is the CRB index higher than it was two months ago?
Now there are several ways to monitor these two indices.
� If both differences are higher, we�ll count one star for inflation.
� If the six-month change is higher, but the two-month change is not, then we will only count � star for inflation.
� And if both the two and six month changes are lower, then we�ll be minus one for inflation.
� However, if the six-month change is lower, while the two-month change is higher, then we�ll be minus � star for inflation. Obviously, the two minus scores will point to deflation.
2) The Basic Materials Sector ETF (XLB). In an inflationary environment, basic materials will definitely go up and this sector, to the best of my knowledge, is not manipulated by the government. Thus, we will use this sector to monitor inflation and we�ll use the same measurements use for the CRB. (1) Is the XLB higher than it was six months ago? (2) Is the XLB higher than it was two months ago? These two measurements give us four possible results.
� If both differences are higher, we�ll count one star for inflation.
� If the six-month change is higher, but the two-month change is not, then we will only count � star for inflation.
� And if both the two and six month changes are lower, then we�ll be minus one for inflation.
� However, if the six-month change is lower, while the two-month change is higher, then we�ll be minus � star for inflation. Obviously, the two minus scores will point to deflation.
3) The London PM Gold price at the end of each month. Although the government can manipulate Gold, I still like to look at monthly gold prices. However, to be consistent, we�ll use the same two measurements that we�ve used for the other indices that we are monitoring. (1) Is the price higher than it was six months ago? (2) Is the price higher than it was two months ago? Again, these two measurements give us four possible results.
� If both differences are higher, we�ll count one star for inflation.
� If the six-month change is higher, but the two-month change is not, then we will only count � star for inflation.
� And if both the two and six-month changes are lower, then we�ll be minus one for inflation.
� However, if the six-month change is lower, while the two-month change is higher, then we�ll be minus � star for inflation. Obviously, the two minus scores will point to deflation.
4) The Fourth Measurement we�ll use is related to the Financial Sector of the S&P 500.
The financial sector (XLF) tends to do well when we have deflation and poorly when we have inflation. Martin Pring, in fact, has used an index in which he divides the XLB by the XLF. Since we already use the XLB, we�ll use the XLF by itself as well. Again, we�ll use the change over six months and over two months. However, the four possible outcomes with give us a different interpretation.
� If both differences are higher, we�ll count one star for deflation (i.e., minus one for inflation).
� If the six-month change is higher, but the two-month change is not, then we will only count � star for deflation (i.e., minus � for inflation). And if both the two and six month changes are lower, then we�ll be plus one for inflation.
� However, if the six-month change is lower, while the two-month change is higher, then we�ll be plus � star for inflation. Obviously, the two minus scores will point to strong inflation.
Okay, so now let�s look at the results for the last six months.
|
Date |
CRB |
XLB |
Gold |
XLF |
| November 30th |
332.49 |
29.67 |
495.85 |
31.87 |
| December 30th |
347.89 |
30.28 |
513.00 |
31.67 |
| January 31st |
363.30 |
31.74 |
568.25 |
31.95 |
| February 28th |
353.27 |
31.06 |
556.00 |
32.63 |
| March 30th |
364.70 |
32.35 |
582.00 |
32.55 |
| April 28th |
379.53 |
33.50 |
644.00 |
33.96 |
| May 31st |
385.65 (6/2) |
31.95 |
653.00 |
32.56 |
| June 30th |
385.63 |
32.10 |
613.50 |
32.34 |
We�ll now look at the two-month and six-month changes during 2005, to see what our readings have been.
| Date | CRB2 | CRB6 | XLB2 | XLB6 | Gold2 | Gold6 | XLF2 | XLF6 | Total Score |
| June | Higher | Higher | Lower | Higher | Lower | Higher | Lower | Higher | |
| +1 | +0.5 | +0.5 | -0.5 | +1.5 |
The results of this model are much more sensitive (I believe) than the model I presented in Safe Strategies for Financial Freedom.
The CRB is strongly indicating inflation. The CPI topped 200 in April, nearly a 2 point jump in one month. That�s probably one reason that the Federal Reserve is going to continue to raise rates.
Gold had a major correction down from $725 to as low as $567. However, it has now started to recover. My sources tell me that the major correction had to do with major funds bailing out of the trend. When it was going up, a lot of funds jumped on the trend. And as soon as it started to correct, they all jumped out together, producing a substantial correction. However, in my opinion, that correction is probably over. But that�s just my opinion. We�ll see what the market tells us next month. The all time high of gold (inflation adjusted) is about $2100, so gold is no where near that range. I expect that the gold bull market will continue for some time.
Part IV: Tracking the Dollar.
The U.S. dollar is definitely looking weak again, which is another reason that the Federal Reserve needs to continue to raise rates. It seemed to pick the low point of the year when I was in Europe � naturally � and has retraced slightly.
|
The Dollar Index |
|
|
Month |
Dollar Index |
| Jan 05 | 81.06 |
| Jan 06 | 84.45 |
| Feb 06 | 85.26 |
| Mar 06 | 85.17 |
| Apr 06 | 84.05 |
| May 06 | 80.78 |
| June 06 | 81.66 |
| July 06 | 81.32 |
The long-term effects of a weak dollar are really very serious. If the dollar gets too weak, no one will want to hold U.S. debt. Think about it, why would you want to hold a debt instrument of a currency that continues to weaken? As a result, countries (and people) will start selling their U.S. bonds. Since no one will want to buy the bonds, prices will go down, which means interest rates will go up. And interest rates will continue to go up until they get high enough so that people actually want to hold the U.S. dollar. What level will that be? 10%? 15%? 20%? And if that happens what will the impact be on the U.S. Stock market and the U.S. housing market? Not good.
Hopefully, nothing like this will happen in the near future.
Until the end of July update on the market�.this is Van Tharp.
About Van Tharp: Trading coach, and author Dr. Van K Tharp, is widely recognized for his best-selling book Trade Your Way to Financial Fre-edom and his outstanding Peak Performance Home Study program - a highly regarded classic that is suitable for all levels of traders and investors.
Make your plans now for upcoming workshops.
Back to Back workshops are color coded below
| How to Develop a Winning Trading System |
Aug 25-27, 2006 |
Raleigh, NC |
| Day Trading |
Sept 16-18, 2006 |
Raleigh, NC |
| Peak Performance 101 |
Sept 23-25, 2006 |
SYDNEY, AUSTRALIA |
| How to Develop a Winning Trading System |
Sept 27-29, 2006 |
SYDNEY, AUSTRALIA |
| 17 Steps To Become a Great Trader |
Oct 23-25, 2006 Includes a networking dinner at Van Tharp's home, October 25th |
Raleigh, NC |
| Mutual Funds & ETFs |
Oct 27-29, 2006 Includes a networking dinner at Van Tharp's home, October 25th |
Raleigh, NC |
| Peak Performance 101 |
Nov 3-5, 2006 Includes a networking dinner at Van Tharp's home, November 5th. |
Raleigh, NC |
| Peak Performance 202 |
Nov 7-9, 2006 Includes a networking dinner at Van Tharp's home, November 5th. |
Raleigh, NC |
A Review of Market Models: Parabolic SAR
by D. R. Barton, Jr.
Every so often, the technical pundits try to kill off an indicator. This has definitely been the case for Welles Wilder�s beleaguered Parabolic Stop And Reverse (SAR) indicator system.
Introduced in Wilder�s landmark 1978 book New Concepts in Technical Trading Systems, it was presented as an �always in the market� system that, as its name implies, stops and reverses when the trigger point is hit.
The Parabolic SAR is basically a trailing stop system that starts far away from the price action (to give the trend time to develop), and then moves �parabolically� toward the price action as the trend matures. This is tough to envision, so let�s look at an example in the following chart.
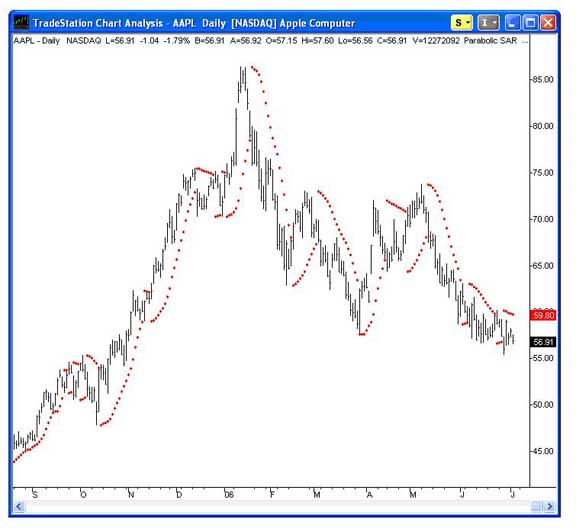
In this chart of Apple Computer (NASDAQ:AAPL), you can see the Parabolic SAR indicators that are drawn as a red dot to trail above or below a pricing trend.
As with all trend following indicators, when the stock was trending strongly, it was great at keeping you in the trend for most of the move. Look for example at the short from around $75 in early May that kept you short until somewhere below $60.
However, during choppy markets, this indicator gets whipsawed in a real and serious way.
Now let�s look at our market model questions for the Parabolic SAR:
Is it theoretically credible? Yes � it keeps you in long enough for a trend to develop and then does a good job trailing to catch most of the action of a big trend move.
Who�s it most useful for? Long term trend followers. Could be useful as a stand alone system in strongly trending markets. But most use it as a trailing stop, not as an entry indicator.
How fanatic are the fans? Weak, actually. Many more people trying to shoot it down than carry its banner.
Is it being used by real-life traders? Yes. A surprisingly large number of traders use this as a trialing stop in a strategy with multiple complementary profit taking exits.
My good friend Chuck Le Beau is a fan of the Parabolic SAR and he builds systems to take advantage of multiple profit taking exits better than anyone I know. I have the great privilege of teaching the August How to Develop a Winning Trading System Workshop with Chuck. This is an opportunity to learn from a systems MASTER and one of the really good guys in our industry � you don�t want to miss this chance to study with Chuck!! (Oh, yeah, I�ll toss in a useful tidbit or two as well�)
Great Trading!
D. R. Barton, Jr. is the Chief Operating Officer and Risk Manager for the Directional Research and Trading hedge fund group. D. R. has been actively involved in trading, researching, and teaching in the markets since 1986. D. R. has taught extensively in many investment areas including intra-day trading, swing trading, and cutting edge risk management techniques.
His writing credits include co-authoring Safe Strategies for Fin-ancial Fre-edom and co-creator and contributing author on Fin-ancial Fre-edom Through Electronic Day Trading.
D.R. presents the IITM Swing Trading Workshop and Professional Tactics for Day Traders Workshop. Each workshop is only held once each year.
From the Van Tharp Mastermind Forum:
Option Writer vs. Trend Follower
Author: BW
Date: 06-27-06 16:57
Hi all,
Hopefully I have found an active and open-minded community of traders on the internet. So, I have many questions and observations concerning trading that I can't seem to find any good answer to...correct that, any answer or discussion on. Here is one of the one's bugging me the most right now....
Let's compare two different types of trader.
Trader A makes her money by writing credit spreads on a cash index. She primarily uses support and resistance lines along with Monte Carlo simulation. Let's say that her trading system produces 86% winners, 7% breakeven, and 7% losers. Her average winner is $150 and her average loss is $300. Her system requires $2000 of margin plus the amount she is willing to lose in a drawdown.
Trader B makes his money through directional trades that he makes on a select basket of stocks. He uses a couple of indicators in order to generate his completely mechanically determined trades (i.e. no discretion). His system produces 55% winners . His average win is $444 and his average loss is $202. His system also requires $2000 of capital plus the amount he is willing to lose in a drawdown.
So, the questions are: how are these two traders different and how are they the same in areas such as risk control, personal psychology, and managing account growth? In what other ways might they be different?
I don't really have a lot of answers, but I would contend that they are in fact very different and that each requires different methods of dealing with these issues. I look forward to hopefully some thoughtful discussion.
BW
Reply To This Message
Option Writer vs. Trend Follower
Author: Terry
Date: 06-27-06 18:48
Hi
Since I am active and consider myself relatively open-minded, my conclusion regarding traders A and B, is that they are remarkably similar.
Their similarity lies not in the fact of what they trade, but how they trade. Any approach to risk control, managing account growth, developing a trading system or any other facet to their trading is dependant on their personal psychology and how that psychology shapes their respective approach to problem solving in general.
Success is a function of intelligent control and since both traders A and B have seemed to produce positive results, I view them both, as being more similar than dissimilar.
Regards, Terry
Reply To This Message
Re: Option Writer vs. Trend Follower
Author: Pumpernickel
Date: 06-27-06 22:59
I am glad you mentioned Monte Carlo simulation. It is one way to resolve the question: which do *I* prefer, A or B? Just because you prefer A doesn't mean that everyone else will agree; but then, you don't have to please them. You only have to please yourself.
If you hunt around the net you will find lots of numerical methods for measuring the "goodness" or "desirability" of an equity curve. Some of them go by the names Sharpe_Ratio, Sortino_Ratio, MAR_Ratio, Ulcer_Index, Wealth_Lab_Score, R_squared, Return_Retracement_Ratio, Downside_Deviation_Sharpe_Ratio, etc. Look 'em up and find one that you can feel comfortable with.
Now use Monte Carlo analysis to generate ten thousand equity curves of trading system A, each equity curve containing three thousand trades. Measure the Sharpe_Ratio of each equity curve and plot a histogram of Sharpe_Ratios. (Or if you like Ulcer_Index, plot a histogram of Ulcer_Index values, etc.).
Use Monte Carlo analysis to generate 10,000 equity curves of trading system B, each equity curve also containing 3,000 trades. Measure the Sharpe_ratio of each equity curve and plot a SECOND histogram. (Or use whatever goodness measure you line).
Now compare histogram A against histogram B. Which do *you* like better? That's the trading system which fits you best.
I did this just now (used a little quick-n-dirty program in the horrific APL language) and found that I happen to prefer histogram B. But I am not you and since you don't know me, you may as well ignore my opinion and trust your own instead. Perhaps I am an agent of Satan, sent to this Earth on a specific mission to confuse and mislead *you*.
Reply To This Message
Re: Option Writer vs. Trend Follower
Author: PMK
Date: 06-28-06 08:04
Let's not forget why we trade - to make money, not for kudos, excitement, or fun. Any method that is sound, has a sensible reason for working, is complete, and is able to be accurately and consistently implemented by the trader should work.
I happen to trade 8 different systems all with different characteristics, timeframes, instruments, and ideas (although some of the most important aspects of each system are common to all of them). That's my idea of diversification in order to have a smoother equity curve - someone else may take their 'best' system and just trade all their capital with that - they would make more money, but have a much more volatile equity curve.
Nobody said you can only 'be' one kind of trader.
Paul King
PMKing Trading LLC
Reply To This Message
Re: Option Writer vs. Trend Follower
Author: BW
Date: 06-28-06 15:52
Thank you for the replies so far. I think that I have found the right place to discuss these ideas, but I would like to get a little more in-depth than what we have done so far. By the way, I don't disagree with anything that has been posted to date, and in fact I agree with pretty much everything.
BW
Special Reports By Van Tharp
Click below to read page one of each report, or to order.
Do Not Reply to this email using the reply button as the email address is not monitored, your email will not be seen. Please click this link to contact us: [email protected]
The Van Tharp Institute does not support spamming in any way, shape or form. This is a subscription based newsletter.
If you no longer wish to subscribe, Unsubscribe Here
Or, paste this address in your browser: http://www.iitm.com/privacy_policy.htm
The Van Tharp Institute
102-A Commonwealth Court, Cary, NC 27511 USA
800-385-4486 * 919-466-0043 * Fax 919-466-0408
Copyright 2006 the International Institute of Trading Mastery, Inc.