|
July 14-16, 2006, Raleigh, NC
Here�s what participants have said about our wealth courses:
|
Tharp�s Thoughts
Market Update from May 30, 2006
1-2-3 Model Still in Red Light Mode
By
Van K. Tharp
Look for these monthly updates in the first issue of each month. This allows us to get the closing month data. In these updates, we�ll be covering each of the major models mentioned in the Safe Strategies book: 1) the 1-2-3 stock market model; 2) the five week status on each of the major stock U.S. stock market indices; 3) our new four star inflation-deflation model; and 4) we�ll be tracking the dollar.
Part I: Market Commentary.
Just as I suggested in my recent mid-month update, May is often the start of a downturn in the markets and that�s what we�ve had. Only it�s been on a worldwide basis. And it�s included commodities such as gold. Furthermore, despite everyone�s predictions, the Fed has announced that it will continue to raise interest rates. Ten year treasuries are now over 5%, up significantly from the low of about 3.8% approximately a year ago. Inflation, according to the latest pronouncements from the Federal Reserve, doesn�t seem to be under control, so expect more rate increases. Remember what happened with interest rate increases in 1999.
Perhaps this year will continue with basically flat performance, but I actually think the chances are excellent for 2006 to be a major down year. 2006 is definitely not a great year to have your money in mutual funds.
Part II: The 1-2-3 Stock Market Model IS IN RED LIGHT MODE.
Let�s look at what the market has done over the last five weeks and compare that with where the averages were at the end of 2004 and 2005. This is given in the next table. Incidentally, this data is calculated by hand so there is always a possibility of human error in our numbers.
Weekly Changes in the
Major Stock Market Indices
|
||||||
|
Date Week
Ending |
DOW
30 |
Change |
SP500 |
Change |
NAS
100 (NDX) |
Change |
|
12/31/04 |
10,783.01 |
|
1211.12 |
|
1621.12 |
|
|
12/30/05 |
10,717.50 |
-0.6 |
1248.29 |
+3.1 |
1645.20 |
+1.5% |
|
5/05/06 |
11,577.74 |
+1.9% |
1325.75 |
+1.2% |
1713.84 |
+0.8% |
|
5/12/06 |
11,500.73 |
-0.7% |
12.91.24 |
-2.6% |
1635.81 |
-2.1% |
|
5/19/06 |
11,144.06 |
-3.1% |
1267.03 |
-1.9% |
1600.86 |
-2.1% |
|
5/26/06 |
11,287.61 |
+1.3% |
1280.16 |
+1.0% |
1606.37 |
+0.3% |
|
6/02/06 |
11.247.87 |
-0.4% |
1288.22 |
+0.2% |
1612.90 |
+0.4% |
The weekly data shows that the two major averages (the DOW and the S&P 500) have topped out, while the NASDAQ 100 is now lower than it was at the start of the year. In fact, it is lower than it was at the start of 2005. My guess is that the mutual funds, which tend to hold the major average stocks, are holding up the DOW and the S&P 500, while others are getting out of small cap stocks (i.e., the Russell 2000 and the big technology stocks).
Efficient stocks. What�s the market telling me in terms of efficiency? Here, the data is very interesting. I now have a proprietary indicator of the entire market � its efficiency. What percentage of the stocks that I screen show positive efficiency? What percentage of the stocks that I screen show negative efficiency? I�ve only been doing this for about six months so I don�t have much historical data. However, the market has now shown a dramatic turn. In February about 80% of the 4000+ stocks I monitor showed a positive efficiency. Now the market shows a neutral bias with about 51.8% showing a positive efficiency. In February, I had 406 stocks with efficiency ratings above 10 with only 11 stocks with efficiency ratings below minus 10. As of June 2nd, that�s changed dramatically. Only 70 stocks show efficiency ratings above 10, while 42 stocks show efficiency ratings below minus 10.
Let me give you an example of what�s showing up as positive and negative. MICC, a foreign cell phone stock, still shows up with the highest efficiency, but it looks like it is topping out. Other good positive efficiency stocks, include MED, FAL, and DAKT. On the negative side the same stocks show up as last month, BKF (accidentally listed as DKF last month), WON, and PQE are all great. You should also take a look at DLX which looks very good for more downside activity.
Incidentally, since I trade this strategy, I may or may not have positions in the stocks that I mention. However, these examples are given for educational purposes and you should do your own due diligence if you decide to trade them.
You may have noticed that I�ve mentioned a number of these companies from month to month. Because I have mentioned them, you�ll find it means that the price has either gone up nicely (in the case of positive efficiency stocks) or gone down nicely (in the case of negative efficiency stocks).
We are definitely in a secular bear market. What that really means is that stock values (i.e., price-to-earnings ratios or PERs) will go down. The chart below shows what has happened on a quarterly basis, since the secular bear market started. It shows PERs since the secular bear market began in 2000. Notice how they have continued to go down for the last six years.
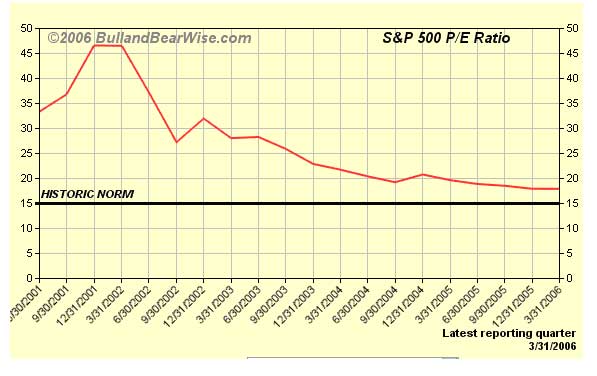
There was a slight upturn at the end of 2002, but the ratios have dropped from over 40 to 17.48 as of the quarter ending March 31, 2006.
Some people might say that the market is fairly valued. As since the PE ratio of the S&P 500 is now about 17, pretty soon Steve Sjuggerud�s 1-2-3 model will have one signal turning bullish just on that basis. However, secular bear markets typically do not end until the PE ratios go into the single digit range. Thus, I believe that model could be obsolete for a while. As a result, I plan to start graphing the percentage of stocks showing positive efficiencies starting next month as a substitute barometer for how the stock market is doing.
Does that mean that stock prices will go down? Not necessarily. What if we have high inflation? Let�s say in 10 years the dollar is worth 10% of its value today. That means the Dow Jones Industrials would have to be at 111,000 just to stay even. If the Dow is at 40,000, under those conditions, we could easily have single digit price to earnings ratios.
Part III: Our Four Star Inflation-Deflation Model.
I now strongly believe that we are in an inflationary bear market and that our inflation rate is simply masked by government statistics.
So far our models have been telling us that inflation/deflation is pretty steady with a slight inflationary bias, and that�s where secular bear markets tend to start.
So what�s our new indicator telling us about inflation?
1) The CRB Index
2) The Basic Materials Sector (XLB)
3) The London Price of Gold and
4) The Financial Sector (XLF)
Since the description of the model we�re now using is not in any of my books, I�ll continue to give it here.
1) The CRB Index. I believe that the CRB index is the one we have currently that is the least manipulated by the government. But what�s the best way to measure it? For consistency, I plan to give two measurements.
� Is the CRB index higher than it was six months ago? If it is, we are on track for inflation.
� Is the CRB index higher than it was two months ago?
Now there are several ways to monitor these two indices.
� If both differences are higher, we�ll count one star for inflation.
� If the six-month change is higher, but the two-month change is not, then we will only count � star for inflation.
� And if both the two and six month changes are lower, then we�ll be minus one for inflation.
� However, if the six-month change is lower, while the two-month change is higher, then we�ll be minus � star for inflation. Obviously, the two minus scores will point to deflation.
2) The Basic Materials Sector ETF (XLB). In an inflationary environment, basic materials will definitely go up and this sector, to the best of my knowledge, is not manipulated by the government. Thus, we will use this sector to monitor inflation and we�ll use the same measurements we use for the CRB. (1) Is the XLB higher than it was six months ago? (2) Is the XLB higher than it was two months ago? These two measurements give us four possible results.
� If both differences are higher, we�ll count one star for inflation.
� If the six-month change is higher, but the two-month change is not, then we will only count � star for inflation.
� And if both the two and six month changes are lower, then we�ll be minus one for inflation.
� However, if the six-month change is lower, while the two-month change is higher, then we�ll be minus � star for inflation. Obviously, the two minus scores will point to deflation.
3) The London PM Gold price at the end of each month. Although the government can manipulate gold, I still like to look at monthly gold prices. However, to be consistent, we�ll use the same two measurements that we�ve used for the other indices that we are monitoring. (1) Is the price higher than it was six months ago? (2) Is the price higher than it was two months ago? Again, these two measurements give us four possible results.
� If both differences are higher, we�ll count one star for inflation.
� If the six-month change is higher, but the two-month change is not, then we will only count � star for inflation.
� And if both the two and six-month changes are lower, then we�ll be minus one for inflation.
� However, if the six-month change is lower, while the two-month change is higher, then we�ll be minus � star for inflation. Obviously, the two minus scores will point to deflation.
4) The Fourth Measurement we�ll use is related to the Financial Sector of the S&P 500.
The financial sector (XLF) tends to do well when we have deflation and poorly when we have inflation. Martin Pring, in fact, has used an index in which he divides the XLB by the XLF. Since we already use the XLB, we�ll use the XLF by itself as well. Again, we�ll use the change over six months and over two months. However, the four possible outcomes will give us a different interpretation.
� If both differences are higher, we�ll count one star for deflation (i.e., minus one for inflation).
� If the six-month change is higher, but the two-month change is not, then we will only count � star for deflation (i.e., minus � for inflation). And if both the two and six month changes are lower, then we�ll be plus one for inflation.
� However, if the six-month change is lower, while the two-month change is higher, then we�ll be plus � star for inflation. Obviously, the two minus scores will point to strong inflation.
Okay, so now let�s look at the results for the last six months.
|
Date |
CRB |
XLB |
Gold |
XLF |
|
November
30th |
332.49 |
29.67 |
495.85 |
31.87 |
|
December
30th |
347.89 |
30.28 |
513.00 |
31.67 |
|
January
31st |
363.30 |
31.74 |
568.25 |
31.95 |
|
February
28th |
353.27 |
31.06 |
556.00 |
32.63 |
|
March 30th |
364.70 |
32.35 |
582.00 |
32.55 |
|
April 28th |
379.53 |
33.50 |
644.00 |
33.96 |
|
May 31st |
385.65
(6/2) |
31.95 |
653.00 |
32.56 |
We�ll now look at the two-month and six-month changes during 2005, to see what our readings have been.
|
Date |
CRB2 |
CRB6 |
XLB2 |
XLB6 |
Gold2 |
Gold6 |
XLF2 |
XLF6 |
Total
Score |
|
May |
Higher |
Higher |
Lower |
Higher |
Higher |
Higher |
Higher |
Higher |
|
|
|
|
+1 |
|
+0.5 |
|
+1 |
|
-1 |
+1.5 |
The results of this model are much more sensitive (I believe) than the model I presented in my book Safe Strategies for Financial Free-dom. The market has shown this exact same pattern for the last five months. Everything is higher over a two month period and a six month period. And thus, everything is positive for inflation except that the XLF is still increasing.
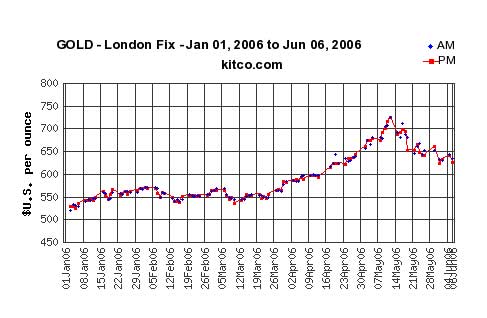
Gold and the CRB are strongly indicating inflation. The CPI topped 200 in April, nearly a 2 point jump in one month. That�s probably one reason that the Federal Reserve is going to continue to raise rates.
Gold has been in a bear market until 2003. Two months ago I was hearing the short-term gurus tell me that gold was definitely due for a correction and even recommending PUT positions. Instead, it spiked up last month, going well over 700 because of all the hedge funds piling into the trend. And then it took its correction. And it still may have a ways to go down. However, the all time high of gold (inflation adjusted) is about $2100, so gold is no where near that range. I expect that the gold bull market will continue for some time.
Part IV: Tracking the Dollar.
The U.S. dollar is definitely looking weak again, which is another reason that the Federal Reserve needs to continue to raise rates. I was in Europe for the last two weeks and I was amazed at the cost for Americans. My $300 got me a little under 200 Euros at the airport and the hotel in Frankfurt cost over 500 euros per night. And, as I might expect, the dollar hit a new low versus the Euro while I was there.
Look at the next Table, showing the dollar index over the past year.
|
The Dollar Index |
|
|
Month |
Dollar Index |
|
Jan
05 |
81.06 |
|
Feb
05 |
81.81 |
|
Mar
05 |
80.89 |
|
Apr
05 |
82.23 |
|
May
05 |
83.34 |
|
June
05 |
84.95 |
|
July
05 |
85.79 |
|
Aug
05 |
84.26 |
|
Sep
05 |
83.68 |
|
Oct
05 |
85.25 |
|
Nov
05 |
86.69 |
|
Dec
05 |
85.79 |
|
Jan
06 |
84.45 |
|
Feb
06 |
85.26 |
|
Mar
06 |
85.17 |
|
Apr
06 |
84.05 |
|
May
06 |
80.78 |
The long-term effects of a weak dollar are really very serious. If the dollar gets too weak, no one will want to hold U.S. debt. Think about it, why would you want to hold a debt instrument of a currency that continues to weaken? As a result, countries (and people) will start selling their U.S. bonds. Since no one will want to buy the bonds, prices will go down, which means interest rates will go up. And interest rates will continue to go up until they get high enough so that people actually want to hold the U.S. dollar. What level with that be? 10%? 15%? 20%? And if that happens what will the impact be on the U.S. Stock market and the U.S. housing market. Not good.
Hopefully, nothing like this will happen in the near future.
Until the June update on the market�.this is Van Tharp.
About Van Tharp: Trading coach, and author Dr. Van K Tharp, is widely recognized for his best-selling book Trade Your Way to Financial Fre-edom and his outstanding Peak Performance Home Study program - a highly regarded classic that is suitable for all levels of traders and investors.
Van Tharp's
How to Develop a Winning Trading System - Home Study Program
Learn the building blocks for designing a trading system that fits your personality and your style of trading.
This audio series is about giving you the tools you need to design your own system. You will be able to come up with winning systems that will work for you because they�ll be based on criteria that fit your situation.
The concepts and ideas you will learn could easily improve your trading overnight.
Learn More about this Home Study Program...
A Review of Market Models: Seasonal Trading
by D. R. Barton, Jr.
�Sell in May and go away�� � Old Stock Market Saying
We�ve reviewed two related market models so far � Elliott Wave Theory and Fibonacci Numbers. Today we�ll look at using seasonal tendencies as a market model.
When I first started trading, back in the 1980s, seasonal trading of commodities was all the rage. I used that method for several years and later in this article I�ll share my number one lesson from all of that. But for now, let�s look at the basics of seasonal trading.
There are two types of seasonal trading that people advocate:
1. Doing computer back testing of individual commodities (or even stocks and currencies), which looks at all possible scenarios for buy dates and sell dates. For example, if you buy corn on March 3rd and sell it on May 7th, you would have made money the last eight years. You can do this for individual contracts or spreads (where you buy one contract and sell another simultaneously).
2. Review fundamental tendencies of commodities (and stocks) that repeat year in and year out. Then trade according to those tendencies. As an example, knowing the tendency for freezes to affect orange juice crops, only trade the long side during the winter (this particular trade has been complicated by the reverse seasons of large producer Brazil).
Seasonality: Crystal Ball or Lead Anchor?
The second trading �system� that I ever bought was a Hume report on a seasonal soybean trade. The system claimed that since beans had shown this seasonal move for 9 out of the last 10 years, we could bank on it happening again. It didn�t. And I lost a bunch of cash on that trade.
There are plenty of resources that will show you printouts of what commodities have made the same move 80 � 100% of the time if you bought them on one date one and sold them many days later. Problem is that these �systems� don�t work. They are almost all based a sample size that is too small to be statistically significant (9 of the last 10 years!).
However, using fundamentally significant tendencies can be very useful in trading. What I learned is that these tendencies can be used as an excellent filter � as a set-up criteria for existing systems. But to be effective, they need good entry and exit criteria.
Now, let�s look at our standard list of questions for market models:
Is it theoretically credible? Two answers are needed here. For the style that back tests dates, the way most folks do it is not credible because it�s based on faulty statistics. This can be useful if the sample size is appropriate. For the use of fundamental seasonal tendencies, it is very credible. People do use more gasoline in the summer and more heating oil in the winter. Crops do have planting and harvest cycles.
Who�s it most useful for? Every commodity trader has to be aware of seasonal tendencies. Stock traders will also do well to pay attention to certain patterns in the equities markets, such as the traditional fall off in volume and volatility at the end of the summer.
How fanatic are the fans? Pretty good cheerleaders. Seasonal adherents are adamant about their relationships and data, but they are typically not so boisterous in trying to convert others to their way of thinking.
Is it being used by real-life traders? Most traders that I know keep an eye out for seasonal tendencies, and many use them as trade filters. I don�t know anyone using the buy on date �A� and sell on date �B� method.
Next week we�ll continue our series with another market model. Until then�
Great Trading!
D. R.
D. R. Barton, Jr. is the Chief Operating Officer and Risk Manager for the Directional Research and Trading hedge fund group. D. R. has been actively involved in trading, researching, and teaching in the markets since 1986. D. R. has taught extensively in many investment areas including intra-day trading, swing trading, and cutting edge risk management techniques.
His writing credits include co-authoring Safe Strategies for Fin-ancial Fre-edom and co-creator and contributing author on Fin-ancial Fre-edom Through Electronic Day Trading.
D.R. presents the IITM Swing Trading Workshop and Professional Tactics for Day Traders Workshop. Each workshop is only held once each year.
Van Tharp's Special Report on Money Management
Now available in PDF downloadable format!
$79.95 with no additional shipping charges for PDF files
You will learn...
� 27 models of position sizing with three ways to measure equity
� How to design high reward risk systems for money management
� Four techniques to produce maximum profits
� How to meet your objectives with position sizing
� Optimal position sizing techniques
� Understanding total, core, and reduced total equity models
� Using group and portfolio heat.
� Generalize "turtles" position sizing techniques
� Market Wizard position sizing techniques
� How to maintain constant risk
� How to maintain constant volatility
� Margin based position sizing
� Equal leverage models.
Peak Performance 202 is currently in session.
Here's what Attendees Said About Last Weekend's Peak 101 Workshop:
"The overall experience was excellent. I learned a lot about myself and techniques that will help to make me a better trader. I will follow the research and Van's ideas very carefully. I look forward to continued learning with his institute." �James Saas, CA
"Excellent course. Van has a clear mastery of the material, but also uses his techniques himself. This gives Van each sides' perspective, providing rich and helpful examples. Also, Van is committed to producing a course that gives the students much more than the price of the course and prepares the students for continued self-improvement." �Jason Robinson, OR
"I enjoyed learning about my beliefs and parts. I recognize that it's an important aspect of my trading. I see it as a key edge I will develop in my personal trading. Playing the game and understanding R- multiples, expectancy and position sizing was very valuable." �George Juross, Australia
"I thought the course was very useful, especially some of the exercises. I thought the trading game was very realistic and was the center piece of the course as it produced a lot of emotions and feelings that people could focus on for future work. Synergy between objectives, strategy and position sizing continue to be highlighted in every exercise. The trading game was fantastic and memorable for future system development. Networking potential, good long lasting relationship with other talented people." �Martin Malinow, NY
"As someone who hasn't traded yet, I'm very thankful I came upon IITM. As a result of Van's insights, I'm confident I will do well as a trader. I appreciate the interactive aspects of the course as this is much more interesting than just getting filled with a bunch of facts. Very practical information." �James Jansen, CO
"Practical application of theoretical ideas in peak course improve your trading and yourself. The trading game is an excellent proxy for your own trading. ANYTHING that comes up during that is excellent information to help you improve yourself and your trading. I really enjoyed actually applying some of the techniques I already knew in a group workshop environment. This will definitely have a positive benefit to my trading." �Paul King, VT
The next scheduled Peak Performance Workshops in the USA are in November 2006.
Peak Performance 101 will be held in Sydney Australia in September 2006...so mark your calendars!
Special Reports By Van Tharp
Click below to read page one of each report, or to order.
Do Not Reply to this email using the reply button as the email address is not monitored, your email will not be seen. Please click this link to contact us: [email protected]
The Van Tharp Institute does not support spamming in any way, shape or form. This is a subscription based newsletter.
If you no longer wish to subscribe, Unsubscribe Here
Or, paste this address in your browser: http://www.iitm.com/privacy_policy.htm
The Van Tharp Institute
102-A Commonwealth Court, Cary, NC 27511 USA
800-385-4486 * 919-466-0043 * Fax 919-466-0408
Copyright 2006 the International Institute of Trading Mastery, Inc.