The 17 Steps to Becoming a Great Trader
� Create a Trading Business Plan
� Develop Trading Strategies
� Complete a Self-Assessment
� Discover a Structured Approach to DisciplineThese are just some of the 17 lessons that you'll learn in Van Tharp's latest and newest workshop...
Your tuition includes a free Investment Psychology Profile!
Tharp�s Thoughts
Market
Update
for
Period Ending
1-2-3 Model Still in Red Light Mode
By Van K. Tharp, Ph.D.
Look for these monthly updates on the first issue of each month. This allows us to get the closing month data. In these updates, we�ll be covering each of the major models mentioned in the Safe Strategies book: 1) the 1-2-3 stock market model; 2) the five week status on each of the major stock U.S. stock market indices; 3) our new four star inflation-deflation model; and we�ll be 4) tracking the dollar
Part I: Market Commentary.
November tends to be the time of the year when retirement money starts to go into the stock market. This phenomenon starts in November and ends in April after taxes are filed (although the effects of the extra money seem to last through May). This year was no exception because the market turned around dramatically. In last month's update, I told you that my database of stocks had moved from 60% positive efficiency down to 42%. Furthermore, I had 44 stocks with an efficiency above plus 10 and 131 with an efficiency below minus 10. Well, effective December 2nd, those numbers totally reversed again. We now have 60.3% of the market with a positive efficiency and 138 stocks with efficiency ratings above 10. Last month I said that I seldom see this many good shorting candidates. Well, now there are almost NO good shorting candidates based upon my criteria. The only question is will things sustain themselves for a while or is this now a signal that the market will reverse again? We�re in a secular bear market and this type of market is very hard on the long term investor. Interest rates are still going up, so be careful in this market. If you remember the crash of 2000, the market really didn�t start going down until interest rates stopped going up. And that�s probably because by then the market was starting to feel the effects of the interest rate rise. If you watch the pundits on television, most of them seem to say we�re in for great times ahead and that�s usually not a good sign for the markets.
Part II: The 1-2-3 Stock Market Model IS IN RED LIGHT MODE.
What is the market doing? All three major averages are now up slightly on the year and there is a good chance right now that this could be a year in which the major averages are up 1%-5% over the year. That�s not a prediction � that�s where we are now!
So let�s look at what the market has done over the last five weeks and compare that with where the averages were December 31st last year. This is given in the next table. Incidentally, this data is calculated by hand based upon last Friday�s close (i.e., December 2, 2005), so there is always a possibility of human error in our numbers.
|
Weekly Changes in the Major Stock Market Indices |
||||||
|
Date Week Ending |
DOW 30 |
Change |
SP500 |
Change |
NAS 100 (NDX) |
Change |
|
12/31/04 |
10,783.01 |
|
1211.12 |
|
1621.12 |
|
|
11/04/05 |
10,530.76 |
|
1220.14 |
|
1628.03 |
|
|
11/11/05 |
10,686.04 |
+1.5% |
1234.72 |
+1.2% |
1653.36 |
+1.6% |
|
11/18/05 |
10,766.33 |
+0.8% |
1248.27 |
+1.1% |
1679.85 |
+1.6% |
|
11/25/05 |
10,916.09 |
+1.4% |
1268.25 |
+1.6% |
1701.05 |
+1.2% |
|
12/02/05 |
10,877.51 |
-0.4% |
1265.08 |
-0.2% |
1709.10 |
+0.5% |
Efficient stocks. As I mentioned last month, my trading strategy is to short the percentage of stocks that show negative efficiency and be long the percentage of stocks that show positive efficiency. However, that�s becoming impossible to do. While 39.7% of the stock market now shows a negative efficiency, there are three times as many stocks showing efficiencies above +10 (i.e., 138 stocks) as show efficiencies below -10 (i.e., 46 stocks). And most of stocks that are still showing negative efficiencies are either in consolidation patterns of showing slight uptrends.
Usually, the strategy does pretty well because both the positive efficiency stocks and the negative efficiency stocks make money. However, last month I got stopped out of every short I had except COT � and even that is consolidating. In fact, the newspaper stocks that I mentioned last month as high negative efficiency stocks seemed to be good candidates for the value investors to gobble up during the month. Chart One:
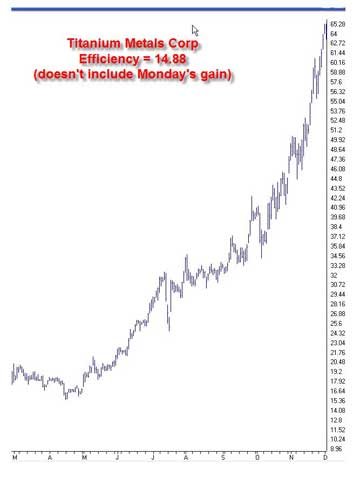
Monday December 5th was even more interesting. As of this writing at close, the Dow is down 40 points and some of the top efficiency stocks are on fire (i.e., TIE + 4.84; NTRI +2.41; LMS +2.10; HANS +1.24).
So, given the context that we�re in a secular bear market, my observations of what�s going on RIGHT NOW is that the market is quite strong. And please understand that my observations of what is happening now have nothing to do with what might happen in the future. My objective is to teach you to see what�s happening now.
Incidentally, since I trade this strategy, I may or may not have positions in the stocks that I mention. However, these examples are given for educational purposes and you should do your own due diligence if you decide to trade them.
Part III: Our Four Star Inflation-Deflation Model.
Before I get into this month�s inflation-deflation discussion, I want to repeat what I said last month about the secular bear market. I credit much of this information to Ed Easterling of Crestmont research. Ed believes that markets move from periods of low valuation (i.e., high paying dividends and low PE ratios) to periods of high valuation (i.e., low paying dividends and high PE ratios) and vice versa. When PE ratios go up, we have secular bull markets such as 1982 to 2000. These typically begin from periods of high inflation (or deflation) and end when inflation is very stable (i.e., at 1% to 2% like now). When PE ratios go down, we have secular bear markets. These typically start from periods of stable inflation (like now) and high PE ratios (i.e., the S&P 500 is above 20 now which is considered high) and will last for 15-20 years. Thus, even if the economy is booming, the stock market will still go down because valuations go down in secular bear markets. I believe that is what is happening now.
So far our models have been telling us that inflation/deflation is pretty steady, and that�s where secular bear markets tend to start. Thus, it�s no surprise that we�re not seeing a lot of inflation or deflation � at least yet.
So what�s our new indicator telling us about inflation?
1) The CRB index
2) The price of Gold
3) The CPI and
4) The trend in interest rates.
Since the description of the model we�re now using is not in any of my books, I�ll continue to give it here.
1) The CRB Index. I believe that the CRB index is the one we have currently that is the least manipulated by the government. But what�s the best way to measure it? For consistency, I plan to give two measurements.
� Is the CRB index higher than it was six months ago? If it is, we are on track for inflation.
� Is the CRB index higher than it was two months ago?
Now there are several ways to monitor these two indices.
� If both differences are higher, we�ll count one star for inflation.
� If the six-month change is higher, but the two-month change is not, then we will only count � star for inflation.
� And if both the two and six month changes are lower, then we�ll be minus one for inflation.
� However, if the six-month change is lower, while the two-month change is higher, then we�ll be minus � star for inflation. Obviously, the two minus scores will point to deflation.
2) The Basic Materials Sector ETF (XLB). In an inflationary environment, basic materials will definitely go up and this sector, to the best of my knowledge, is not manipulated by the government. Thus, we will use this sector to monitor inflation and we�ll use the same measurements used for the CRB. (1) Is the XLB higher than it was six months ago; and (2) Is the XLB higher than it was two months ago. These two measurements give us four possible results.
� If both differences are higher, we�ll count one star for inflation.
� If the six-month change is higher, but the two-month change is not, then we'll only count � star for inflation.
� And if both the two and six month changes are lower, then we�ll be minus one for inflation.
� However, if the six-month change is lower, while the two-month change is higher, then we�ll be minus � star for inflation. Obviously, the two minus scores will point to deflation.
3) The London PM Gold price at the end of each month. Although the government can manipulate Gold, I still like to look at monthly gold prices. However, to be consistent, we�ll use the same two measurements that we�ve used for the other indices that we are monitoring. 1) Is the price higher than it was six months ago and 2) is the price higher than it was two months ago. Again, these two measurements give us four possible results.
� If both differences are higher, we�ll count one star for inflation.
� If the six-month change is higher, but the two-month change is not, then we'll only count � star for inflation.
� And if both the two and six-month changes are lower, then we�ll be minus one for inflation.
� However, if the six-month change is lower, while the two-month change is higher, then we�ll be minus � star for inflation. Obviously, the two minus scores will point to deflation.
4) The Fourth Measurement we�ll use is related to the Financial Sector of the S&P 500.
The financial sector (XLF) tends to do well when we have deflation and poorly when we have inflation. Martin Pring, in fact, has used an index in which he divides the XLB by the XLF. Since we already use the XLB, we�ll use the XLF by itself as well. Again, we�ll use the change over six months and over two months. However, the four possible outcomes with give us a different interpretation.
� If both differences are higher, we�ll count one star for deflation.
� If the six-month change is higher, but the two-month change is not, then we'll only count � star for deflation.
� And if both the two and six month changes are lower, then we�ll be plus one for inflation.
� However, if the six-month change is lower, while the two-month change is higher, then we�ll be plus � star for inflation. Obviously, the two minus scores will point to strong inflation.
Okay, so now let�s look at the results for the last six months.
|
Date |
CRB |
XLB |
Gold |
XLF |
|
May 27th |
300.09 |
28.03 |
418.25 |
29.33 |
|
June 30th |
306.91 |
27.12 |
437.10 |
29.50 |
|
July 29th |
317.78 |
28.64 |
429.00 |
29.93 |
|
September 2nd |
325.35 |
27.44 |
433.25 |
29.44 |
|
September 30th |
333.33 |
27.50 |
466.10 |
29.52 |
|
October 28th |
330.68 |
27.48 |
470.75 |
30.31 |
|
December 30th |
332.49 |
29.67 |
495.85 |
31.87 |
We�ll now look at the two-month and six-month changes during 2005, to see what our readings have been.
|
Date |
CRB2 |
CRB6 |
XLB2 |
XLB6 |
Gold2 |
Gold6 |
XLF2 |
XLF6 |
Total Score |
|
Oct 05 |
Higher |
Higher |
Higher |
Higher |
Higher |
Higher |
Higher |
Higher |
|
|
|
|
+1 |
|
+1 |
|
+1 |
|
-1 |
+2.0 |
The results of this model are much more sensitive (I believe) than the model I presented in Safe Strategies for Financial Freedom. The model seems to be signaling a struggle between inflation and deflation with inflation winning slightly. Notice that the increase in the price of gold over the last six months is quite dramatic (over 15%) and this has occurred while the dollar has been fairly strong (see below).
Part IV: Tracking the Dollar.
Before I get into a discussion of the dollar, I want to look at U.S. debt and repeat a little of what I said last month. The debt has now passed $8 trillion. In Safe Strategies for Financial Freedom, I showed the government statistics that included future obligations, giving us a debt of $31 trillion. Well, in February of 2005, Professor Kent Smetters during a congressional testimony said that our off budget debt was now $65 trillion. We�re now approach a future debt by our government of about $700,000 per household. Is your family�s net worth over $700,000?
What does this mean? Well, our economy is growing at about 3-4% per year. Our debt is growing at between 7-8% per year. This basically means that the dollar will eventually collapse or be inflated out of existence.
Look at the next Table, showing the dollar index over the past year.
|
The Dollar Index |
|
|
Month |
Dollar Index |
|
Jan 05 |
81.06 |
|
Feb 05 |
81.81 |
|
Mar 05 |
80.89 |
|
Apr 05 |
82.23 |
|
May 05 |
83.34 |
|
June 05 |
84.95 |
|
July 05 |
85.79 |
|
Aug 05 |
84.26 |
|
Sep 05 |
83.68 |
|
Oct 05 |
85.25 |
|
Nov 05 |
86.69 |
The dollar is now much higher than it was at the start of the year. This is because U.S. interest rates are starting to get higher and money is attracted to currencies with high interest rates. However, don�t expect too many more increases from the Federal Reserve or we will see a big time housing and stock market collapse.
What this all means.
Notice that gold has been going up (15% since May) while the dollar has been rising since March. This is certainly an interesting picture that suggests inflation. Also Matthew Bennett Inc. just held a rare stamp auction in New York. I didn�t bid on anything, but I did see four stamps that I would like to have and estimated that I would have been willing to pay up to $12,500 for those stamps. At that price I would not have considered my purchase to be a bargain, but I would have been okay with them. Anyway, the four stamps sold for $32,085, including the 15% buyers premium. Thus, as I�ve been saying lately, rare stamps are also reflecting an inflationary market. Incidentally, there was enough interest in my rare stamp column that I plan to write several more articles over the next few months. Watch for them.
Our big picture still suggests a long-term BEAR market. The secular bear began in 2000, but conditions are ripe for one to start even at current levels. Plus debt continues to grow faster than the economy. So something must happen to correct it all. However, who knows when that will happen. This is not about prediction, it�s about looking at conditions influencing the economy and seeing what happens. There will always be good ways to make money if you are willing to work on yourself to get past your fear, greed, and other emotions to just see what is going on in front of you.. So let�s continue to watch the market for more signs. Until the end of December update on the market�..this is Van Tharp.
About Van Tharp: World�renowned trading coach, author and psychologist Dr. Van K Tharp, is widely recognized for his best-selling book Trade Your Way to Financial Fre-edom and his outstanding Peak Performance Home Study program - a highly regarded classic that is suitable for all levels of traders and investors.
Gold Is Exploding: Which Senior Gold Stocks Are Performing?
by D. R. Barton, Jr.
�Enough is too little. More is better. Too much is just right. �
--Shade tree mechanic sayingThe gold bugs and gold bulls are finally having their day.
Many folks have been on the right side of this move in gold, notably Dr. Steve Sjuggerud who co-authored Safe Strategies for Financial Freedom with Van and me. But what�s a trader to do now if you aren�t in on the fun?
Gold has now doubled from its lows of around $250. How much more gas does it have in the tank for a continued upside push? There are decent arguments for both sides of that debate. But for now, the bulls clearly have the upper hand and the more logical arguments. Supply is not improving, demand for retail gold (jewelry, etc.) is increasing and long term economic worries outweigh the negative case for gold, at least for now.
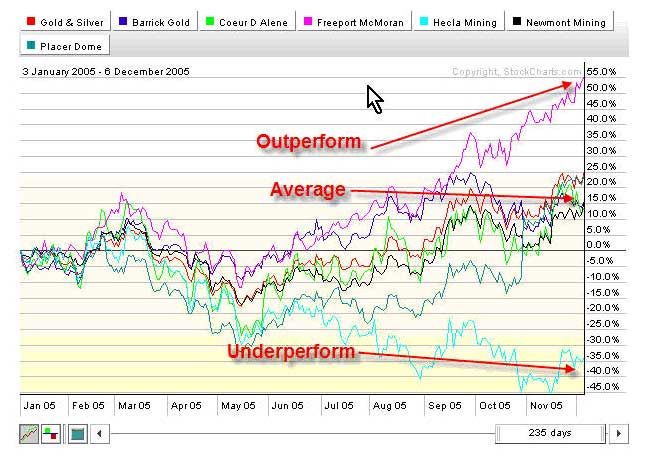
So what can a trader or investor do now? There are two relatively simple choices � buy breakouts to new highs (for momentum players) or buy any weakness (for more patient players). One can play the futures or stocks. But which stocks are performing? The following chart gives us the relative performance for all of the stocks that make up the Philadelphia Exchange Gold and Silver Index (Symbol: $XAU):
Clearly, Freeport McMoran has outperformed its peers, while Newmont, Barrick, Coeur d�Alene and Placer Dome are clumped together between 10 and 20% returns for the year. Hecla Mining is the clear loser and if you get bearish on the precious metal sector this is clearly the stock to short.
On a percentage basis, Freeport McMoran has outperformed even the glistening metal itself this year. Its diversified production of gold, silver and copper have helped. You could do much worse than playing this stock if you expect continuing strength in the precious metals.
As with any sectors, all gold stocks are not created equal. Choose to play strong sectors with strong stocks, and weak sectors with weak stocks.
Great Trading,
D. R.
D. R. Barton, Jr. is the Chief Operating Officer and Risk Manager for the Directional Research and Trading hedge fund group. D. R. has been actively involved in trading, researching, and teaching in the markets since 1986. D. R. has taught extensively in many investment areas including intra-day trading, swing trading, and cutting edge risk management techniques.
His writing credits include co-authoring Safe Strategies for Fin-ancial Fre-edom and co-creator and contributing author on Fin-ancial Fre-edom Through Electronic Day Trading.
How to Become Ambitious?
Author: P.H.
Date: 12-04-05 10:56
Hello,
I have been trading for six years for a living now and have reached some kind of "performance ceiling" I cannot break through. The reason for this is truly a lack of ambition. I am just too modest and undemanding. There are no monetary goals that can empower me to risk more to get more and bigger wins. I am not competitive, but I am often annoyed about the fact I could win much more money if I would be more ambitious. It is a just a question of time when a severe drawdown will hit me like any other trader and this could be
disastrous if I do not earn more money.
So, how can I become more ambitious to grow my equity?
Reply To This Message
Re: How to become ambitious?
Author: T.L.
Date: 12-04-05 13:08
Hello PH,
It's unusual to find someone who characterizes themselves as being uncompetitive when they have made a living from trading over the last six years.
A couple things struck me about your post. Do you spend all of your earnings?...or do you plow some of it back into your account? Growing equity is more a function of position sizing than "ambition".
Secondly, I was wondering if maybe you just need to take a break from trading? Trading can certainly be exhausting. Maybe an extended break is what you need to recharge yourself!
Regards, T.L.
Reply To This Message
Re: How to Become Ambitious?
Author: PH
Date: 12-04-05 14:40
Hello TL,
Thank you for your fast answer.
Yes, it is unusual to characterize myself as uncompetitive. I started trading on a shoestring. Small size was important to protect my equity while learning to trade. When I decided to trade for a living the traded size did not grow. I still traded small size, because it was enough to pay my dues. So all the earnings have been
spent. That means I still trade with
relatively small equity. And that is the point that annoys me. I could be wealthy today if the traded size had grown
appropriately to my knowledge of the markets. And this is because I never had any ambition to become rich or to become the best trader I could be for example.
A break could be a good idea. I feel like running against a wall many times. But the best would be to find a way to get rid of my habits and
thoughts that block me. Maybe extended visualizations of myself being successful and competitive and becoming somehow popular etc. could help. But somehow I do not feel comfortable this way either.
Any ideas to help me?
Best regards,
Paul
Reply To This Message
Re: How to become ambitious?
Author: TL
Date: 12-04-05 17:23
Hi Paul,
You don't seem to have any problems trading. Supporting yourself over the last six years is proof of that. The only problem I see is one of "confidence".
Being the "richest" trader in the world or the "best" trader are such amorphous issues..... at the very least, they are silly and at best, unrealized.
Most traders would be very pleased to live off their profits as you have. You need to step back a bit... you are pressing too hard! Step back, take a deep breath, and stop thinking for a while. Take a rest and then take a good hard look at position sizing from the point of view of the positive expectancy system you already have.
You're too hard on yourself...
p.s. There is an interesting book called "Zen Keys" by Thich Nhat Hanh. He always seems to put things in the right perspective for me. You might find it useful for yourself.
Good luck to you in your trading!
Reply To This Message
Re: How to become ambitious?
Author: Level 7
Date: 12-05-05 09:57
I also think that that you are competitive judging by your success in the markets. Market success require some level of competitiveness
IMO [in my opinion]. This may be something you don't like to know. Perhaps your friends can help with discussing and resolving this.
BTW [by the way], there is a kernel of ambition since you asked the question. If you truly had none, IMO there would be no question!
My own trouble was I didn't take enough risks in the market because I didn't want to lose money either. Consequently I have not missed beating my benchmark in 5 years. Unfortunately, a ceiling also appears IMO because of the same decisions I make. Maybe you are like me.
I took the Trading Evaluation [profile] offered by Van and realized I need to take more risk even though it triggered my fears of poverty when I am 90. I still struggle with it while my wife and family laugh at my fears. Rationally I understand it but emotionally it is a real fear. I need to face my fear.
I suspect the reasons for your issue is your belief "... question of time when a severe drawdown will hit me ..." triggers your fears and hinders you.
"Small size was important to protect my equity while learning". This one was true but elsewhere in your posts you hint that it is not true anymore. At least it seems that way to me.
There are other things you said and if you read them carefully, they may pop out at you
similarly to what happened to me when I thought about it after taking Van's course and evaluation.
If your lack of ambition is caused by boredom then there are certain things you can do. If it is caused by fear, then one could choose something like I do: take more risk even knowing that I can lose more and trusting myself to win overall in the long run. Do this in little stages until the fear is conquered. This seems to be working for me.
Hopefully, I have not be rude in my reply. It helps me to look at an outside person and relate it back to me. I hope it helps you to think about me as well.
Editors Note: If you relate to the topics in this thread, especially issues concerning fear, greed and confidence, this forms the basis of Dr. Tharp's work and is extensively covered in the Peak Performance Home Study Course. (Click here to learn about this course.)
As Always...read the complete and unedited thread at the link below. Look for the title, "How to Become Ambitious?" to read more posts.
Special Reports By Van Tharp
Click below to read page one of each report, or to order.
Do Not Reply to this email using the reply button as the email address is not monitored. Please click this link contact us: [email protected]
The Van Tharp
Institute does not support spamming in any way, shape or form. This is a subscription
based newsletter. If you no longer wish to subscribe, Unsubscribe
Here.
