Tharp�s Thoughts
Market
Update
for
Period Ending October 31, 2005
1-2-3 Model Still in Red Light Mode
By Van K. Tharp, Ph.D.
Look for these monthly updates on the first issue of each month. This allows us to get the closing month data. In these updates, we�ll be covering each of the major models mentioned in the Safe Strategies book.
Starting last month, I�ve also added something new, our efficiency indicator. The stock market might not be doing much, but it is still interesting to note the percentage of stocks with positive and negative efficiencies.
Part I: Market Commentary.
The market seems to be continuing its trend of doing nothing by going sideways.
In addition, the major indices have totally masked what has really happened to the market over the past month. In general, the market has turned down in a big way. My efficiency index (which currently tracks nearly 5,000 stocks) has gone from 60% positive efficiency about six weeks ago to 42% positive efficiency. In addition, in that large list I have 44 stocks with efficiencies above plus 10, but 131 with efficiencies below minus 10. In fact, very seldom do I see this many good �shorting� candidates. Katrina might have had more impact on the stock market than meets the eye if you watch CNBC or just watch the market averages to determine what is going on today. Be careful in this market.
Part II: The 1-2-3 Stock Market Model IS IN RED LIGHT MODE.
What the market is doing? All three major averages are down for the year � although the S&P 500 is just below where it was on December 31, 2004. And all three averages are down for the month. In addition, all three averages are down over the last five weeks, which is enough to give us a bear market mutual fund trading signal (see Safe Strategies for Financial Freedom), but no averages are down 2.5% on the week which is our entry signal.
I suspect that most of the mutual funds, which are required to be fully invested and are trying to outperform the market averages, are moving more and more toward owning those averages (i.e., they are buying the stocks that comprise the averages). Thus, the averages (at least for a while) are masking what is going on in the underlying market. And that may last for a while because we are now in the seasonal time of year when lots of money gets added to retirement funds and the stock market tends to go up. Let�s see if that happens under these conditions in 2005.
So let�s look at what the market has done over the last five weeks and compare that with where the averages were December 31st last year. This is given in the next table. Incidentally, this data is calculated by hand based upon last Friday�s close (October 28, 2005), so there is always a possibility of human error in our numbers.
Weekly Changes in the Major Stock Market Indices |
||||||
|
Date Week Ending |
DOW 30 |
Change |
SP500 |
Change |
NAS 100 (NDX) |
Change |
|
12/31/04 |
10,783.01 |
|
1211.12 |
|
1621.12 |
|
|
9/30/05 |
10,568.70 |
+1.4% |
1228.81 |
+1.1% |
1601.66 |
1.9% |
|
10/7/05 |
10,238.34 |
+0.5% |
1195.90 |
-2.7% |
1555.92 |
-2.8% |
|
10/14/05 |
10,287.34 |
+0.5% |
1186.57 |
-0.8% |
1544.29 |
-0.7% |
|
10/21/05 |
10,215.22 |
-0.7% |
1179.59 |
-0.6% |
1565.12 |
+1.3% |
|
10/28/05 |
10,402.77 |
+1.8% |
1198.41 |
+1.6% |
1557.11 |
-0.7% |
Efficient stocks. I�m again doing my efficiency scans on the market. My strategy is to short the percentage of stocks that show negative efficiency (i.e., now about 58%) and go long the percentage of stocks that show positive efficiency. The efficient stocks seem to generally go up, no matter what the market is doing and the inefficient stocks go down. The strategy seems to produce returns of about 10% per month. See Safe Strategies for Financial Freedom for a discussion of efficient stocks and how to trade them. As I mentioned earlier, however, there has been a dramatic shift toward stocks showing negative efficiency since the last update. Last month there were 90 stocks above plus ten and this month there are only 44. In addition, last month there were 21 stocks below minus ten and this month, there are 131. That�s a pretty dramatic shift.
The top efficient stocks include SNDK, ESRK, ASF, GOOG, NDAQ and INGR. INGR, shown in the Chart One, is now my favorite.
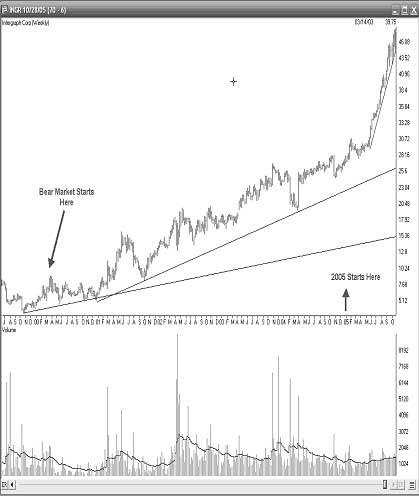
It is the first stock I�ve seen that has not shown any negative effect from the secular bear market. Look at Chart One from 2000 to date � it�s straight up. And look at 2005 � the up- trend is accelerating. Of course, Tharp�s law is that if I show it to you, then the trend will end. But this stock looks good enough to even overcome that law. ASF, which I showed last month, is still going up nicely.
However, the negative efficiency stocks are even better. There are many good candidates such as MOVI (which I showed a chart of last month) AGL, PXT, LXK, and ENG. They all have nice downward action. I suspect MOVI, which rents videos to the public could go below a dollar or even to bankruptcy. However, there are also some nice high priced stocks which are breaking trendlines, and have even more downward potential.
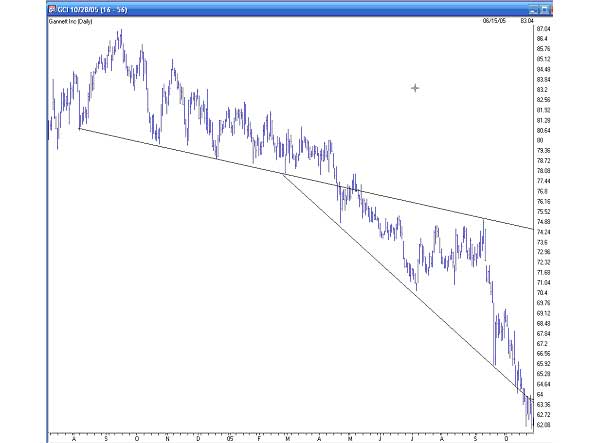
The newspaper stocks seem to fall into this category � possibly because people are using the Internet to get their news, rather than getting newspapers. Take a look at NYT (New York Times), and GCI (Gannett). Gannett shows the largest negative efficiency at � 10.61. It�s shown in the graph above. What do you think the potential downside is here?
Incidentally, since I trade this strategy, I may or may not, have positions in the stocks that I mention. However, these examples are given for educational purposes and you should do your own due diligence if you decide to trade them.
Part III: Our Four Star Inflation-Deflation Model.
Before I get into this month�s inflation-deflation discussion, I want to talk about the secular bear market. I credit much of this information to Ed Easterling of Crestmont research. Ed believes that markets move from periods of low valuation (i.e, high paying dividends and low PE ratios) to periods of high valuation (i.e., low paying dividends and high PE ratios) and vice versa. When PE ratios go up, we have secular bull markets such as 1982 to 2000. These typically begin from periods of high inflation (or deflation) and end when inflation is very stable (i.e., at 1% to 2% like now). When PE ratios go down, we have secular bear markets. These typically start from periods of stable inflation (like now) and high PE ratios (i.e., the S&P 500 is above 20 now which is considered high) and will last for 15-20 years. Thus, even if the economy is booming, the stock market will still go down because valuations go down in secular bear markets. I believe that is what is happening now.
So far our models have been telling us that inflation/deflation is pretty steady, and that�s where secular bear markets tend to start. Thus, it�s no surprise that we�re not seeing a lot of inflation or deflation � at least not yet.
So what�s our new indicator telling us about inflation?
1) The CRB index
2) The price of Gold
3) The CPI and
4) The trend in interest rates.
Since the description of the model we�re now using is not in any of my books, I�ll continue to give it here.
1) The CRB Index. I believe that the CRB index is the one we have currently that is the least manipulated by the government. But what�s the best way to measure it? For consistency, I plan to give two measurements.
� Is the CRB index higher than it was six months ago? If it is, we are on track for inflation.
� Is the CRB index higher than it was two months ago?
Now there are several ways to monitor these two indices.
� If both differences are higher, we�ll count one star for inflation.
� If the six-month change is higher, but the two-month change is not, then we'll only count a half star for inflation.
� And if both the two and six month changes are lower, then we�ll be minus one for inflation.
� However, if the six-month change is lower, while the two-month change is higher, then we�ll be minus � star for inflation. Obviously, the two minus scores will point to deflation.
2) The Basic Materials Sector ETF (XLB). In an inflationary environment, basic materials will definitely go up and this sector, to the best of my knowledge, is not manipulated by the government. Thus, we will use this sector to monitor inflation and we�ll use the same measurements use for the CRB. (1) Is the XLB higher than it was six months ago; and (2) Is the XLB higher than it was two months ago. These two measurements give us four possible results.
� If both differences are higher, we�ll count one star for inflation.
� If the six-month change is higher, but the two-month change is not, then we will only count a half star for inflation.
� And if both the two and six month changes are lower, then we�ll be minus one for inflation.
� However, if the six-month change is lower, while the two-month change is higher, then we�ll be minus a half star for inflation. Obviously, the two minus scores will point to deflation.
3) The London PM Gold price at the end of each month. Although the government can manipulate gold, I still like to look at monthly gold prices. However, to be consistent, we�ll use the same two measurements that we�ve used for the other indices that we are monitoring. 1) Is the price higher than it was six months ago and 2) is the price higher than it was two months ago? Again, these two measurements give us four possible results.
� If both differences are higher, we�ll count one star for inflation.
� If the six-month change is higher, but the two-month change is not, then we will only count a half star for inflation.
� And if both the two and six-month changes are lower, then we�ll be minus one for inflation.
� However, if the six-month change is lower, while the two-month change is higher, then we�ll be minus a half star for inflation. Obviously, the two minus scores will point to deflation.
4) The Fourth Measurement we�ll use is related to the Financial Sector of the S&P 500.
The financial sector (XLF) tends to do well when we have deflation and poorly when we have inflation. In fact, Martin Pring has used an index in which he divides the XLB by the XLF. Since we already use the XLB, we�ll use the XLF by itself as well. Again, we�ll use the change over six months and over two months. However, the four possible outcomes will give us a different interpretation.
� If both differences are higher, we�ll count one star for deflation.
� If the six-month change is higher, but the two-month change is not, then we will only count � star for deflation.
� And if both the two and six month changes are lower, then we�ll be plus one for inflation.
� However, if the six-month change is lower, while the two-month change is higher, then we�ll be plus � star for inflation. Obviously, the two minus scores will point to strong inflation.
Okay, so now let�s look at the results for the last six months.
|
Date |
CRB |
XLB |
Gold |
XLF |
|
April 30th |
303.75 |
28.01 |
435.70 |
28.44 |
|
May 27th |
300.09 |
28.03 |
418.25 |
29.33 |
|
June 30th |
306.91 |
27.12 |
437.10 |
29.50 |
|
July 29th |
317.78 |
28.64 |
429.00 |
29.93 |
|
September 2nd |
325.35 |
27.44 |
433.25 |
29.44 |
|
September 30th |
333.33 |
27.50 |
466.10 |
29.52 |
|
October 28th |
330.68 |
27.48 |
470.75 |
30.31 |
We�ll now look at the two-month and six-month changes during 2005, to see what our readings have been.
|
Date |
CRB2 |
CRB6 |
XLB2 |
XLB6 |
Gold2 |
Gold6 |
XLF2 |
XLF6 |
Total Score |
|
Oct 05 |
Higher |
Higher |
Higher |
Lower |
Higher |
Higher |
Higher |
Higher |
|
|
|
|
+1 |
|
-1/2 |
|
+1 |
|
-1 |
+0.5 |
The results of this model are much more sensitive (I believe) than the model I presented in Safe Strategies for Financial Freedom. The model seems to be signaling a struggle between inflation and deflation with inflation winning slightly.
Part
IV: Tracking the Dollar.
Before I get into a discussion of the dollar, I want to look at U.S. debt. The debt has now passed $8 trillion. Let�s look at that historically for some perspective.
1974 (Nixon presidency ends) -- $492 billion
1980 (Carter presidency ends) -- $930 billion (and Carter was thought to have mismanaged the economy dramatically)
1988 (Reagan presidency ends) -- $2.6 trillion
1992 (Bush, Sr. presidency ends) -- $4.0 trillion
2000 (Clinton presidency ends) -- $5.6 trillion
2005 � it�s now $8 trillion � perhaps $11 trillion by the time Bush Jr. is out.
It looks like Clinton did a wonderful job during his 8 years, however, during Clinton�s administration the Social Security Trust Fund was raided big time (making the deficit look better). Also government revenues went up dramatically when the Roth IRA was introduced � everyone paid a one-time tax of 10% to convert. But this was just another example of stealing from future revenues to make the current deficit look less. Bush hasn�t had that luxury, because Clinton already did it.
In Safe Strategies for Financial Freedom, I showed the government statistics, which included future obligations, giving us a debt of $31 trillion. Well, in February of 2005, Professor Kent Smetters during a congressional testimony said that our off budget debt was now $65 trillion. We�re now approaching a future government debt of about $700,000 per household. Is your families net worth over $700,000?
What does this mean? Well, our economy is growing at about 3-4% per year. Our debt is growing at between 7-8% per year. This basically means that the dollar will eventually collapse or be inflated out of existence.
Look at the next Table, showing the dollar index over the past months.
|
The Dollar Index |
|
|
Month |
Dollar Index |
|
Jan 05 |
81.06 |
|
Feb 05 |
81.81 |
|
Mar 05 |
80.89 |
|
Apr 05 |
82.23 |
|
May 05 |
83.34 |
|
June 05 |
84.95 |
|
July 05 |
85.79 |
|
Aug 05 |
84.26 |
|
Sep 05 |
83.68 |
|
Oct 05 |
85.25 |
The dollar is now much higher than it was at the start of the year. This is because U.S. interest rates are starting to get higher and money is attracted to currencies with high interest rates. However, don�t expect too many more increases from the Federal Reserve or we will see a big time housing and stock market collapse.
What this all means.
Our big picture still suggests a long-term BEAR market. The secular bear began in 2000, but conditions are ripe for one to start even at current levels. Plus debt continues to grow faster than the economy. So something must happen to correct it all. However, who knows when that will happen. This is not about prediction, it�s about looking at conditions influencing the economy and seeing what happens. So let�s continue to watch the market for more signs. Until the end of November update on the market�..this is Van Tharp.
About Van Tharp: World�renowned trading coach, author and psychologist Dr. Van K Tharp, is widely recognized for his best-selling book Trade Your Way to Financial Fre-edom and his outstanding Peak Performance Home Study program - a highly regarded classic that is suitable for all levels of traders and investors.
Psychology of Trading Series
Presented by Van K. Tharp
Eight Part Audio CD Series
Learn the tools and techniques that you need to transform your trading and investing results.
Make bigger, more consistent profits with less stress.
The Eight CD Series covers the following topics:
-
The Psychology of Discipline
-
Belief Change and Mental State Control
-
How to Fix Mistakes and Two Tasks of Trading--Rehearsal and Daily Debrief
-
Games People Play
-
Self-Sabotage
-
Creating Your Future by Goal Setting and Manifesting
- Personality Type and Trading
Profit Targets vs. Trailing Stops � Another Luminary Weighs In
by D. R. Barton, Jr.
I�m reading through an advanced copy of a new trading book that will be out in two weeks. (For all of you who can�t wait for Van�s new book on position sizing � this isn�t it, though I�m reading through that one as well� and it�s worth the wait!). As I�m reading, I note that another luminary has jumped in to answer the age-old question about profit taking exits vs. trailing stops.
Here�s the problem.
Determining how to take your profits in a trade is of paramount importance. In general, this part of your system is much more important than figuring out where to enter.
But there�s a bigger problem.
Everyone wants a simple solution. People like black and white answers. Answers with �always� or �never� in them.
And, at last, the biggest problem:
There is no simple solution. Our exits, more than anything else, require lots of thought. And continuous assessment. There is no one best solution.
Now for the good news�
There are useful guidelines for optimum exits for most standard trading strategies. That�s a relief. As I have written in this space many times before, the most useful way to approach profit taking exits is to make sure that they match your system�s underlying beliefs � the reasons why your system works.
For long- term, trend following systems this means finding some way to stick with a trend. Trailing stops are quite useful here. In fact, using a profit target would harm the performance of many long-term strategies.
The other end of the spectrum shows us channel-trading systems where you take profits and reverse your position when a predefined channel is hit. There is no place for a trailing stop in this basic system.
Ah, but what about all of the systems that lie in between these two extremes?
Back in the day, when trend-following was king and long- term position trading was the only method getting any press, using a profit target or anything other than a trailing stop was considered heresy. And for that type of system, it probably is. But many folks read stuff that was written for a largely trend following audience (including some of Van's early work) and make broad conclusions that profit taking exits are never useful. Questions about this show up on trading forums (including Van�s Mastermind forum) all the time.
But more and more, I see good traders and system designers using hybrid exit strategies to optimize their results. Taking partial profits is not heresy if the exit strategy helps to capitalize on the strengths of the system design. Markets, even trending ones, have become more choppy than ever before. �Three steps up and two steps back� has become the normal operation in many markets.
Trading professionals adjust for this by taking partial profits at pre-determined profit targets. They may let the rest of the position follow the trend. Or they might take the rest off at a higher pre-determined level. It all depends on whether the strategy is designed to capitalize on really big trends or not.
This brings me back to the book draft that I�ve been reading. Another seasoned pro who has made consistent profits in the markets talks about his exit strategy. He takes 1/3 of his position off at a small gain, just to put the trade in the black. He then takes 1/3 off when the trade has made a bit more than he risked. The last one-third is used to trail a stop and try to stick with a longer term trend.
Next week I�ll tell you more about the psychology of profit taking exits.
Until then, great trading!
D. R. Barton, Jr. is the Chief Operating Officer and Risk Manager for the Directional Research and Trading hedge fund group. D. R. has been actively involved in trading, researching, and teaching in the markets since 1986. D. R. has taught extensively in many investment areas including intra-day trading, swing trading, and cutting edge risk management techniques.
His writing credits include co-authoring Safe Strategies for Fin-ancial Fre-edom and co-creator and contributing author on Fin-ancial Fre-edom Through Electronic Day Trading.
Screening Help
Author: Scott
Good morning to all you far-more-experienced-than-I-am traders!!
I'm hoping one or more of you can point me to a (hopefully free, but other if need be) screener that will help me find stocks & ETFs that are:
- Under $20
- Have relatively high volatility (making for good covered call option selling)
- Are relatively stable companies/funds with decent fundamentals (I know this might be somewhat at odds with the volatility desire, but I don't want to stock up on dogs that are going to make me have to scramble out of covered calls all the time either).
Thanks much!!
Scott
Reply To This Message
Re: Screening Help???
Author: PMK
Date: 11-02-05 09:14
Scott,
You will need to be a bit more precise about how you are defining 'volatility', and what 'high' is for you.
You also need to define 'stable' and 'decent fundamentals'.
As for recommended screeners, take a look at this earlier forum thread:
http://mastermindforum.com/phorum/read.php?f=9&i=9653&t=9653
Hope this helps
Paul
Reply To This Message
Re: Screening Help???
Author: Scott
Date: 11-02-05 09:22
Hi Paul!
Well, that's part of my problem. I don't know what numbers or parameters to wrap around those measures.
What I'm trying to do is stock my portfolio (one part of it, anyway) with good candidates for making ongoing covered call income. I know I need stocks/ETFs that have "enough" volatility to make it profitable to sell covered calls. I need enough of them so that I can sell a decent number of contracts (hence the lower price), but I don't want to pick up "any old" stock/ETF. I'd like to pick up something that's not going to fall off the face of the earth, or has no fundamental basis for long-term existence.
Thanks much!!
Scott
Reply To This Message
Re: Screening Help
Author: Ken Long
Stockcharts.com has a free version of their screening engine that�s pretty useful
U might consider measuring for "enough volatility" by dividing Average True Range by price to be able to compare the amount of recent volatility of stocks/ETFs that have different share price. example an ATR of 3 on a $100 ETF is much less volatile than an ATR of 2 on a $40 ETF.
with ETFs you will be challenged to assess the stability and fundamentals of the components, but then because of the diversification that's probably less of an issue, particularly the broader your ETF.
Special Reports By Van Tharp
Click below to read page one of each report, or to order.
Do Not Reply to this email using the reply button as the email address is not monitored. Please click this link contact us: [email protected]
The Van Tharp
Institute does not support spamming in any way, shape or form. This is a subscription
based newsletter. If you no longer wish to subscribe, Unsubscribe
Here.
