Tharp�s Thoughts
Market Update for Period Ending September 2005
1-2-3 Model Still in Red Light Mode
By
Van K. Tharp
Look for these monthly updates on the first issue of each month. This allows us to get the closing month data. In these updates, we�ll be covering each of the major models mentioned in the Safe Strategies book.
Starting this month, I�ve also added something new, our efficiency indicator. The stock market might not be doing much, but it is still interesting to note the percentage of stocks with positive and negative efficiencies. In addition, I�ll also mention some of the most efficient stocks, both positive and negative.
Part I: Market Commentary.
The market seems to be continuing its trend of doing nothing by going sideways. However, when inflation is strong enough to produce a boom in housing and oil prices hitting $70/barrel, a stock market that does nothing is clearly in a bear cycle as we�ve been saying for some time. Katrina should have a major impact on the US economy and we should see the impact. Can you remember when you paid $0.99 for a gallon of gasoline? Wasn�t that just a few years ago? And did you pay over $3.00 per gallon this weekend? This market is looming more and more like the sideways inflationary market that we had from 1966 through 1982 with the Dow 30 bouncing between 500 and 1000. Perhaps in this climate it will bounce between 7000 and 11000 over the next 15 years.
The 1-2-3 Stock Market Model IS IN RED LIGHT MODE. BE CAREFUL.
What the market is doing? Just like last month, two of the major averages are still down for the year. The stock market is slightly up over the month, but the amount of change is miniscule. It�s just being a very subtle bear, making it hard for anyone to take much money out of the market. It�s probably nibbling most of you to financial ruin � but just a few percent each month.
So let�s look at what the market has done over the last five weeks and compare that with where the averages were December 31st last year. This is given in the next table.
Incidentally, this data is calculated by hand based upon last Friday�s close (i.e., September 30, 2005), so there is always a possibility of human error in our numbers.
Weekly Changes in the Major Stock Market Indices |
||||||
|
Date Week
Ending |
DOW
30 |
Change |
SP500 |
Change |
NAS
100 (NDX) |
Change |
|
12/31/04 |
10,783.01 |
|
1211.12 |
|
1621.12 |
|
|
9/2/05 |
10,447.03 |
+0.5% |
1218.02 |
+1.1% |
1573.12 |
+0.9% |
|
9/9/05 |
10,678.56 |
+2.2% |
1241.48 |
+1.9% |
1607.83 |
+2.2% |
|
9/17/05 |
10,641.94 |
-0.3% |
1231.02 |
-0.8% |
1586.05 |
-1.4% |
|
9/23/05 |
10,419.59 |
-2.1% |
1215.29 |
-1.3% |
1571.75 |
-0.9% |
|
9/30/05 |
10,568.70 |
+1.4% |
1228.81 |
+1.1% |
1601.66 |
+1.9% |
So over the past month we�ve experienced the aftereffects of two major hurricanes. The Federal Reserve, despite the economic devastation, continued to raise interest rates and will probably do so at least two more times. However, the market seems quite resilient and doesn�t fall. I find that quite amazing.
Efficient stocks. I�m again doing my efficiency scans on the market. I currently buy about 20 of the most efficient stocks and short about 10 of the most inefficient stocks. The efficient stocks seem to generally go up, no matter what and the inefficient stocks go down. The strategy seems to produce returns of about 10% per month. See Safe Strategies for Financial Freedom for a discussion of efficient stocks and how to trade them. As of October 3rd, there were 90 stocks with an efficiency rating above plus 10 and there were 21 stocks with an efficiency rating below minus 10. Thus, smart traders can still make money in this market on the long side. Overall, about 60% of the stock market shows a positive efficiency while about 40% shows a negative efficiency.
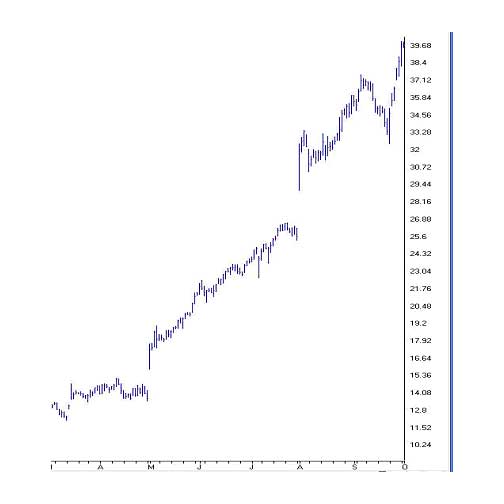
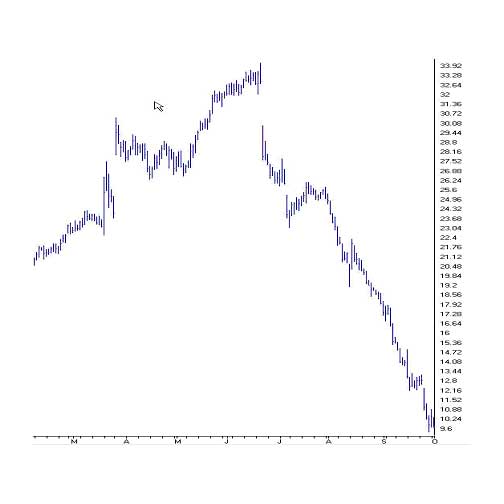
The top efficient stocks, SWN, ASF, STR, TXU, and FTO, while the top negative efficiency stocks are MOVI, AGL, and FNM. Incidentally, since I trade this strategy I may, or may not, own the stocks that I mention. However, these examples are given for educational purposes and you should do your own due diligence if you decide to trade them.
Let�s take a look at ASF, which has been at the top of the radar screen for two months. Notice from the chart above that the stock basically just goes up. Will it stop? I purchased it at about 34 and have to watch it go down about 5%. But I have a nice profit now and my assumption is that if you buy enough stocks that have chart patterns like these and practice my most important teachings, then you will do fairly well with this strategy.
Let�s also look at a chart of my favorite negative efficiency stock, MOVI. It�s certainly gone down nicely and it has nearly ten more points before it reaches zero. Will it go to zero? I don�t know. Can you make money shorting such a stock? Many of them keep going down and the results can be quite good. I shorted this stock at $12.49 and as I write this it is at $9.43. If it starts to flatten out or reverse, I�ll be out.
I will be presenting on how to trade efficient stocks at the AIQ meeting in Lake Tahoe on October 19th. Anyone interested in attending can call AIQ at 1-800-332-2999. I think the hotel is already sold out, but there is probably still space in the room. And I�m the keynote speaker at the conference. I made a portfolio of my 10 best stocks in terms of efficiency and we'll see how they do over the next six weeks.
The end of the summer is typically not a strong time of the market. The market likes to go down big time in the fall, so be careful. And now we have the impact of Katrina and Rita � and if the Federal Reserve seems committed to continue to raise interest rates � watch out.
Part III: Our Four Star Inflation-Deflation Model.
So what�s our new indicator telling us about inflation?
1) The CRB index
2) The price of Gold
3) The CPI and
4) The trend in interest rates.
Since the description of the model we�re now using is not in any of my books, I�ll continue to give it here.
1) The CRB Index. I believe that the CRB index is the one we have currently that is the least manipulated by the government. But what�s the best way to measure it? For consistency, I plan to give two measurements.
� Is the CRB index higher than it was six months ago? If it is, we are on track for inflation.
� Is the CRB index higher than it was two months ago?
Now there are several ways to monitor these two indices.
� If both differences are higher, we�ll count one star for inflation.
� If the six-month change is higher, but the two-month change is not, then will only count a half star for inflation.
� And if both the two and six month changes are lower, then we�ll be minus one for inflation.
� However, if the six-month change is lower, while the two-month change is higher, then we�ll be minus � star for inflation. Obviously, the two minus scores will point to deflation.
2) The Basic Materials Sector ETF (XLB). In an inflationary environment, basic materials will definitely go up and this sector, to the best of my knowledge, is not manipulated by the government. Thus, will use this sector to monitor inflation and we�ll use the same measurements use for the CRB. (1) Is the XLB higher than it was six months ago; and (2) Is the XLB higher than it was two months ago. These two measurements give us four possible results.
� If both differences are higher, we�ll count one star for inflation.
� If the six-month change is higher, but the two-month change is not, then we will only count a half star for inflation.
� And if both the two and six month changes are lower, then we�ll be minus one for inflation.
� However, if the six-month change is lower, while the two-month change is higher, then we�ll be minus a half star for inflation. Obviously, the two minus scores will point to deflation.
3) The London PM Gold price at the end of each month. Although the government can manipulate Gold, I still like to look at monthly gold prices. However, to be consistent, we�ll use the same two measurements that we�ve used for the other indices that we are monitoring. 1) Is the price higher than it was six months ago and 2) is the price higher than it was two months ago. Again, these two measurements give us four possible results.
� If both differences are higher, we�ll count one star for inflation.
� If the six-month change is higher, but the two-month change is not, then we will only count a half star for inflation.
� And if both the two and six-month changes are lower, then we�ll be minus one for inflation.
� However, if the six-month change is lower, while the two-month change is higher, then we�ll be minus a half star for inflation. Obviously, the two minus scores will point to deflation.
4) The Fourth Measurement we�ll use is related to the Financial Sector of the S&P 500.
The financial sector (XLF) tends to do well when we have deflation and poorly when we have inflation. In fact, Martin Pring has used an index in which he divides the XLB by the XLF. Since we already use the XLB, we�ll use the XLF by itself as well. Again, we�ll use the change over six months and over two months. However, the four possible outcomes will give us a different interpretation.
� If both differences are higher, we�ll count one star for deflation.
� If the six-month change is higher, but the two-month change is not, then will only count � star for deflation.
� And if both the two and six month changes are lower, then we�ll be plus one for inflation.
� However, if the six-month change is lower, while the two-month change is higher, then we�ll be plus � star for inflation. Obviously, the two minus scores will point to strong inflation.
Okay, so now let�s look at the results for the year.
|
Date |
CRB |
XLB |
Gold |
XLF |
|
March 31st |
311.02 |
30.16 |
427.15 |
28.39 |
|
April 30th |
303.75 |
28.01 |
435.70 |
28.44 |
|
May 27th |
300.09 |
28.03 |
418.25 |
29.33 |
|
June 30th |
306.91 |
27.12 |
437.10 |
29.50 |
|
July 29th |
317.78 |
28.64 |
429.00 |
29.93 |
|
September 2nd |
325.35 |
27.44 |
433.25 |
29.44 |
|
September 30th |
333.33 |
27.50 |
466.10 |
29.52 |
We�ll now look at the two-month and six-month changes during 2005, to see what our readings have been.
|
Date |
CRB2 |
CRB6 |
XLB2 |
XLB6 |
Gold2 |
Gold6 |
XLF2 |
XLF6 |
Total Score |
|
Sep 05 |
Higher |
Higher |
Lower |
Lower |
Higher |
Higher |
Lower |
Higher |
|
|
|
|
+1 |
|
-1 |
|
+1 |
|
-1/2 |
+0.5 |
The results of this model are much more sensitive (I believe) than the model I presented in Safe Strategies for Financial Freedom. The model seems to be signaling a struggle between inflation and deflation with inflation winning slightly.
Part IV: Tracking the Dollar.
Look at the next Table, showing the dollar index over the last five months and comparing it with its price at the close of the last three years. I�ve found a table of government figures that is easier for me to track. The values are slightly different from what I�ve been using, but the trends are still easy to see. The fact that the numbers are different just shows that the government can simply change the way they calculate their statistics whenever they wish.
|
The Dollar Index |
|
|
Month |
Dollar Index |
|
Jan 05 |
81.06 |
|
Feb 05 |
81.81 |
|
Mar 05 |
80.89 |
|
Apr 05 |
82.23 |
|
May 05 |
83.34 |
|
June 05 |
84.95 |
|
July 05 |
85.79 |
|
Aug 05 |
84.26 |
|
Sep 05 |
83.68 |
The dollar is now much higher than it was at the start of the year, although it is down slightly over the last two months. However, as I said last month, it�s probably bottomed out against the Euro. And the index is highly weighted toward the Euro. However, my guess is that it will continue to be weak compared with commodity currencies such as the Canadian Dollar, the New Zealand dollar, or the Australian dollar. Fundamentals (i.e., with the main factor being the US debt) suggest that the dollar has a long ways to go on the downside. However, we could have made that argument for much of the last ten years.
What this all means.
Our big picture still suggests a long-term BEAR market. And it looks like a flat, inflationary type market for equities. For example, two of the major averages are down slightly for the year, while the CPI suggests that prices have gone up 3.2% through August. However, the CRB (commodity prices) tell another story because they suggest that the prices of raw materials have gone up 17.4% this year. Thus, either there is a severe strain on producers who feel they cannot pass prices on to the consumer or the CPI is lying. Either way, this is not good for the economic well being of most Americans. However, let�s continue to watch the market for more signs. Until the end of October update on the market�..this is Van Tharp.
The Peak Performance Home Study Course
When people are
over stressed, their capability of doing things well shrinks
dramatically. It�s directly related to what happens to the
brain.
During stress, the hormone
adrenaline is released into the bloodstream. This has the effect
of diverting blood from the brain to the major muscles of the
body. It means that you can run faster, but it also means you are
much less effective at processing information. In fact, the
conscious mind, which normally has the capacity to process seven
chunks of information, shrinks down to the point of being able to
process only one or two chunks of information. Think what that means to most investors and
traders. They get stressed� either by the market or by something
going on in their lives�and can no longer effectively function.
They either freeze or keep repeatedly doing what they are already
doing�only with more energy. Neither response is healthy in
today�s fast markets.
One whole volume of Van Tharp's Peak Performance Home Study Course is devoted to stress management. You�ll learn how to measure your stressors and your stress protectors. More importantly, you�ll be able to add enough stress protection so that you can withstand the effects of today�s markets. But the course also helps you deal with stress in many more ways.
Housing Bubble Update � The Attack of the Killer �G�s�
by D. R. Barton, Jr.
Starting last December, I ran a six-part study on the state of housing in the U.S. I used the dreaded �B� word (bubble), but concluded that as long as demand remained strong, this (or any) bubble could be sustained longer than historical overbought indicators could predict.
Here we are ten months later and we�re starting to see some real chinks in the armor that has sustained the housing boom. Two financial giants (Fed Chairman Greenspan and Pimco Bond Guru Bill Gross) have weighed in heavily on the housing market. And demand data has started to look shaky if for the first time years.
This week we�ll look at what I�ve whimsically coined The Attack of the Killer �G�s� as the Fed Chairman and the Bond King have presented strong points of view about the current state of the housing market. Next week we�ll look at some additional data and timing ramifications. But onto those killer �G�s� �
On September 26th of this year, Mr. Greenspan addressed the American Bankers Association Annual Convention. There, he presented the results of a study on the housing market, which he co-authored. While the results of the study are significant, the fact that struck me hardest was this: In his 18 years as Fed Chairman, Mr. Greenspan has only attached his name to one other study.
It is clear that Mr. Greenspan wants to leave the Fed with no doubt that he recognized the extent of the housing bubble and that he weighed in on the situation in the strongest terms � through an extensive research paper that included his extensive involvement. This is legacy stuff, and cannot be taken lightly.
The most important findings from the study, in my estimation were:
� U.S. consumers borrowed an amazing $600 billion from their home equity in 2004.
� This represents an amount equal to almost 7% of total disposable consumer income for the year.
� If consumer spending has been tied directly to home value appreciation, then a slowing or reversal or home appreciation could have major effects on spending and overall economic health.
� The housing price boom has been in large part driven by lower interest rates and reduced regulation in the mortgage industry, which has allowed potentially dangerous, exotic mortgages.
� Mr. Greenspan opened the door for assumptions that a nationwide housing bubble could occur. Previously he had said this was not the case since buying and selling primary residences involved moving which is costly (in monetary and emotional terms).
� Now, the Greenspan study notes that at least 14% of new mortgages in recent years have been for second homes. This opens the door for speculative activity that could act more like a nationwide bubble instead of just a regional one.
Mr. Greenspan drew no direct conclusions based on the study, only wishing to provide impartial data.
Bill Gross, however, had no problems drawing conclusions in his always enlightening monthly letter.
Based on the Greenspan data and other information, Mr. Gross leaped directly to a sequence of events that will lead to a serious economic slowdown or even recession, in his opinion. And not only did he provide a process, Mr. Gross says that this housing price cooling/ slowing / reduction is a 99% certainty � a �slam dunk� in his words.
From someone with the track record and universal respect of Mr. Gross, this sequence of events requires further study. In next week�s Trading Tip we�ll break down Mr. Gross� analysis, look at his timing and add some additional fuel to the fire. Until then � great trading!
D. R. Barton, Jr. is the Chief Operating Officer and Risk Manager for the Directional Research and Trading hedge fund group. D. R. has been actively involved in trading, researching, and teaching in the markets since 1986. D. R. has taught extensively in many investment areas including intra-day trading, swing trading, and cutting edge risk management techniques.
His writing credits include co-authoring Safe Strategies for Fin-ancial Fre-edom and co-creator and contributing author on Fin-ancial Fre-edom Through Electronic Day Trading.
1,2,3 Model...
Author: nando
I am reading the market updates from the newsletter and I do appreciate the insights...
I was just wondering why there is no more reference to "1 - Is the Market too expensive?"
Any thought about that?
Reply To This Message
Re: 1,2,3 Model...
Author: Van Tharp
Hi,
The 1-2-3 model is mentioned first in the article every month. It's been in red light mode for as long as I can remember. Sometimes its a three signal red light mode and sometimes, it's just two. However, the two constants are 1) the market is expensive (i.e., the current PE on the S&P500 is about 20) and 2) is the Fed in the way (for a long time).
Right now the market is above its moving average, so we can't say its acting badly, but a few more days like we've had this week and we might be in a three signal red light mode.
Van
Self Sabotage - Two Reports of Self Sabotage
Do Not Reply to this email using the reply button as the email address is not monitored. Please click this link contact us: [email protected]
The Van Tharp
Institute does not support spamming in any way, shape or form. This is a subscription
based newsletter. If you no longer wish to subscribe, Unsubscribe
Here.
