Tharp's Thoughts Weekly Newsletter (View On-Line)
-
Article Van Tharp's Monthly Market Update by R. J. Hixson
-
-
-
Trading Tip For the First Time in 51 Trading Days by D.R. Barton, Jr.
-
Offer Position Sizing Power Pack Special!
In March, Dr. Tharp will be in Sydney to present his most prolific workshop: Peak Performance 101. This workshop provides the foundation for every trader who wants to earn bigger and better profits, consistently, all with less stress. Upon leaving this workshop, the immediate and positive impact of what you have learned will be apparent in your trading. Learn more…

Van Tharp's Market Update for the Period Ending February 2011
Market Condition: Bull Quiet
Prepared by R.J. Hixson
I always say that people do not trade the markets; they trade their beliefs about the markets. In that same way, I'd like to point out that these updates reflect my beliefs. If my beliefs and your beliefs are not the same, you may not find them useful. I find the market update information useful for my trading, so I do the work each month and am happy to share that information with my readers.
If your beliefs are not similar to mine, then this information may not be useful to you. Thus, if you are inclined to perform some sort of intellectual exercise to prove one of my beliefs wrong, simply remember that everyone can usually find lots of evidence to support their beliefs and refute others. Know that I acknowledge that these are my beliefs and that your beliefs may be different.
These monthly updates are in the first issue of Tharp's Thoughts each month. This allows us to get the closing month's data. These updates cover 1) the market type (first mentioned in the April 30, 2008 edition of Tharp's Thoughts and readable on our web site), 2) the five-week status on each of the major US stock market indices, 3) our four-star inflation-deflation model with John Williams' statistics, and 4) the movement of the dollar. Beginning this month, I will report on the strongest and weakest areas of the overall market as a separate SQN® Report. And that may come out twice a month if there are significant market charges. —Van K. Tharp
Part I: Commentary—The Big Picture
During a break between workshop dates in Sydney, Van is traveling around Asia, but he’ll be back in time for next month’s update. In the meantime, let’s see what his market-type system tells us this month to update our big picture.
In the last 100 trading days, the equities markets have moved from bearish and volatile conditions to bullish and much less volatile conditions. A number of averages and market segments have posted post-2008/2009 crash highs, and the NASDAQ is higher than it’s been since 2000.
As Van has mentioned numerous times, however, he believes we are in a secular bear market, and he expects this cycle to last about 20 years. That does leave us with many years of secular bear conditions, but long-term bear markets can still have dramatic rallies, even though these rallies may not correspond with an improving big picture nearly as much as the rally’s strength might indicate.
Part II: The Current Stock Market Type Is Bull Quiet
Each month, Van looks at the market SQN® score for the daily percent changes in the S&P 500 Index over 200, 100, 50 and 25 days. For our purposes, the S&P 500 Index defines the market. While the 200-day market SQN is in solid neutral territory, the 50-day and 25-day market SQN scores have moved to strong bull. Van uses the 100-day market SQN score, which is in the bull range right now (see the chart below). Underneath the market SQN score chart, you can also see the volatility chart, which shifted down into the quiet range in February.
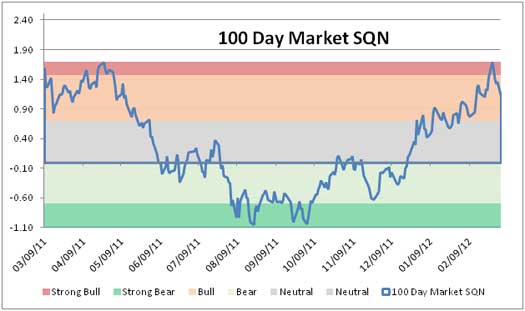
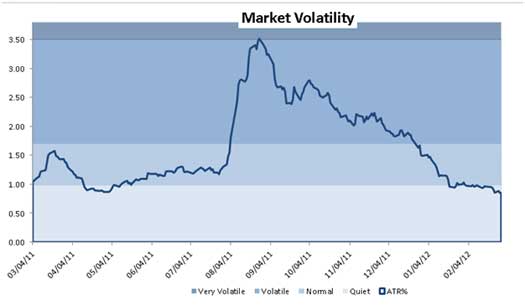
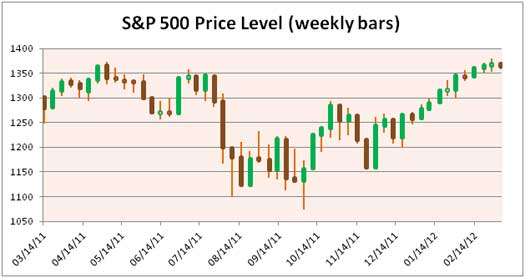
To help you see the relationship between the market SQN score and the volatility, Van added the S&P 500 market price chart above. Can you see how the last 20 bars (100 days) of price action have created the bull quiet market type at the end of February?
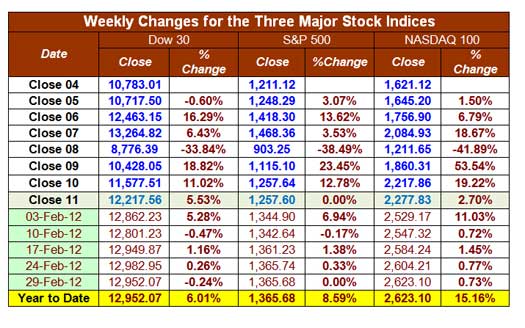
Index Report
February was a strong up month for all three major equity averages. Indeed, the Dow performance over the last two months has surpassed last year’s annual gain, while the S&P and NASDAQ gains have far surpassed last year’s annual results.
Part III: Our Four Star Inflation-Deflation Model
In the simplest of terms, inflation means that stuff gets more expensive and deflation means stuff gets cheaper. With inflation, the currency is worth less, while with deflation, the currency becomes dearer. Market levels correlate with inflation/deflation, so tracking inflation for big picture processes can be helpful. Given the conditions in the market for various asset classes, it’s not so easy to tell if we have an inflationary or a deflationary environment because there are strong crosscurrents of both forces at work. Here are the data inputs for Van’s four-star inflation-deflation model over the last few months and years.
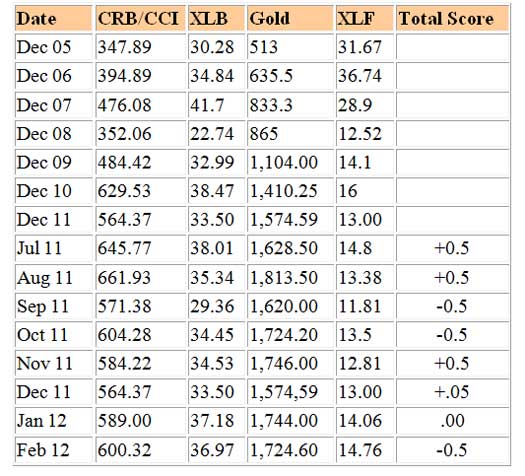
Looking back over the most recent two-month and six-month periods provides the current month's score.
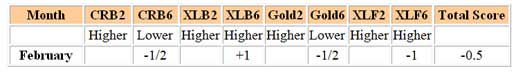
February provided a slight win for deflationary forces in the tug-of-war. The strongest indication of inflation came from the basic materials sector, which had higher levels at the end of February than two or six months back. The CRB index and gold, however, are higher than they were two months back, but still lower than they were six months back. The financial sector, which was higher than it was both two and six months ago, showed the strongest hints of deflation. This trendless progression will continue as it has since mid-2011 until we see either inflation or deflation become stronger overall.
Part IV: Tracking the Dollar
Van experienced the Tharp Effect in February while he was in Australia. He won’t be back for a few weeks, so we’ll have to wait to find out just how strong the effect was.
Even with a mid-month jump, the dollar continued its decline from January into the end of February. Here’s the daily chart for the dollar futures contract for March, 2011 through February, 2012.
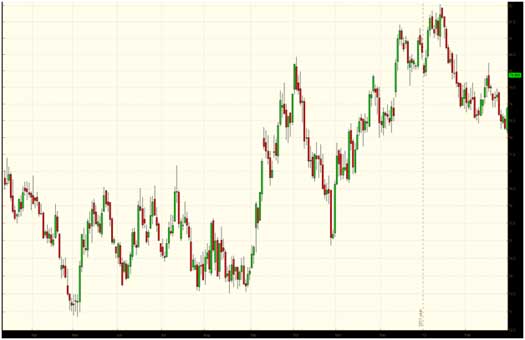
While higher than it was about six months back, longer-term, the USD remains in the lower half of a trading range it has occupied since 2004.
The Fed and The US Dollar
Van found a valuable website recently that contains a good deal of interesting big-picture data. You can visit it yourself at
http://greshams-law.com/
The charts below provide some perspective on the Federal Reserve’s actions over the last century as well as the scope of its recent operations. First, here’s a chart from the Gresham’s Law website that shows the Fed’s balance sheet in decade-by-decade detail since its founding.
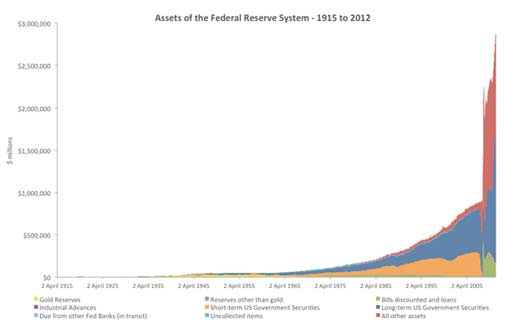
View Larger Chart
Below, you can see the Fed’s explosive assets growth from 2005-2012.
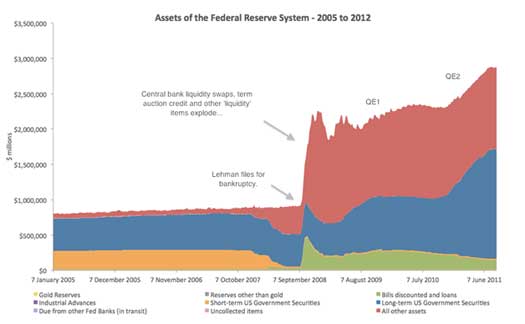
View Larger Chart
It may be overly simplistic to say that the rise over time in the Fed’s assets–and the recent jump–relate inversely to the value of the US dollar, but it’s safe to say that they are highly inversely correlated. In order to help improve the economy, the Fed has recently created a lot of new dollars through its asset accumulation and QE programs. One primary short-term objective has been to lower the price of US exports and thereby boost the GDP. A devalued dollar, however, has also hiked the price of imports (a chief one being oil). Longer-term, such devaluing maneuvers hurt economic growth, but short-term politics have historically tended to win out over long-term aims.
General Comments
Last week in Sydney, the Systems Workshop attendees focused on developing a number of trading systems by market type. Bull quiet markets are probably the easiest to trade, since you can basically make money using “buy and hold” for the duration of the market type. This is the market type that can make just about anybody look like a trading genius. But many traders (and most “investors”) lack a process for knowing when this bull quiet market type will end; furthermore, they often lack trading systems to trade the follow-on market types. If, however, you can tell when the market type shifts and have trading systems that work well in more volatile or bearish conditions, you can adapt your trading and reach your objectives, regardless of market type.
Remember that these monthly market updates are not for predictive purposes, but rather to help traders decide which of their trading systems should work best in the current market conditions. In bull quiet markets, you can enter long positions and simply ride the market up. Bear markets, however, are almost always volatile, so you need to utilize shorter-term strategies that allow both long and short positions. While we don’t know how long the current market type will last, we can rest assured that other market types will follow at some point.
Which of your trading systems fit this current market type? That question implies that you have multiple trading systems and that you know how they perform under various market conditions. If you haven't heard that concept before or the other ideas mentioned above, read Van's book Super Trader, which covers these areas and more so you can make money in any kind of market conditions.
Crisis always implies opportunity. Those with good trading skills can make money in this market—a lot of money. There were lots of good opportunities in 2011. Did you make money? If not, then do you understand why not? The refinement of good trading skills doesn't just happen by opening an account and adding money. You probably spent years learning how to perform your current job at a high skill level. Do you expect to perform at the same high level in your trading without similar preparation? Financial market trading is an arena filled with world-class competition. Most importantly, trading requires massive self-work to produce consistent, large profits under multiple market conditions. Prepare yourself to succeed with a deep desire, strong commitment, and the right training.
About the Author: RJ Hixson is a devoted husband and active father. At the Van Tharp Institute, he researches and develops new products and services that will help traders trade better. He can be contacted at “rj” at “vantharp.com”.
Trading Education
Workshops
Ken traded silver on the short side last week and outlined his use of regression line crossovers to guide his entry and exit in this video. He also described how he could have improved the trade with a quicker exit and then a re-entry. Ken refers to this kind of trade as “normal” because it delivered a +.8R result and he makes several of these a day on average. Watch his short explanation of the trade and attend his upcoming workshop to understand the methodologies so you can make several “normal” trades a day like this one, click here.
Mar
17-19 |
$2,295
$2,995
|
Peak Performance 101
$700 Discount Expires TODAY
|
Sydney, AU |
Mar
23-25 |
$3,295
$3,995
|
Mechanical Swing and Day Trading Systems
Ken Long is Back with Short-Term Systems
|
Cary, NC |
Mar
26-30 |
Vary |
Discretionary Swing and Day Trading Systems
Five Days of Live Trading with Ken Long |
Cary, NC |
| |
|
Click here for combo pricing details on Ken Long's workshops. |
Cary, NC |
Apr
21-22 |
$2,295
$2,995
|
Core Trading Systems: Market Outperformance and Absolute Returns
Longer Term Systems for Consistent Trading Profits |
Cary, NC |
Apr
24-26 |
$2,295
$2,995
|
Blueprint for Trading Success
Build the Foundation of Successful Trading |
Cary, NC |
May
17-19 |
$2,295
$2,995
|
Peak Performance 101
Van Tharp's Signature Workshop |
Cary, NC |
May
21-24 |
$3,295
$3,995
|
Peak Performance 202
with Dr. Libby Adams |
Cary, NC |
To see our full workshop schedule including dates, prices, and location, click here.
SQN Report
February 2012 SQN Report
Prepared by R.J. Hixson
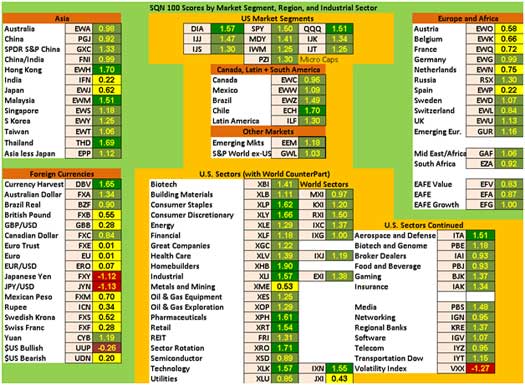
There are numerous ETFs that now track everything from countries, commodities, currencies and stock market indices to individual market sectors. ETFs provide a wonderfully easy way to discover what’s happening in the world markets. Consequently, I now use the System Quality Number® (SQN®) score for 100 days to measure the relative performance of numerous markets in a world model.
The SQN 100 score uses the daily percent change for a 100-day period. Typically, an SQN score over 1.45 is strongly bullish; a score below -0.7 is very weak. We use the following color codes to help communicate the strength or weakness of the ETFs.
- Green: ETFs with very strong SQN scores (0.75 to 1.5).
- Yellow: ETFs with slightly positive SQN scores (0 to 0.75).
- Brown: ETFs with slightly negative SQN scores (0 to -0.7).
- Red: Very weak ETFs that earn negative SQN scores (< -0.7).
The world market model spreadsheet report below contains most currently available ETFs, including inverse funds, but excluding leveraged funds. In short, it covers the geographic world, the major asset classes, the equity market segments, the industrial sectors and the major currencies.
World Market Summary
Strength started showing up in the U.S. back in December, and that trend continued through February with every U.S. market segment now green. All of the ETFs in the Americas are now green, and green predominates in Asia and Europe. Worldwide, quality continues to emerge and show up in the markets; there were no brown countries or regions at all in February.
In Asia, only India and Japan remain yellow, with the rest of the countries and regions showing green. In Europe, Austria, Belgium, France, the Netherlands and Spain are yellow, but the rest have turned green.
Currencies have also strengthened, with the only remaining red currency ETFs relating to the Japanese Yen. The up dollar ETF is the only brown currency, with all the rest being either yellow or green. Of interest to Van is the Australian dollar, which remained strong in February, as well as the Chinese Yuan, which also shows strength. He visits China this month.
As for U.S. industrial sectors, all are green, with two exceptions: metals/mining and the volatility index. Given the market’s quiet volatility, it’s easy to understand why VXX has been so weak over the last 100 days. Homebuilders showed the highest quality gains; runners-up include sector rotation, consumer discretionary, consumer staples and pharmaceuticals.
View Larger Chart
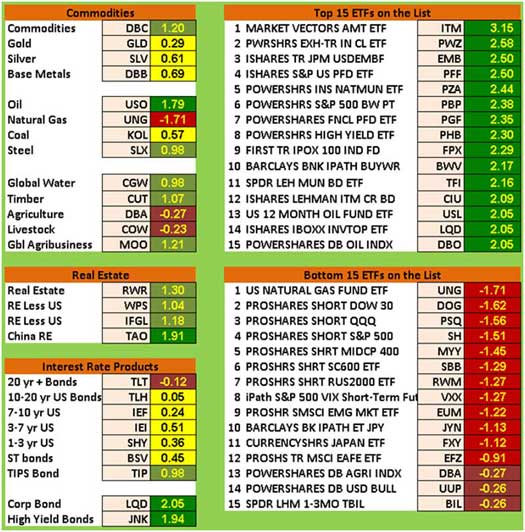
Other Asset Classes, Strongest/Weakest ETFs
The next table shows the relative performance of commodities, real estate and interest rates on the left hand side. The strongest and weakest areas of all the ETFs are on the right.
As a group, commodities have turned from largely brown and yellow to yellow and green in February. Oil remains the strongest commodity, while natural gas remains the worst. Agriculture and livestock continue their weakness, but besides coal and the metals, all the other commodities are now green.
Real estate has now turned all green, as have corporate bonds and junk bonds. Except for long-term US treasury bonds, which are brown, and the TIPS bonds, which are green, the rest of the U.S. treasury-based products are yellow at this point.
Debt-based or income-based ETFs dominated the highest SQN-scoring ETF list. There are also two oil-based ETFs lower on the list that might not surprise anyone who has watched the price of gas or oil lately.
Given the growing strength in the indices, it’s probably not surprising that a number of inverse funds ranked among the bottom SQN-scoring ETFs list. Interestingly, the natural gas ETF continued its bottom spot with what could have been a bottoming pattern in February (though that potential fell apart in the last few days).
View Larger Chart
What's Going On?
The world market model that Ken Long developed and Van adapted using his SQN® scores really does show where the money has been flowing over the recent period. Money has been moving out of the “safety” of government debt products and making it back into corporate debt and equities in the U.S., Asia, and much of Europe. Because there are mixed signals on inflation, inflation hedges such as commodities haven’t picked up significantly yet.
Van has observed that trends have tended to remain quite short over the last year or two, so stay alert to changes that can come suddenly. Use trading systems that do well in bull markets, and keep your head up for any change in market type. Even though equities generally look good right now, the big picture still isn’t rosy.
Crises always offer opportunities, but to capture those opportunities you MUST know what you are doing. If you want to trade these markets, you need to approach them as a trader, not a long-term investor. We’d like to help you learn how to trade professionally. Trying to navigate these markets without an education is hazardous to your wealth.
Van will return next month with his commentary on the world market model for March.
Trading Tip
This week D.R. Barton, Jr. discusses an unusually gradual upward move in his article, For the First Time in 51 Trading Days.
Click here for article.
Package Price
The Position Sizing™ Power Pack
For a limited time get three of Van's most significant position sizing items at a discount.
- Start with the Introduction to Position Sizing E-Learning Course
- Practice what you learn in the Position Sizing Trading Simulation Game
- Learn position sizing at a whole new level in the Definitive Guide to Position Sizing.
All three only $435
(That's a 20% savings!)
Purchase Now
Learn More
Ask Van...
Everything that we do here at the Van Tharp Institute is focused around helping you improve as a trader and investor. Therefore, we love to get your feedback, both positive and negative!
Click here to take our quick, 6-question survey.
Also send comments or ask Van a question by using the form below.
Click Here for Feedback Form »
Back to Top
Contact Us
Email us [email protected]
The Van Tharp Institute does not support spamming in any way, shape or form. This is a subscription based newsletter.
To change your e-mail Address, click here
To stop your subscription look at the very bottom, left corner of this email and click on that link.
How are we doing? Give us your feedback! Click here to take our quick survey.
800-385-4486 * 919-466-0043 * Fax 919-466-0408
SQN® and the System Quality Number® are registered trademarks of the Van Tharp Institute
Back to Top |
|
March 07, 2012 - Issue 567


A Must Read for All Traders
Super Trader
How are we doing?
Give us your feedback!
Click here to take our quick survey.
From our reader survey...
"I think the newsletter is extremely generous and it is a resource I utilize constantly. I have saved every single one since I first subscribed."
Trouble viewing this issue?
View On-line. »
Tharp Concepts Explained...
-
Psychology of Trading
-
System Development
-
Risk and R-Multiples
-
Position Sizing
-
Expectancy
-
Business Planning
Learn the concepts...
Read what Van says about the mission of his training institute.
The Position Sizing Game Version 4.0
Picking the right stocks has nothing to do with trading success and neither do amazing trading systems with high percentage wins. The Position Sizing Game teaches you the key elements of trading success. Learn more.
To Download for Free or Upgrade Click Here

Download the 1st three levels of Version 4.0 for free.
Register now. »
Trouble viewing this issue?
View On-line. »

A Thousand Names for Joy: A Commentary
You can read Super Trader Curtis Wee's full review here.
Dr. Tharp is on Facebook

Follow Van through
Twitter »
Van Tharp Trading Education Products are the best training you can get.

Check out our home study materials, e-learning courses, and best-selling books.
Click here for products and pricing
What kind of Trader Are You? Click below to take the test.
Tharp Trader Test
Back to Top

Introduction to Position Sizing™ Strategies
E-Learning Course
Only $149
Learn More
Buy Now
SQN® and the System Quality Number® are registered trademarks of the Van Tharp Institute |