Tharp's Thoughts Weekly Newsletter (View On-Line)
-
Article January 2012 Market Condition: Bull Normal by Van K. Tharp, Ph.D.
-
-
Trading Tip January 2012 SQN® Report by Van K. Tharp, Ph.D.
-
Offer No Shipping Cost on These Downloadable Items
-
Fun Check out new Photos from Dinner and More Poker with Van!
Early Enrollment Discounts Expire Soon on February Sydney Workshops

Monthly Market Update for Period Ending January 31, 2012
Market Condition: Bull Normal
by Van K. Tharp, Ph.D.
I always say that people do not trade the markets; they trade their beliefs about the markets. In that same way, I'd like to point out that these updates reflect my beliefs. If my beliefs and your beliefs are not the same, you may not find them useful. I find the market update information useful for my trading, so I do the work each month and am happy to share that information with my readers.
If your beliefs are not similar to mine, then this information may not be useful to you. Thus, if you are inclined to perform some sort of intellectual exercise to prove one of my beliefs wrong, simply remember that everyone can usually find lots of evidence to support their beliefs and refute others. Know that I acknowledge that these are my beliefs and that your beliefs may be different.
These monthly updates are in the first issue of Tharp's Thoughts each month. This allows us to get the closing month's data. These updates cover 1) the market type (first mentioned in the April 30, 2008 edition of Tharp's Thoughts and readable on our web site), 2) the five week status on each of the major US stock market indices, 3) our four star inflation-deflation model plus John Williams' statistics, and 4) tracking the dollar. I now report on the strongest and weakest areas of the overall market as a separate SQN® Report. And that may come out twice a month if there are significant market charges.
Part I: Commentary—The Big Picture
Last month I presented the big picture and that certainly didn’t change in January.
Secular bear markets do not necessarily correspond with big picture fundamentals, but the fundamentals behind the current bear are very weak. I’m expecting this bear market to last 20 years at minimum.
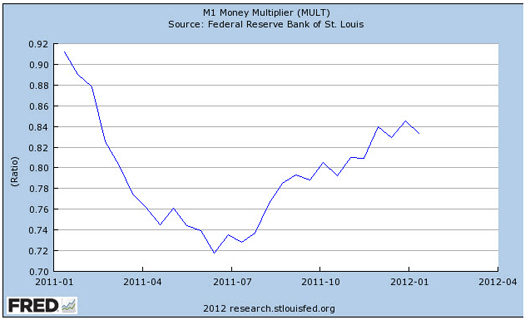
As I mentioned last month, the US government relies on a private banking system, the Federal Reserve, to fix its financial problems by printing money and manipulating interest rates. The Fed has taken extraordinary measures in the recent past and has promised to continue doing so. But banks are in poor shape and still lending at an anemic rate. To stimulate the economy, banks need to lend out money at 2-3 times the rate that the Fed prints it. Instead, the multiplier is below 1.0.
The chart below shows the current money multiplier from the St. Louis branch of the Federal Reserve bank. With the multiplier now at about 0.83, banks continue to lend less money than the Fed is creating, so there is no multiplier effect.
Shorter term, however, the outlook is a little brighter. The Federal Reserve committed to low interest rates for the next two years. Thus, bonds could remain a safe haven, and perhaps there will be some stimulation of the stock market. It may be time to invest in the stock market—at least for now as we are in bullish territory.
Part II: The Current Stock Market Type Is Bull Normal
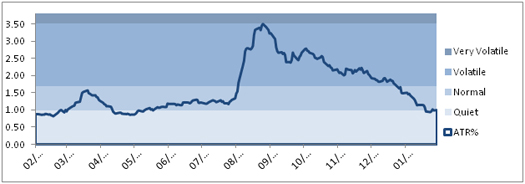
Each month I look at the market SQN score for the daily percent changes in the S&P 500 Index over 200, 100, 50 and 25 days. For our purposes, the S&P 500 Index defines the market. The 200- and 50-day SQN scores are neutral, while the 25-day is strongly bullish. We use the 100-day SQN score, which is bullish, while volatility is now normal as shown in the graph below.
The 100-day SQN score is shown in the chart below along with a weekly candlestick chart of the S&P 500, so you can see how the SQN scores relate to the actual prices.
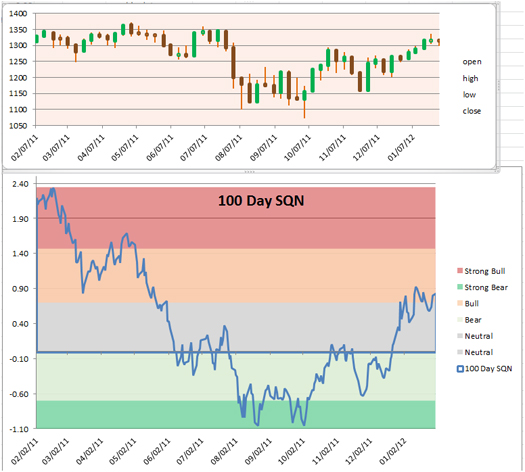
Notice how the prices stayed flat for the first half of last year while the SQN scores dropped. Thus, when prices actually declined in the summer, the SQN scores quickly went bearish. As prices have increased recently, we’ve now moved into bullish territory. And that’s positive for the outlook with volatility in the normal range again.
The Dow Jones and the NASDAQ both ended up slightly for 2011, while the broad market (the S&P 500) was effectively unchanged.
Weekly Changes for the Three Major Stock Indices |
|
Dow 30 |
|
S&P 500 |
|
NASDAQ
100 |
|
Date |
Close |
% Change |
Close |
%Change |
Close |
% Change |
Close 04 |
10,783.01 |
|
1,211.12 |
|
1,621.12 |
|
Close 05 |
10,717.50 |
-0.60% |
1,248.29 |
3.07% |
1,645.20 |
1.50% |
Close 06 |
12,463.15 |
16.29% |
1,418.30 |
13.62% |
1,756.90 |
6.79% |
Close 07 |
13,264.82 |
6.43% |
1,468.36 |
3.53% |
2,084.93 |
18.67% |
Close 08 |
8,776.39 |
-33.84% |
903.25 |
-38.49% |
1,211.65 |
-41.89% |
Close 09 |
10,428.05 |
18.82% |
1,115.1 |
23.45% |
1,860.31 |
53.54% |
Close 10 |
11,577.51 |
11.02% |
1,257.64 |
12.78% |
2,217.86 |
19.22% |
Close 11 |
12,217.56 |
5.53% |
1,257.60 |
0.00% |
2,277.83 |
2.70% |
30-Dec-11 |
12,217.56 |
0.00% |
1,257.60 |
0.00% |
3,005.75 |
31.96% |
06-Jan-12 |
12,359.92 |
1.17% |
1,277.81 |
1.61% |
3,122.80 |
3.89% |
13-Jan-12 |
12,422.06 |
0.50% |
1,289.09 |
0.88% |
2,371.98 |
-24.04% |
20-Jan-12 |
12,720.48 |
2.40% |
1,315.38 |
2.04% |
2,437.02 |
2.74% |
27-Jan-12 |
12,660.46 |
-0.47% |
1,316.33 |
0.07% |
2,461.77 |
1.02% |
Year to Date |
12,660.46 |
3.63% |
1,316.33 |
4.67% |
2,461.77 |
8.08% |
Notice that all three averages are up nicely in just one month. And two of them, the NASDAQ and the S&P 500, are up more in January than they were for all of 2011.
Part III: Our Four Star Inflation-Deflation Model
In the simplest of terms, inflation means that stuff gets more expensive and deflation means stuff gets cheaper. There’s a correlation between the inflation rate and market levels, so it’s of use to traders’ big picture processes. Given world conditions, it’s not so easy to tell if we have an inflationary environment or a deflationary one as there are strong crosscurrents of both forces at work. January continued to present a mixed message, and my model shows no trend since mid-2011. Here is my four star inflation-deflation model over the last few months and years.
| Date |
CRB/CCI |
XLB |
Gold |
XLF |
Total Score |
| Dec 05 |
347.89 |
30.28 |
513.00 |
31.67 |
|
| Dec 06 |
394.89 |
34.84 |
635.50 |
36.74 |
|
| Dec 07 |
476.08 |
41.70 |
833.30 |
28.90 |
|
| Dec 08 |
352.06 |
22.74 |
865.00 |
12.52 |
|
| Dec 09 |
484.42 |
32.99 |
1,104.00 |
14.10 |
|
| Dec 10 |
629.53 |
38.47 |
1,410.25 |
16.00 |
|
| Dec 11 |
564.37 |
33.50 |
1,574.59 |
13.00 |
|
| Jun 11 |
632.23 |
39.37 |
1,500.30 |
15.35 |
+0.5 |
| Jul 11 |
645.77 |
38.01 |
1,628.50 |
14.80 |
+0.5 |
| Aug 11 |
661.93 |
35.34 |
1,813.50 |
13.38 |
+0.5 |
| Sep 11 |
571.38 |
29.36 |
1,620.00 |
11.81 |
-0.5 |
| Oct 11 |
604.28 |
34.45 |
1,724.20 |
13.50 |
-0.5 |
| Nov 11 |
584.22 |
34.53 |
1,746.00 |
12.81 |
+0.5 |
| Dec 11 |
564.37 |
33.50 |
1,574.59 |
13.00 |
+0.5 |
| Jan 12 |
589.00 |
37.18 |
1744.00 |
14.06 |
0 |
Looking back over the most recent two-month and six-month periods provides the current month's score.
|
|
|
| Month |
CRB2 |
CRB6 |
XLB2 |
XLB6 |
Gold2 |
Gold6 |
XLF2 |
XLF6 |
Total Score |
| |
Higher |
Lower |
Higher |
Lower |
Lower |
Higher |
Higher |
Lower |
|
| January |
|
-0.5 |
|
-0.5 |
|
+0.5 |
|
+0.5 |
0 |
We are neutral right now with neither deflation nor inflation. Part of the reason that we are not seeing severe inflation with the massive currency creation by the Fed is that the banks are not lending.
Part IV: Tracking the Dollar
In recent weeks, I’ve been watching the US dollar decline against the Aussie dollar. Let’s look at the daily chart of the dollar futures contract price for February 2011 through January 2012.
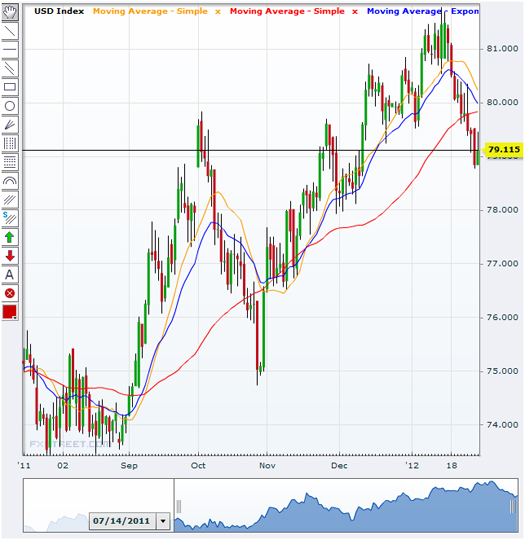
As you can see, the long-term trend has been up; however, now that I’m about to leave the US, the dollar has started a decline. The Tharp effect seems to still work. For those of you who are lucky to be attending the Sydney workshops, you are getting a great price on the workshops, and I am absorbing all the risk by coming to you.
In all seriousness, this chart really reflects the psychology of the dollar versus the Euro, which continues to oscillate like a yo-yo.
The Fed has announced its intention to keep interest rates low for two years. That’s not good for the dollar, but what has been bad for the dollar has been good for the stock market. Be careful because whatever you think you might have made in the stock market could be lost by a decline in the value of the US dollar.
General Comments
If you are playing the market and you have systems that work well in bull markets, it’s probably safe to invest for now. We seem to have moved into a bullish market. And who knows, perhaps it will last much of the year. The “end of the world” in 2012 might include an up stock market.
These monthly market updates are not for predictive purposes but rather to help traders decide which of their trading systems should work best in the current market conditions. In bear markets, which are almost always volatile by nature, shorter term strategies, and those that allow going short, tend to work better than long only or intermediate/longer-term systems.
Which of your trading systems fit this current market type? That question implies that you have multiple trading systems and that you know how they perform under various market conditions. If you haven't heard that concept before or the other ideas mentioned above, read my book Super Trader, which covers these areas and more so you can make money in any kind of market conditions.
Crisis always implies opportunity. Those with good trading skills can make money in this market—a lot of money. There were lots of good opportunities in 2011. Did you make money? If not, then do you understand why not? The refinement of good trading skills doesn't just happen by opening an account and adding money. You probably spent years learning how to perform your current job at a high skill level. Do you expect to perform at the same high level in your trading without similar preparation? Financial market trading is an arena filled with world class competition. Additionally and most importantly, trading requires massive self-work to produce consistent, large profits under multiple market conditions. Prepare yourself to succeed with a deep desire, strong commitment, and the right training.
About the Author: Trading coach, and author, Dr. Van K. Tharp is widely recognized for his best-selling books and his outstanding Peak Performance Home Study program—a highly regarded classic that is suitable for all levels of traders and investors. You can learn more about Van Tharp at www.vantharp.com.
Trading Education
Workshops
A Mid-March Peak Performance 101 Has Been Added in Sydney!
Oneness Awakening
February 11-12
Cary, NC
|
The workshop has become a fundamental tool in
Dr. Tharp's mission to help his clients succeed.
Don't miss a chance to learn more about
how you can become more aware,
positive, calm, centered, and successful. More... |
Blueprint for Trading Success
February 24-26
Medina Hotel Sydney AU
|
This is a complete structured program in which you’ll learn strategic, focused steps that will serve you throughout your entire trading career. During these intensive, hands-on three days, you will learn 17 clear and concise tasks to master that will take your trading from ho-hum to visionary. You will leave with a thorough checklist of action steps to guide you to a higher level of performance. More...
$700 Discount Expires in 13 Days, Feb 15 |
How to Develop a Winning Trading System That Fits You
Feb 28-Mar 1
Medina Hotel Sydney, AU
|
Our job in this workshop is to teach you what you need to know to develop your own system. The material you will learn is not market or time-frame specific. So whether you trade stocks, futures, currencies or gold, etc., or whether you place 50 trades per day or 50 trades per year, you will learn all of the components that work in any system. More...
$700 Discount Expires in 13 Days, Feb 15 |
Peak Performance 101
March 17-19
Mercure Hotel Sydney AU |
Understand why some people consistently make profits over and over again, while others are erratic and unsuccessful. More importantly, you’ll learn how to overcome self-sabotage and develop rock-solid discipline in your performance in the
markets! More... |
More upcoming workshops in Cary, NC
- March - Mechanical Day and Swing with Ken Long
- March - Discretionary Live Trading with Ken Long
- April - Core Systems that Outperform with Ken Long
- April - Blueprint for Trading Success with Van and RJ
- May - Peak Performance 101 with Van Tharp
- May - Peak Performance 202 with Van and Libby
Click here to see the full workshop schedule and more more info |
Trading Tip
by Van K. Tharp, Ph.D.
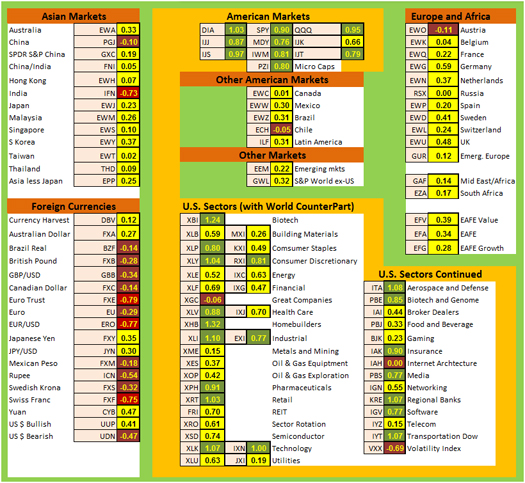
There are numerous ETFs that now track everything from countries, commodities, currencies, and stock market indices to individual market sectors. ETFs provide a wonderfully easy way to discover what’s happening in the world markets. As a result, I now use the System Quality Number® (SQN) score for 100 days to measure the relative performance of numerous markets in a world model.
The SQN 100 score uses the daily percent change for a 100-day period. Typically, an SQN score over 1.45 is strongly bullish; a score below -0.7 is very weak. We use the following color codes to help communicate the strength or weakness of the ETFs:
- Green: ETFs with very strong SQN scores (0.75 to 1.5).
- Yellow: ETFs with slightly positive SQN scores, which are not as strong as the green ones (0 to 0.75).
- Brown: ETFs with slightly negative SQN scores (0 to -0.7).
- Red: Very weak ETFs that earn negative SQN scores (< -0.7).
The World Market Model spreadsheet report below consists of most currently available ETFs including inverse funds but excluding leveraged funds. In short, it covers the geographic world, the major asset classes, the equity market segments, the industrial sectors, and the major currencies.
World Market Summary
In December, strength started showing up in the US with most sectors becoming yellow or light green. That trend continued in January. In addition, most of Europe moved from brown to yellow. Most of Asia is now also yellow. We haven’t seen much of this lately.
Worldwide, the only brown countries left are China, India, Austria, and Chile. In the US all sectors are now light green with the exception of the midcap growth sector.
Many of the currencies are still brown and the Euro and Swiss Franc are red. Interestingly, the Australian dollar shows up with a weaker SQN score than the US dollar, but that’s certainly not what I’ve been seeing lately. However, I’m watching it on a more short-term basis, and these SQN scores use 100-day periods, not one-month periods.
The strongest US sectors look to be homebuilders, biotech, industrial, retail, consumer discretionary, and technology. There are still three weak sectors: great companies (perhaps they are not so great?), Internet architecture, and volatility (VXX). Volatility has been declining markedly (that’s a good sign for the bulls).
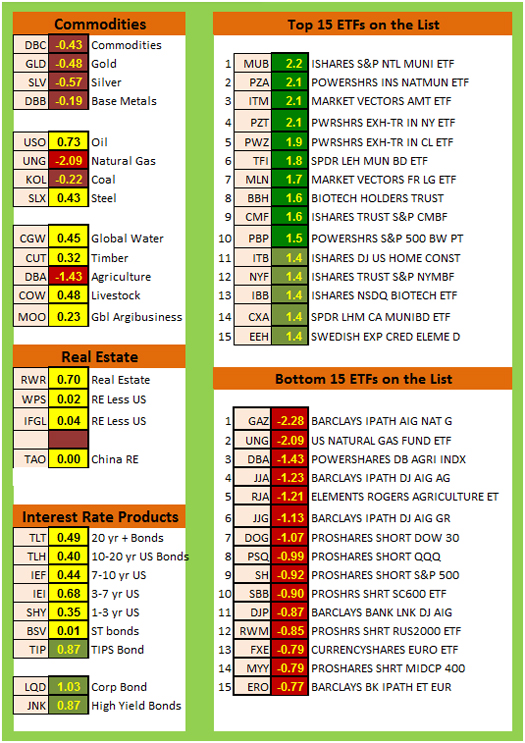
Other Asset Classes, Strongest/Weakest ETFs
The next table shows the relative performance of commodities, real estate, and interest rates on the left hand side. The strongest and weakest areas of all of the ETFs are on the right.
Oil is still the strongest commodity, but livestock and global water also strengthened. Natural gas continues to be terrible, and agriculture is very weak also. Many of the inflation-based commodities (including the blended commodity ETF) are still brown.
Real estate is now yellow, and money is starting to move out of bonds. Junk bonds and corporate bonds now look better than the treasuries. However, Muni bond funds are still among the strongest ETFs. Natural gas, agriculture, and some of the short funds are among the weakest.
What's Going On?
My world model SQN scores give you a clear snapshot of what is going on in the markets. The US markets are looking good, and money is moving out of debt instruments into the markets. Inflation hedges don’t look that good (yet), but that corresponds with our big picture outlook on inflation.
It’s time to switch over to trading systems that perform well in bull markets, but keep two things in mind:
- These world market snapshots seem to change fast.
- The big picture still remains serious.
Crises always offer opportunities, but to capture those opportunities you MUST know what you are doing. If you want to trade these markets, you need to approach them as a trader, not a long-term investor. We’d like to help you learn how to trade professionally.
Trying to navigate these markets without such an education is hazardous to your wealth.
Until next month, this is Van Tharp. Take care and trade well.
Offer
No Shipping Costs on These Downloadable Items
The Intro to Position Sizing Strategies E-course $149
The Position Sizing Trading Simulation Game $195
The Investment Psychology
Inventory Profile $100
Two Special Reports on Self-Sabotage $19.95 ea
Special Report Does Your System Still Work in Changing Markets? $19.95
Fun
Photos of everyone relaxing after a
few days of hard work in the Peak 101 Workshop.

See More....
Ask Van...
Everything that we do here at the Van Tharp Institute is focused around helping you improve as a trader and investor. Therefore, we love to get your feedback, both positive and negative!
Click here to take our quick, 6-question survey.
Also send comments or ask Van a question by using the form below.
Click Here for Feedback Form »
Back to Top
Contact Us
Email us [email protected]
The Van Tharp Institute does not support spamming in any way, shape or form. This is a subscription based newsletter.
To change your e-mail Address, click here
To stop your subscription look at the very bottom, left corner of this email and click on that link.
How are we doing? Give us your feedback! Click here to take our quick survey.
800-385-4486 * 919-466-0043 * Fax 919-466-0408
SQN® and the System Quality Number® are registered trademarks of the Van Tharp Institute
Back to Top |
|
February 02, 2012 - Issue 562


A Must Read for All Traders
Super Trader
How are we doing?
Give us your feedback!
Click here to take our quick survey.
From our reader survey...
"I think the newsletter is extremely generous and it is a resource I utilize constantly. I have saved every single one since I first subscribed."
Trouble viewing this issue?
View On-line. »
Tharp Concepts Explained...
-
Psychology of Trading
-
System Development
-
Risk and R-Multiples
-
Position Sizing
-
Expectancy
-
Business Planning
Learn the concepts...
Read what Van says about the mission of his training institute.
The Position Sizing Game Version 4.0
Picking the right stocks has nothing to do with trading success and neither do amazing trading systems with high percentage wins. The Position Sizing Game teaches you the key elements of trading success. Learn more.
To Download for Free or Upgrade Click Here

Download the 1st three levels of Version 4.0 for free.
Register now. »
Trouble viewing this issue?
View On-line. »

A Thousand Names for Joy: A Commentary
You can read Super Trader Curtis Wee's full review here.
Dr. Tharp is on Facebook

Follow Van through
Twitter »
Van Tharp Trading Education Products are the best training you can get.

Check out our home study materials, e-learning courses, and best-selling books.
Click here for products and pricing
What kind of Trader Are You? Click below to take the test.
Tharp Trader Test
Back to Top

Introduction to Position Sizing™ Strategies
E-Learning Course
Only $149
Learn More
Buy Now
SQN® and the System Quality Number® are registered trademarks of the Van Tharp Institute |