Tharp's Thoughts Weekly Newsletter (View On-Line)
-
Article How to Design a Trading System to Trade a Particular Market Type by Van K. Tharp Ph.D. and R.J. Hixson
-
-
Trading Tip January's First Five Days Indicator Revisited by D.R. Barton, Jr.
-
Fun Check out new Photos from our last client dinner
$700 Early Enrollment Discounts Expire TODAY
on Peak Performance 101 and Peak Performance 203
Learn more...

How to Design a Trading System to Trade a Particular Market Type
by Van K. Tharp, Ph.D. and R.J. Hixson
Note: Some readers might consider skipping the following article because they don’t trade the Australian equities market; however, the same trading system design principles apply to equities elsewhere, currencies, commodities, etc. Understanding market type and having systems ready to trade as the market type shifts is a key to trading profitably over time.
While getting ready for the next month’s workshops in Sydney, we decided to add an important dimension to the Systems Development Workshop. Normally, the Systems Workshop attendees split into different groups based on their preferences for asset class and time frame (e.g., swing trading equities, day trading Forex) as one of the key exercises for the workshop. Naturally, the groups tend to design one or two systems that address the chosen time frame and asset class, rather than the market types.
To get a better idea of what we mean by market types, take a look at the following daily chart of the All Ordinaries index for 2007–2011.
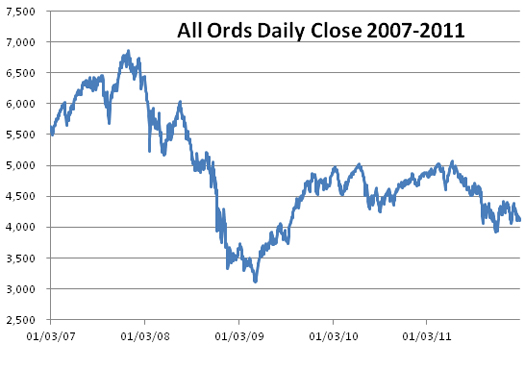
If you had a trading system that worked well in a bull market with quiet or normal volatility you would have been able to trade that system for maybe a year in total over the last five years. What if the next five years bring a similar situation? We would hope that you wouldn’t try to trade that system in other market types. Unfortunately, that's what a lot of people do, and then they have trouble understanding why their formerly fantastic system doesn’t seem to work anymore. Rather, what if you had a number of trading systems that each worked well in a different market type? That's what we're going to help you do at the February Systems Development Workshop in Sydney—design systems that work well in different market types. We’ll also be doing this in future systems workshops in Cary.
All Ords Market Types
We ran an analysis on the All Ords for the last five years. It closed 2006 at 5,644.30 and 2011 at 4,111.00, for a 27.2% decline over the period. The index range during those five years was from almost 7,000 down to around 3,000. The All Ords suffered the huge global bear market drop from late 2007 into early 2009. It recovered into early 2010, but since then, it's been fairly flat.
If you look at the All Ords statistics, you can see a somewhat fairly even distribution among the days it spent in directional moves from strong bull to strong bear using the 100-day market SQN® score.
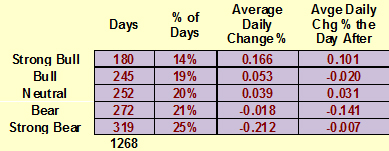
You can also see the average rise and decline on a daily basis in the third column. Not surprisingly, the best average daily gains come from the strong bull periods and the biggest declines come from the strong bear periods. If we were to split the periods into three broad market types, bull, neutral (also referred to as sideways or flat), and bear, 2007-2011 saw 34% bull, 20% neutral, and 46% bear. The last five years have been much more bearish than on average.
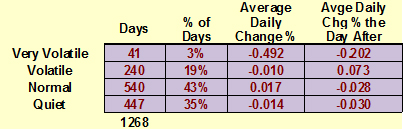
Now let’s look at the volatility figures. Normal volatility makes up nearly half of the days in the period. Quiet comes in second with volatile in third and only a handful of days are very volatile. Notice the average daily change during the various volatility ratings. Very volatile days tend to generate large losses and show up almost exclusively in bear markets.
If we combine those two tables into a matrix and sort them by market types with the most days, we see some interesting results.
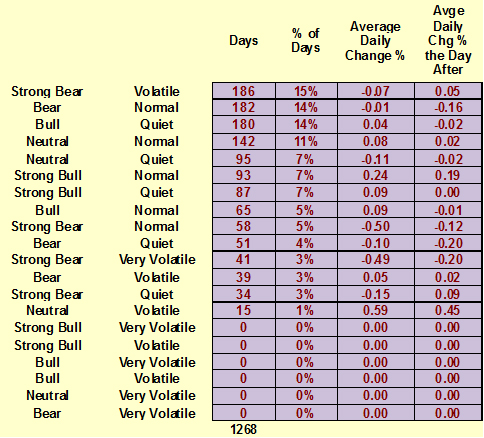
The top three market types—strong bear volatile, bear normal, and bull quiet—are about evenly divided, and these three market types make up nearly half of the total days in the period. You need to think about how your trading system would work in these three market conditions because prices behave very differently in each. Do you have one system that will perform well in all three of those market conditions? Probably not. You could, however, develop one system that works superbly in strong bear volatile, one that works superbly in bear normal, and a third that works superbly in a bull quiet market. As we already mentioned, though, expecting one trading system to work well in all (or even many) market types can cause you frustration and generate losses.
It can be easy to design a good system for any one market type once you understand the system development process, and that’s one of the primary points we plan to emphasize in the Systems Development Workshop. We’ll teach you how to measure market type and develop a system that fits you as well as fits the particular market type you have to trade at any given time.
System Design by Market Type
System design and development become easier and more effective when you think about how prices behave in each market type. Let’s assume that what works in a bull market will also apply to a strong bull market and the same for bear and strong bear. And then let’s approach designing two systems, one a bull quiet market and a second for a bear volatile market.
First, let’s think about a bull quiet market. In this type of market, everyone thinks they are a stock market genius because buy and hold actually works. If you want to go the “buy and hold” route, it might be better to set a stop wide enough to stay outside of the normal trading noise, but narrow enough so that if the market changed, you’d be able to get out. Our research suggests that a 25% trailing stop usually works well enough for this purpose.
A simple system for a bull quiet market in an equities market would filter for buying the following:
- Highly efficient stocks
- Stocks with high SQN scores
- The strongest stocks in the strongest sectors of the markets
You’d then need a specific entry:
- Buy after a retracement
- Buy after a breakout on a consolidation
You’d need to determine when you might be wrong about the trade to set up your initial risk:
- When it goes down below the old low of the retracement
- When it goes back into the baseline consolidation area
And you’d need to have a fairly good idea that your potential reward was 2-3 times your risk. Your exit method determines your reward. Here are a few that might work:
- A trailing stop
- A market type change exit
- Exiting a poorly performing position when you find a much better candidate.
Determining the SQN score for your system allows you to develop a position sizing™ strategy to meet your objectives. (We go into this critical aspect of trading a great deal at the Systems Development Workshop.)
Contrast the conditions of a bull quiet market with a bear volatile market where you have to deal with large price swings—mostly going down. Could the strategy just presented work “in reverse” on the short side? Probably not for many reasons:
- Wide stops limit potential reward on the downside. For example, a 25% trailing stop on a short position would give you a a maximum reward of only 4R win (i.e., if the company went bankrupt and the stock went to zero).
- Wide stops can be breached simply because of the inherent high volatility of bear markets.
- Bear markets do everything they can to psychologically press your buttons.
If and when you understand these aspects of bear volatile markets, however, you can design good systems that work well in those conditions. And some of you will be lucky enough to do that with us and other traders at the Sydney Systems Development workshop.
The All Ords Market Type by Year
So let’s look at the Van Tharp Institute Market Type Model for the Australian market by year over the last five years. For this, we combined the market SQN 100 score and a volatility measurement using ATR (Absolute True Range) for rolling 100-day periods to come up with the market type.
We won’t show any recent charts at the workshop (we’re not allowed to by regulation), so you might want to save the following graphs if you plan to attend. Recent charts would be irrelevant anyway when we’re teaching you how to develop a trading system that fits you and fits a market type. Plus, we’ll provide you an Excel spreadsheet at the workshop using the XLQ data retrieval tool that calculates the market type for you using the All Ords, the S&P ASX 200, or your preferred market index in Australia or elsewhere.
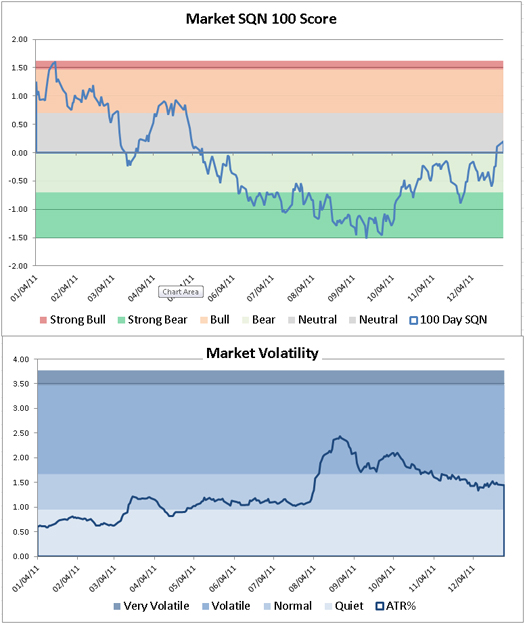
2011 All Ords
The chart below shows the market types over the last 12 months. If you trade issues on the ASX, how well did you do in 2011? How do you think you might have done if you’d had three systems to trade: one that works well in bull markets, another for neutral markets, and another for bear markets?
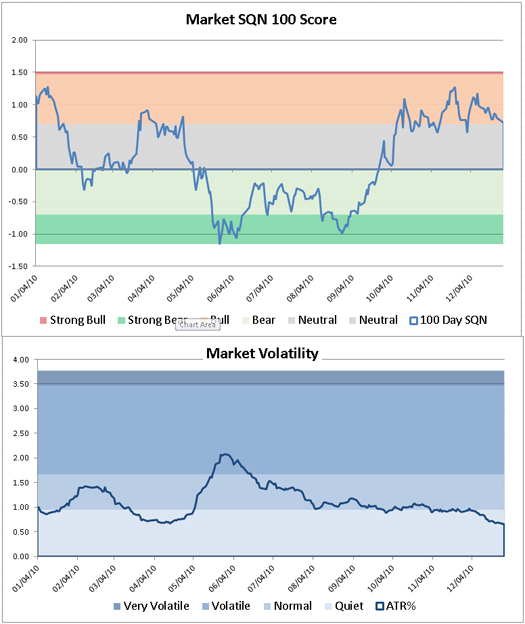
2010 All Ords
Now look at 2010. Again, all three market types were prevalent although the market never reached the strong bull mode.
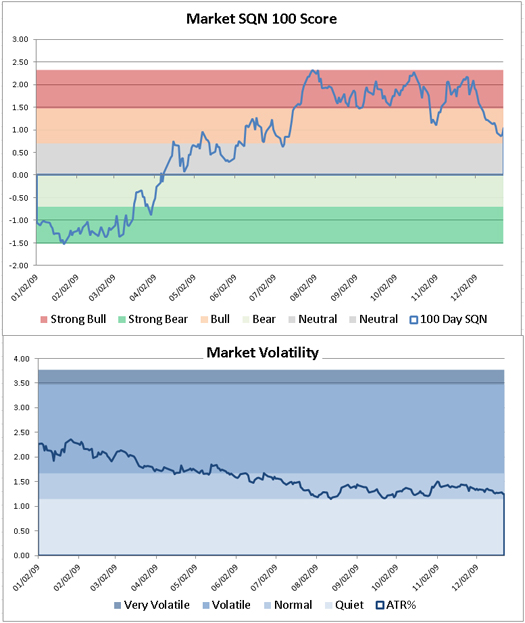
2009 All Ords
And how about 2009? The market spent nearly half of the year in a strong bull market. You could have been ready for that trading a good bull normal/quiet system starting in May or June based on the visible shift in market type.
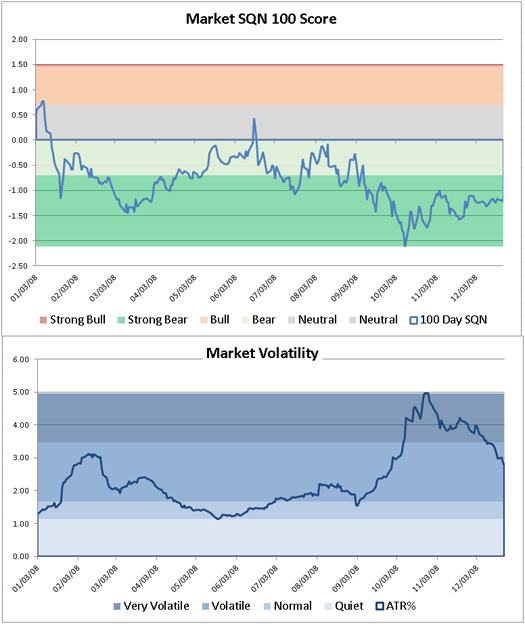
2008 All Ords
In 2008, the All Ords spent most of the year in the bear mode—much of it strong bear with very high volatility. Monitoring the market type would have helped you trade systems designed for bear volatile markets for this year. How well do you think you’d have done in 2008 if you were trading those kinds of systems?
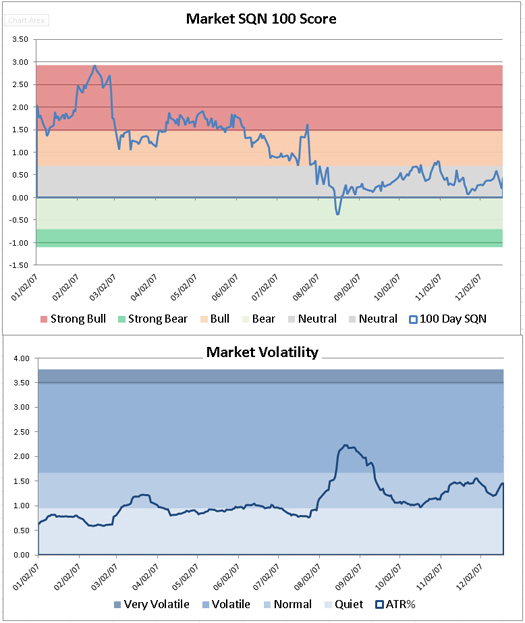
2007 All Ords
The All Ords in 2007 spent half the year in strong bull territory and then nearly six months in neutral territory before the nasty markets of 2008. If you had been following our market type indicators, you would have had your appropriate systems ready.
The Systems Development Workshop: Technical or Transformational?
After a recent Systems Development Workshop, one of our Australian Super Traders called it a “transformational” experience. That’s the kind of description we hear about the Peak Performance Workshops that focus more on psychology, not one of our “technical” workshops. The Super Trader said though that the workshop had totally changed his outlook about trading. We believe the Systems Development Workshop will change your outlook as well.
We only present Systems Development in Australia every five years or so, and we expect to sell out of seats. Book your space now while the early enrollment discount is still available.
We are also holding a Blueprint Workshop in Sydnedy next month, which will tell you everything you need to do to become proficient as a trader. This is the only workshop I know of where you can get all this material in just three days.
About the Author: Trading coach, and author, Dr. Van K. Tharp is widely recognized for his best-selling books and his outstanding Peak Performance Home Study program—a highly regarded classic that is suitable for all levels of traders and investors. You can learn more about Van Tharp at www.vantharp.com.
Trading Education
Dr. Tharp Will Be Down Under in February!
For the first time in years, Van will be presenting his Blueprint for Trading Success Workshop and his How to Develop a Winning Trading System That Fits You Workshop in Sydney, Australia
Blueprint for Trading Success
This is a complete structured program in which you’ll learn strategic, focused steps that will serve you throughout your entire trading career.
During these intensive, hands-on three days, you will learn 17 clear and concise tasks to master that will take your trading from ho-hum to visionary. You’ll see how all of Van Tharp’s strategic trading concepts fit into one seamless design for more predictable trading results. And you will leave with a thorough checklist of action steps to guide you to a higher level of performance. Your trading will never be the same.
Learn more...
How to Develop a Winning Trading System That Fits You
1. You'll get specific ideas for making better market entry and exit decisions.
2. You'll be introduced to the psychological pitfalls that hold back so many people.
3. You'll learn new approaches to the markets and new techniques for analyzing them.
4. You'll get practical trading ideas, talk with fellow traders to compare notes, exchange ideas, and make new friends who share your interests.
5. You'll participate in trading games that will teach you the relative importance of the ten element of a good trading system and how to apply them to your situation.
6. You'll collaborate with other like-minded traders to successfully develop a trading system for the type of trading you prefer.
Learn more...
 Trading Tip Trading Tip
January's First Five Days Indicator Revisited
by D.R. Barton, Jr.
Oft expectation fails, and most oft where most it promises.
– William Shakespeare
I’ve read and heard so much lately about the First Five Days Indicator in blogs, on CNBC, and even in the Wall Street Journal that I thought it would be useful for us to revisit this persistent myth.
Below is the reprint of that article in its entirety that I wrote in this same space three years ago. I think it explains very well the myth of the first five days of the year indicating market direction for the year.
Dismantling the First Five Days Indicator (reprinted from January 21, 2009)
Let’s do a little myth busting today—that savory task of uncovering another of the indicators that just don’t indicate what they’re supposed to. An indicator that gets lots of press early each year is the First Five Days indicator. Rest assured it just doesn’t work.
At the core of human nature is the desire to understand complex systems in simple terms. This human desire produces a problem though: we tend to apply this simplistic cause and effect model to very intricate problems and expect similar, easy-to-understand answers.
One good example is the Groundhog Day Indicator. Like the financial markets, weather systems are complex and difficult to predict. In spite of that reality, we have devised some simplistic ways to predict the weather, including the infamous groundhog, Punxsutawney Phil from Punxsutawney, Pennsylvania. If he sees his shadow on February 2, there will be six more weeks of winter weather.
Because we like simple explanations, we are more than willing to believe cause-and-effect explanations that really don’t make logical sense.
Maybe that’s why there are so many stock forecasting tools that use shaky logic and even shakier statistics to predict what will happen in the market in the days and months to come.
So let’s look at one of the most hyped indicators this week…
January’s First Five Days—It’s Popular, But It Ain’t Useful
Many market watchers and analysts are looking at the well-known First Five Days indicator, which has been popularized by Yale Hirsch’s Stock Trader’s Almanac.
For the record, I think the almanac contains a wealth of useful information. I keep one on my desk and gave two as Christmas gifts to friends and family. But back to our specific indicator…
The First Five Days indicator holds loosely that the direction of the first five trading days of the year are a valid predictor of the direction of the market for the remainder of the year.
As proof of the indicator’s effectiveness, its proponents look at a 59-year record and state that of 36 First Five Days that finished up, the stock market finished up in 31 of those years—an impressive 89% win rate for the predictor.
It has been quoted by such venerable sources as The New York Times, U.S. News & World Report, CNN and Money Magazine. Nevertheless, it’s a useless indicator, or worse, it’s potentially dangerous to your wealth.
Don’t Waste Your Time on This Meaningless Myth
Let me be blunt. The First Five Days indicator is the lowest form of analysis. It is the opposite of cause and effect. This is the type of analysis that looks for any cause to tie to an end effect, regardless of logic, and as we shall see, regardless of (supposed) statistical support.
The indicator is no more valid or useful than predicting the stock market based on Super Bowl winners or groundhog shadows. Here are three reasons why:
1. The logic is arbitrary. The raw numbers for this indicator show that the market has gone down during the first five days of January 23 times in the last 59 years. In those 23 occurrences, the market finished the year up 11 times and down 12 times.
So, the authors conclude that the indicator has no predictive value if it starts out to the downside. Looking at the same data, they like the results if the market starts out to the upside where it has “been right” 31 out of 36 times. Working in one direction but not the other is too arbitrary for me!
If the data doesn’t fit our hypothesis, then change the hypothesis to fit the data. This is classic “curve fitting” mentality. Do you want to risk any of your money based on that logic?
2. The triggering event is not statistically significant. For this indicator, all you need to trigger a yearlong market prediction is any up move for five days. This means that trivial moves in the market could shape your outlook for the coming year.
Suppose after five days the market was up only one quarter of a point. This would still trigger the indicator’s prediction for an up year.
What’s the problem with having a move of any magnitude trigger an indicator? A tiny move doesn’t tell us anything about what the market is doing. A small move either up or down is just random; it’s just part of the background “noise” of the market.
So how do we decide what is meaningful and what is just background noise? One measure that many analysts use is the average volatility of a price movement. Long-time readers know that I use the Average True Range (ATR) of price as a measure of volatility. (In simple terms, ATR measures the average size of the daily range, the high minus the low, while accounting for gaps between bars.)
If we look at the ATR for a five-day move, we would want our trigger to move up or down at least half of the average. Anything less would almost have to be considered random.
With that in mind, your industrious writer dug deep into the details of the First Five Days indicator’s raw data. I calculated the S&P 500 index’s ATR during the first five days for the last 25 years and checked to see how many of the First Five Days trigger signals could be considered more than random. The answer: only 7 out of 25!
3. The sample population is too small. When we eliminate the trigger signals that are mere noise, we now only have 13 to 16 triggers of the indicator over the last 55 years. This is not a statistically significant sample to base any predictions on, and this indicator is uncovered as just some simplistic curve fitting that doesn’t mean a thing for traders and investors.
There is plenty of good analysis for you to use to help guide your trading and investing decisions. So it makes a lot of sense to throw out the overly simplistic, statistically meaningless ones like the First Five Days indicator.
One Note of Caution
The indicator worked last year (2008) but be aware of a psychological bias about recent events: we tend to assign an excessive amount of meaning to the most recent data points. Avoid falling into this trap with the First Five Days indicator.
You can still use it for cocktail party discussions, but don’t waste any money by trying to apply it to help you make sense of the markets. Let’s put this endless jabber about the First Five Days aside and concentrate on things that can really help in the markets over the long term.
Back to 2012
In addition to the well-reasoned dismantling of the First Five Days myth from the article three years back, here’s another blow against the indicator’s seeming cause and effect: since their inception, worldwide stock markets have been in an uptrend. Populations have grown, economies have expanded, and asset classes have appreciated. These factors have given an upward bias to stock markets. So market movement in the first five days of the year is not a useful indicator, just part of an equation that we already understand—in general markets go up. This is a known result. At least until the nature of worldwide expansion changes, this will remain the case.
For the curious, the indicator was "wrong" last year but “right” in 2009 and 2010.
Next week we’ll look at a distant cousin of the First Five Days indicator that actually is useful. Until then…
Great Trading,
D. R.
About the Author: A passion for the systematic approach to the markets and lifelong love of teaching and learning have propelled D.R. Barton, Jr. to the top of the investment and trading arena. He is a regularly featured guest on both Report on Business TV, and WTOP News Radio in Washington, D.C., and has been a guest on Bloomberg Radio. His articles have appeared on SmartMoney.com and Financial Advisor magazine. You may contact D.R. at "drbarton" at "vantharp.com".
Fun
Click here to see pictures from our last client dinner with Van and Kala Tharp

Ask Van...
Everything that we do here at the Van Tharp Institute is focused around helping you improve as a trader and investor. Therefore, we love to get your feedback, both positive and negative!
Click here to take our quick, 6-question survey.
Also send comments or ask Van a question by using the form below.
Click Here for Feedback Form »
Back to Top
Contact Us
Email us [email protected]
The Van Tharp Institute does not support spamming in any way, shape or form. This is a subscription based newsletter.
To change your e-mail Address, click here
To stop your subscription look at the very bottom, left corner of this email and click on that link.
How are we doing? Give us your feedback! Click here to take our quick survey.
800-385-4486 * 919-466-0043 * Fax 919-466-0408
SQN® and the System Quality Number® are registered trademarks of the Van Tharp Institute
Back to Top |


