Tharp's Thoughts Weekly Newsletter (View On-Line)
-
Article You Only Trade Your Beliefs by Van K. Tharp, Ph.D.
-
-
Trading Tip The VIX: Fear Gauge Extraordinaire by D.R. Barton, Jr.
-
Mailbag Multiple Positions in a Single Stock
-
Reserve Your Seat NOW
for Dr. Ken Long's
Core Trading Systems Workshop
If you want to improve your money’s returns, but you don’t necessarily have a desire to become a day trader or swing trader, Dr. Ken Long’s newest workshop, Core Trading Systems: Market Outperformance and Absolute Returns, is just the workshop for you.
Learn more...

You Only Trade Your Beliefs
by Van K. Tharp, Ph.D.
I’ve often said that you never trade the market; instead, you trade your beliefs about the market.
What is the market? It’s billions of ticks coming into a central place to buy or sell. The market price is the collection point for all of the emotions and thought processes behind every one of those orders at any given moment. But that’s not what you trade. You look at a chart—probably with a lot of indicators, and your beliefs about the chart or the indicators form the basis for what you think might happen. That’s what you trade—your beliefs.
One of my beliefs is that measuring the 100-day SQN® score of the market each month is a useful exercise. All I do in the monthly market update is give you a reading of what the market was doing at the time I wrote the monthly market update article.
At the end of September, the 100-day market SQN score said we were in bear market conditions. The chart below shows a monthly candlestick chart of the SPY (the S&P 500 ETF) over two years through September 2011. How would you interpret this chart?
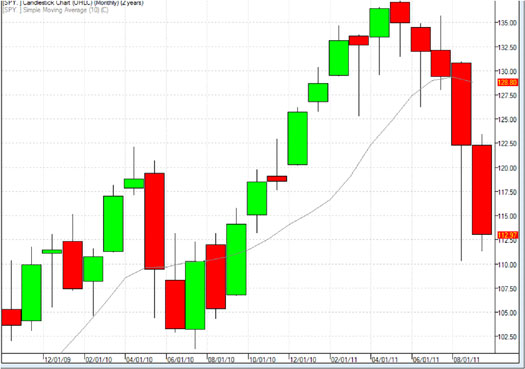
It looks pretty clear to me. One of our readers, however, had different beliefs about the market and sent me this email in the second week of October:
I read your market update regularly. Years ago I used to read the Elliott wave expert Bob Prechter's market update. I found one thing common to both of you: you both were saying that we are in a bear market. But the market kept moving up. For example, the market is up at least 10% in the last 10 days.
You both have decades of experience and have strong knowledge in the market analysis. With so much knowledge and experience, how you two can be consistently so wrong?
After the September monthly market update was published, this reader watched the market go up for 10 days and decided that 1) I had made a market prediction, and 2) my ability to predict was terrible. I do not make market predictions; I simply report what is going on in the markets at the time I write each market update.
Below is a monthly chart of SPY through October 12th. What would you say, is the market going up or down?
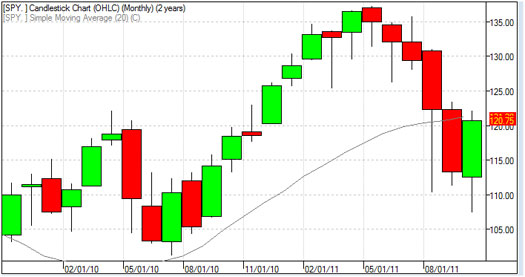
So far, the market produced a new low in October, and it has not taken out the September high. (Editor’s Note: Since Van wrote this article late last week, the October SPY high did exceed the September high by $0.10.) Is the market going up or down? I’m just asking you to observe what is happening right now—this has nothing to do with prediction.
If the reader who sent me that note were a day or swing trader, I could understand how he would see the market as having had a strong short-term, up move. Regardless, I share the reader’s comment simply to illustrate how different people have different beliefs. Even the definition of a bear market varies from person to person.
So let’s see what the 10 days that the market was in an up move looks like with an hourly chart from the afternoon I received that email.
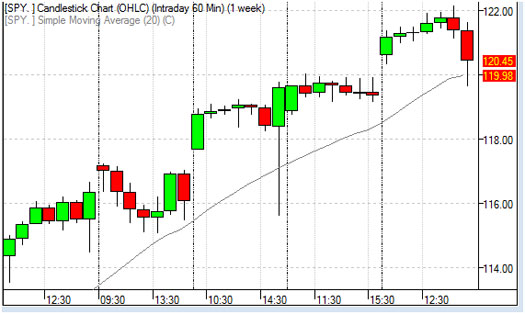
On an hourly basis, is the market going up or down? Does the chart say anything about where the market will go tomorrow? Do you see a low-risk trade to the upside? Do you see one to the downside? I will have readers that answer “Yes” or “No” to either or both of those questions. What trade you might take or pass on is all based on your beliefs.
When I want to know what the market is doing now, I just look at a chart. Some would refer to this as a technical approach to the markets. But someone could form beliefs by studying the economic fundamentals rather than at a chart. And even the fundamentals are not good:
- The market runs in secular (long-term) cycles where the PE ratio goes up (bullish) or down (bearish). These cycles usually last 15-20 years and the last down cycle started in 2000. See www.crestmontresearch.com.
- According to Shadowstats.com, we have been in a recession since 2000 (with the exception of the 4th quarter of 2003). The original formula for a recession involves calculating the growth of the GDP minus inflation using the real CPI formula. Now, however, the federal government uses a manipulated GDP/CPI formula that says we have been officially in a growth economy for much of the last ten years.
- Even though we are in a recession, the government is currently running annual deficits of a trillion dollars. And I can see no way out (my belief) of this problem.
- The St. Louis Federal Reserve Bank published a study, located on their web site, which says that the United States (with unfunded future obligations estimated at $67 trillion at the time of the report) is bankrupt. Presently, those unfunded future obligations could be more than $100 trillion.
- US debt is asymptotic as illustrated by the following chart (which does not include the unfunded future $100 trillion obligations).
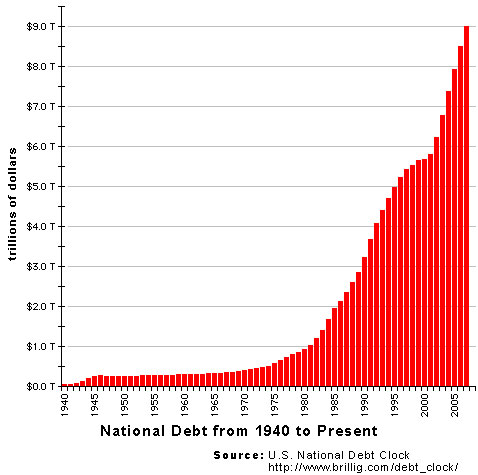
This graph includes the costs of WWII, which hardly bumped the curve compared to now. It also includes the Vietnam War—again, barely a bump. Do you remember what happened to the NASDAQ when its chart looked like this debt curve?
But wait, there is more!
- We just had an equity implosion due to the subprime crisis where about 30% of the wealth of the world evaporated.
- There is still a huge systemic exposure to derivatives (i.e., $93 trillion from JP Morgan alone).
- The Euro (to say nothing of the dollar) could collapse tomorrow or 5-10 years from now.
Now these statements are all the result of my beliefs. As I see it, my job is to show you what is. Any conclusions you might draw from my observations are based on your own cause-effect type beliefs. And, of course, some of you, to feel more secure, may want to believe that the worst of the economic crisis is over and everything will return to normal.
Your job, though, is not to predict the market from what I say. Your job, as I see it, is to find low-risk ideas in this particular climate. Good traders do this all the time.
Once you truly get how understanding what you believe defines your world, your life changes. One of my favorite quotes about beliefs comes from Harry Palmer, the founder of Avatar:
"You experience what you believe, unless you believe you won't, in which case you don't, which means you did."
What do you believe?
About the Author: Trading coach, and author, Dr. Van K. Tharp is widely recognized for his best-selling books and his outstanding Peak Performance Home Study program—a highly regarded classic that is suitable for all levels of traders and investors. You can learn more about Van Tharp at www.vantharp.com.
Trading Education
$700 Early enrollment discounts expire in just a few weeks our
Systems workshops in November.
| Nov 12-13 |
$2,295
$2,995
|
Core Trading Systems: Market Outperformance and Absolute Returns
Learn longer term systems that only require a short amount time each week to trade.
Presented by Ken Long |
Cary, NC |
| Nov 14-16 |
$2,295
$2,995
|
How to Develop a Winning Trading System That Fits You
Learn the key elements to outstanding trading systems so you can build your own systems or properly adapt other systems to fit you.
Presented by RJ Hixson and Ken Long |
Cary, NC |
Click here to see our full workshop schedule with details
Click here to see locations, logistics, etc.
Read a recent interview with Ken Long

Trading Tip
The VIX: Fear Gauge Extraordinaire
by D.R. Barton, Jr.
I love things that just plain work. I have a simple car-top ski carrier that cost me $40 brand new in 1986. It is merely a set of nylon straps with some epoxy-coated hooks that grab onto the car’s door frame—none of which damages my car’s paint job. Attached to the nylon straps are four sets of plastic ski holders with ingeniously simple elastic ties that secure the skis. I can install the rack and toss four sets of skis on it in a matter of 3-5 minutes. I wouldn’t trade it for any fancy, $500 roof rack out there. I’ve even tried to find another one like mine, but I’m pretty sure they quit making these 15 years ago! (So please don’t write and ask where to buy one.)
My list of “things that just plain work” is fairly short:
- Ski carrier: Shadrack by Allsop
- Can opener: the classic Swing-a-Way (It costs $8—why buy anything else?)
- Whistle: The Acme Thunderer (those newfangled whistles with no pea in 'em sound terrible). I’ve used the same one for coaching and refereeing since 1979.
You get the picture: these are simple tools that have stood the test of time. They don’t break. They do their job, and they do it well. A tool that meets these criteria for traders and investors is the CBOE Volatility Index (VIX).
A Trading Tool That Writes the History Books
This past week, I’ve read no fewer than half a dozen articles that talked about how the VIX is finally dropping—which is good news for the markets. So for now, this sentiment indicator is back in vogue.
Analysts like to say that VIX is the market’s fear gauge; it rises as fear levels escalate. That description of the VIX is hard to argue with if you look at the following chart. The upper graph shows monthly S&P 500 bars, and the lower graph shows the corresponding monthly bars for the VIX.
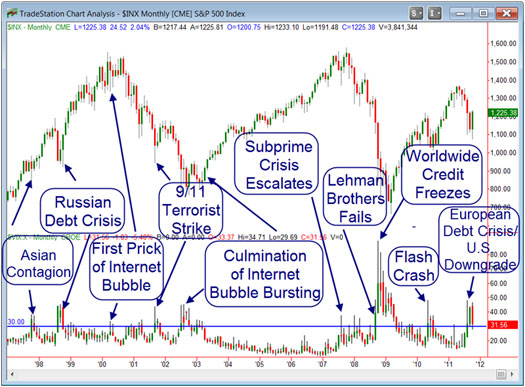
You can see the financial history of the world being reflected by the VIX in real time. Every significant financial crisis has resulted in a higher VIX reading. From the Asian Contagion in 1997 to the current crisis in Europe, when market participants are afraid, VIX spikes up. The traditional level of concern is 30 (shown by the horizontal blue line in the chart above). And every trip the VIX takes above that level tells a story.
To get a better picture on what’s happening now, let’s look at the same S&P/VIX chart in a weekly timeframe.
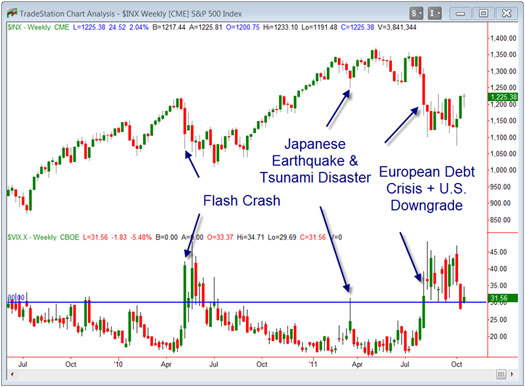
The weekly chart shows the recent VIX long-term stay in rarefied territory—above the psychologically important level of 30. In fact, in the last 53 trading days, the VIX closed below 30 only once in two and half months! After remaining at its lofty heights for some time, the noticeable drop in VIX since October 5 caught the attention of analysts and talking heads. Despite this recent attention, prudence (and history) dictate that traders not bet big on an extended bull rally until we see a series of closes under the 30 point level.
Will that happen? A lot of factors play into the current level of fear in the market. To be fair, VIX does not actually measure fear; it mathematically measures the difference in put and call prices on S&P 500 index options. Next week, we’ll dig into the math (just a bit!) and the history of this indicator to see its strengths and weaknesses and how we might best use this valuable tool. Until then…
Great Trading,
D. R.
About the Author: A passion for the systematic approach to the markets and lifelong love of teaching and learning have propelled D.R. Barton, Jr. to the top of the investment and trading arena. He is a regularly featured guest on both Report on Business TV, and WTOP News Radio in Washington, D.C., and has been a guest on Bloomberg Radio. His articles have appeared on SmartMoney.com and Financial Advisor magazine. You may contact D.R. at "drbarton" at "vantharp.com".

Peak Performance Home Study Program for Traders and Investors
YOU are the most important factor in your trading success!
You create the results you want. Going through this home study course, you’ll gain a perspective on the "how" and "why" of your past trading results and learn techniques to increase profits and reduce stress.
Your success as a trader depends upon the amount of work you put into applying the principles of the course to your investing and trading. Get started now and take charge of your trading success!
Learn More
Buy Now
Mailbag
Multiple Positions in a Single Stock Q: I have 3 systems I use to trade GLD and another 3 that I use to trade SPY.
All systems have separate entries and stops. If I risk 2% per position, and I get taken into three positions on GLD, I would have an open risk of 6%. This seems high. Would I be better off keeping my risk to 3% total per instrument?
A: You really don’t have three positions in GLD or three in SPY—you only have one position in each with three entries and exits. If you want to maximize your total exposure to GLD or SPY at 2%, you would only risk 0.67% per position in each. If you wanted 3% max exposure, you could risk 1% per position. Your optimal risk amount per position will depend on your portfolio heat limits, your individual system performance, and your trading objectives.
Ask Van...
Everything that we do here at the Van Tharp Institute is focused around helping you improve as a trader and investor. Therefore, we love to get your feedback, both positive and negative!
Click here to take our quick, 6-question survey.
Also send comments or ask Van a question by using the form below.
Click Here for Feedback Form »
Back to Top
Fun
Click here to see fun photos from last month's client dinner!

Contact Us
Email us [email protected]
The Van Tharp Institute does not support spamming in any way, shape or form. This is a subscription based newsletter.
To change your e-mail Address, click here
To stop your subscription look at the very bottom, left corner of this email and click on that link.
How are we doing? Give us your feedback! Click here to take our quick survey.
800-385-4486 * 919-466-0043 * Fax 919-466-0408
SQN® and the System Quality Number® are registered trademarks of the Van Tharp Institute
Back to Top |


