|
With a market type approach to trading, you have less worry.
|
|
|
|
|
|
Tharp's Thoughts
Inbox Mentoring
|
|
|
|
|
|
|
|
-
Feature: August 2018 Market Update by Van K Tharp
-
-
Tips: August 2018 SQN Report
-
-
GDPR: Read Our GDPR Statement
|
|
$700 Early Bird Discount Expires Tomorrow, September 6th on
USA How To Develop Winning Trading Systems That Fit You
Register by tomorrow to get your best price
in addition to snagging one of the remaining seats in this USA event.
Seats in the London event are still open and discounted at the early bird price.
|
|
|
|
|
|
September 14-16
Friday-Sunday
|
|
|
|
|
|
|
|
|
|
|
|
October 16-18
Tuesday-Thursday
|
|
|
|
|
|
|
|
|
|
August 2018 Market Update:
Strong Bull Quiet Market Type
Van K. Tharp Ph.D.
|
|
|
|
|
I always say that people do not trade the markets; they trade their beliefs about the markets. In that same way, I'd like to point out that these updates reflect my beliefs. I find the market update information useful for my trading, so I do the work each month and am happy to share that information with my readers. If your beliefs are not similar to mine, however, then this information may not be useful to you. Thus, if you are inclined to go through some sort of intellectual exercise to prove one of my beliefs wrong, simply remember that everyone can usually find lots of evidence to support their beliefs and refute others. Simply know that I admit that these are my beliefs and that your beliefs might be
different.
These monthly updates are in the first issue of Tharp's Thoughts each month which allows us to get the closing data from the previous month. These updates cover 1) the market type (first mentioned in the April 30, 2008 edition of Tharp's Thoughts), 2) the debt statistics for the US, 3) the five-week status on each of the major US stock market indices, 4) our four-star inflation-deflation model, and 5) tracking the US dollar. I also write a report on the strongest and weakest areas of the overall market as a separate SQN™ Report. Significant market changes may mean the SQN Report comes out more than once a month.
Part I: The Big Picture
The S&P 500 made a new high at the end of August for the first time since January. The bullish trend continues. For how long, I don’t know. Trends continue until they are done. This market update is about what the market is doing, not about predicting what it will do.
|
|
|
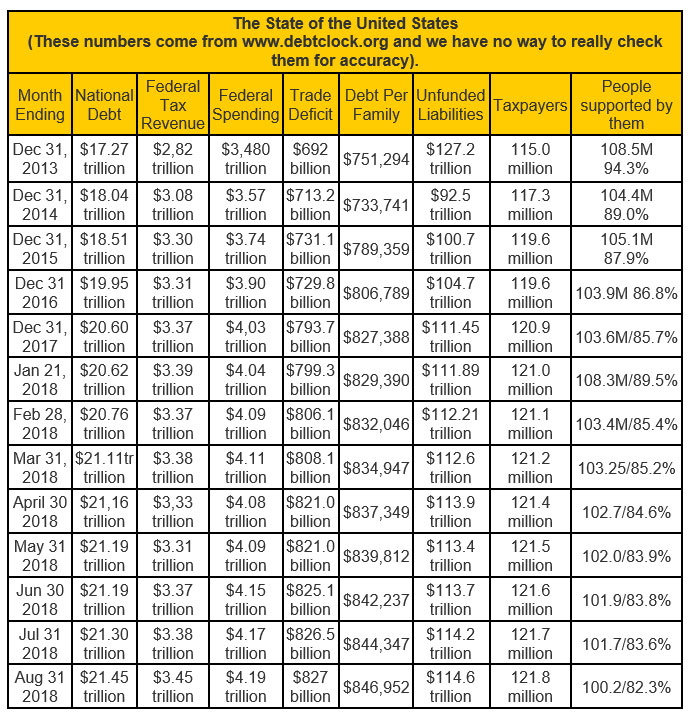
One thing changed about the US Debt Clock website this month (or at least I just noticed), now it lists US assets. Total US assets (includes small business assets, corporation assets, and household assets) are $138.0 trillion. But then consider that our unfunded liabilities are $114.6 trillion. In addition, the total liability per taxpayer is $940,475 and the total assets per taxpayer are $420,167. This trend has been going on for years and thus is likely to continue. But one day it will all collapse.
The people supported by the taxpayers include retirees (52.2M), disabled people (10.2 M), those getting food stamps (38.8M) or 100.2 million people in total. So this group is 82.3% of the 121.8 million taxpayers now. This is one statistic that has been trending down during the Trump years. In January 2018, it was 89.5%
Part II: The Current Stock Market Type Is Strong Bull Quiet
This is a big change from neutral quiet.
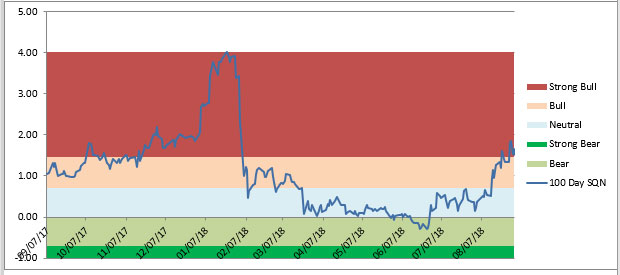
It was an interesting month in the directional component for the market type. The Market SQN scores for the various periods we monitor look like this –
• 200 days – Bull in July, Bull again in August
• 100 days – Neutral in July, now Strong Bull
• 50 days – Bull in July, Bull again
• 25 days - Bull in July, now Strong Bull
Last month, all of the Market SQN scores were at least bull except for the 100 day period. Now they are all bull or strong bull. This is a very strong trend. Here is the chart for the Market SQN score for 100 days –
|
|
|
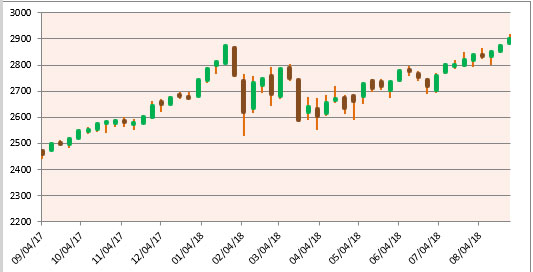
You can see in the S&P bar chart below that we had a strong upward trend for the last half of last year, followed by a correction and a lot of volatility very early in 2018. And now we’ve had a strong upward trend since April. We are now in the longest bull market in history (if you consider that it ends with a correction of more than 20%). The Fed has been raising short-term rates and we are near a rate inversion (a sign of a recession within a year) which will be likely if there is another rate hike. It takes a year from that signal, however, for a recession to hit and right now we are strongly into the result of the Trump tax cut for corporations which will result in immense profits. So watch what the markets
are doing – not what you think might happen.
|
|
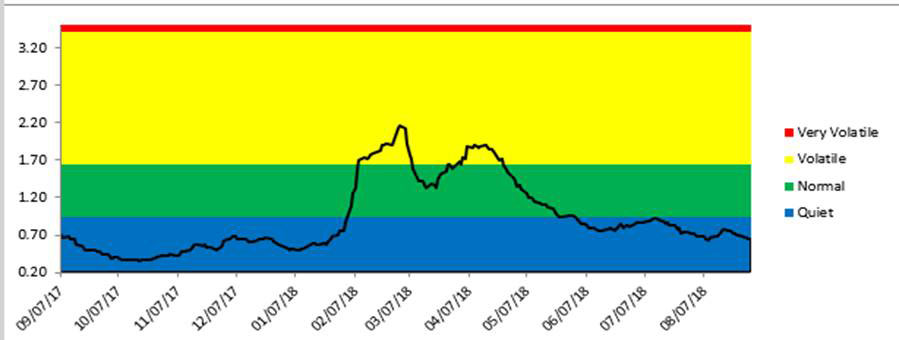
Meanwhile, volatility remains low and in the quiet range – a good sign that the bull market will probably continue.
|
|
By the way, I’ve seen two newsletters recommend recently 3X leveraged ETFs. Don’t buy them. The percentage gain or loss is recalculated every day so you can lose money – even when you are right about the direction. Those who recommend them are just naïve to this information. Stay away. Look for stocks that have nice straight uptrends and load up on them.
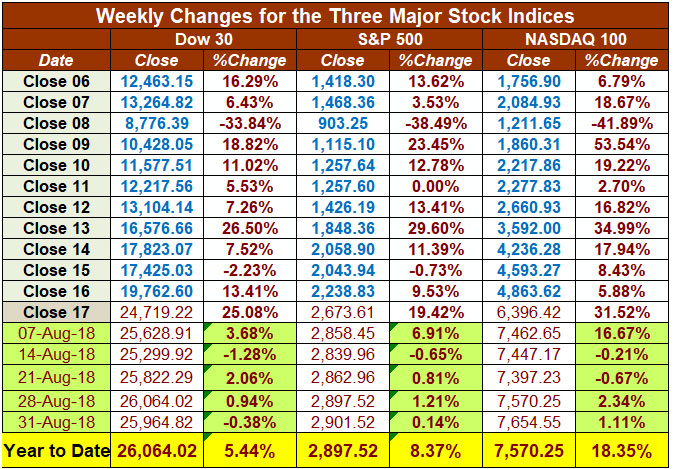
Here are the weekly changes in the three major stock indices over the last month.
|
|
The NASDAQ continues to lead the indices with the largest gain. All three indices are up nicely but the NASDAQ is up nearly 20% on the year. Look at Apple, Alphabet, and Amazon and you will see why.
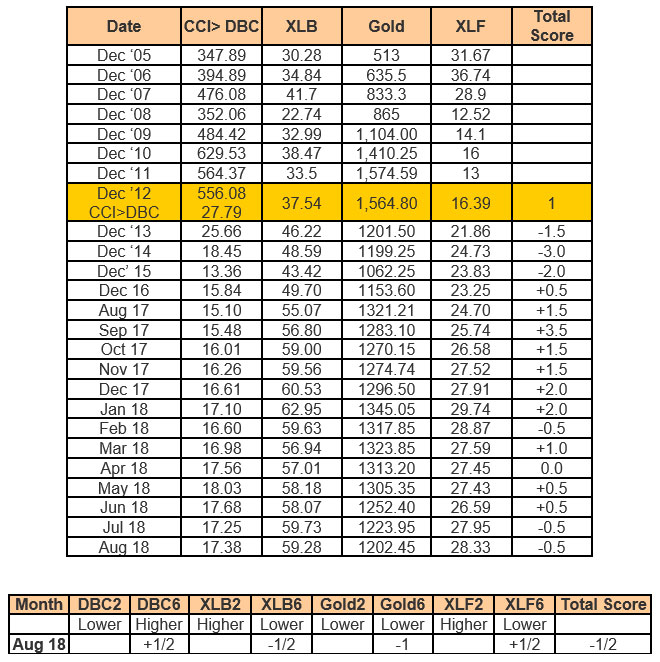
Part III: Our Four-Star Inflation-Deflation Model
The model has had different price movements in the component prices for two months back and six months back – some of which is inflationary and some of which is deflationary.
|
|
Our results show deflation over the last two months but the Fed is raising interest rates because it sees inflation approaching.
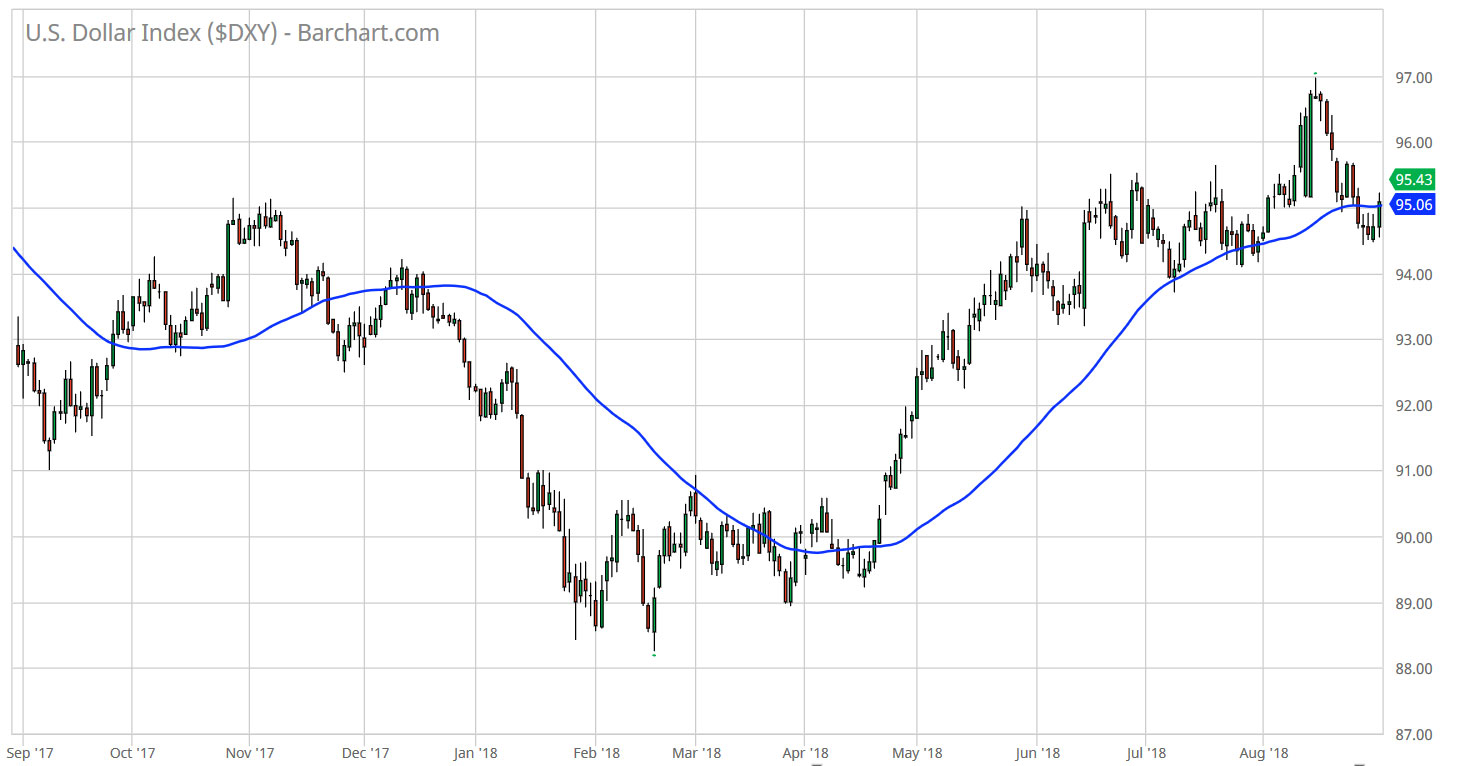
Part IV: Tracking the Dollar
The USD looked like it might break out to the upside in mid-August but it came back down into the trading range it has been in since late May.
|
|
|
Conclusion
The S&P peaked on January 26 closing at 2872.87. The index set the first new closing high since then on August 24th at 2874.69. It set two more new all-time high closes and five new intraday highs in the last week of August. It finished the month on August 31st at 2901.52.
With a market type approach to trading, you don’t have to speculate if the market will keep making new highs or if it will correct. You don't have to worry about which way the market is heading next. Instead, you simply need to:
1) pay attention to the market right now and
2) consider alternatives for the upcoming period.
What is the market doing now? It’s in a strong bull quiet market type. Trade systems that work well in strong bull markets. This could be as simple as buy and hold with a trailing stop. I think my retirement portfolio was up about 7% last month. Holding positions in these kinds of markets makes you look like a trading genius. But once you start to really believe that you are a genius, then the markets are probably about ready to turn.
Until next month’s update, this is Van Tharp
|
|
|
|
About the Author: Trading coach, and author, Dr. Van K. Tharp is widely recognized for his best-selling books and his outstanding Peak Performance Home Study program - a highly regarded classic that is suitable for all levels of traders and investors. You can learn more about Van Tharp www.vantharp.com.
|
|
|
|
|
|
|
|
|
August 2018 SQN Report
Van K. Tharp Ph.D.
|
|
|
|
|
There are numerous ETFs that track everything from countries, commodities, currencies and stock market indices to individual market sectors. ETFs provide a wonderfully easy way to discover what’s happening in the world markets. I apply a version of my System Quality Number® (SQN®) score to measure the relative performance of numerous markets in a world model.
The Market SQN score uses the daily percent change for input over a 100-day period. Typically, a Market SQN score over 1.47 is strongly bullish and a score below -0.7 is very weak. The following color codes help communicate the strengths and weaknesses of the ETFs in this report:
- Dark Green: ETFs with very strong Market SQN scores > 1.47.
- Light Green: ETFs with strong Market SQN scores (0.70 to 1.47).
- Yellow: ETFs with slightly positive Market SQN scores (0 to 0.70). These are Neutral/Sideways.
- Brown: ETFs with slightly negative Market SQN scores (0 to -0.7).
- Red: Very weak ETFs that earn negative Market SQN scores (< -0.7).
This is basically the same rating scale that we use for the Market SQN Score in the Market Update. The world market model spreadsheet report below contains a cross section of currently available ETFs; excluding inverse funds and leveraged funds. In short, it covers equity markets around the globe, major asset classes, equity market segments, industrial sectors, and major currencies.
World Market Summary — Equities & Currencies
Each month we look at the equities markets across the globe by segment, region, and sector.
The US Dollar continued its strength in August and is the only green currency. Everything in the database is in the US Dollar so this makes foreign assets seem weaker – and that’s the way the entire model looks. Asia, Europe, and the rest of the Americas look pretty weak.
In the US last month, there were only two green market segments. Now everything is dark green with only two light green sectors. It’s one of those times were people who are fully invested look like market geniuses.
Elsewhere in the Americas, it is not so good. Canada is still yellow but Mexico is brown and everything else is red.
Asia has two yellow countries – Australia and India while the remaining countries are really down. China, Singapore and South Korea are red. Everything else is brown.
Europe also has two yellow countries – Sweden and Switzerland. Belgium and Spain are red while everything else is brown. Again, this is probably due to the strong dollar.
|

|
|
In currencies, the ETF for the USD (UUP) is the only green currency with most of the other symbols in the red. This is similar to last month. And like July, only one other currency is even positive – JPY/USD (JYN). The other yellow issue is the currency harvest strategy ETF, DBV – not an actual currency. The Bitcoin trust symbol (GBTC) is slightly less weak but still negative for the month.
Now we are starting to see dark green in the market sectors as well. The really strong ones are health care, consumer discretionary, pharmaceuticals, retail, REITs, technology, and software. The light green sectors include biotech, oil and gas exploration, utilities, biotech and genome, media, networking, telecom, and transportation. There are 11 yellow sectors and four brown. The weakest ones are homebuilders (interest rates are going up), metals and mining, oil and gas exploration, gaming, and the weakest one is volatility because the market is very quiet.
Commodities, Real Estate, Debt, and the Top and Bottom Lists
The August commodities sections is a little different with natural gas being the only green symbol. Commodities, oil, global water, and global agribusiness are all yellow. But there are now three brown sectors: coal, steel, and timber. These are all being impacted by Trump’s trade tariffs. And the following sectors look very weak - gold, silver, base metals, agriculture, and livestock.
Real estate looks very weak (red and brown) – again, interest rates going up have an effect. But the interest rate product section doesn’t look that bad. It’s all yellow or green. Long term bonds are yellow and short term bonds are green. The only brown sector is the corporate bonds.
|

|
|
On the top list, one ETF now has a Market SQN score of 3.44 - the floating rate bond ETF. And everything in the top 15 is above 2.2. Health care seems to predominate along with some small cap ETFs.
The weakest ETF list is all red again this month and seven of the 15 have scores below minus 2. Here we are looking at many ETFs in metals and bonds. Countries like Nigeria and Turkey are also in the bottom.
Summary
Let’s look at the summary table which measures the percentage of ETFs in each of the strength categories. You can see the distribution of the database by Market SQN score in bullish, neutral and bearish categories below -
|

|
|
The markets become much stronger in August with the strongly bullish moving up from 1.1% to 14.6%. Overall, 31% of the ETFs are bullish, 26% are neutral, and 40% are bearish. Last month it was 12% / 36% / 52 %
Be careful to base your actions upon what IS happening, not what you think might happen. The markets always offer opportunities, but to capture those opportunities, you MUST know what you are doing. If you want to trade these markets, you need to approach them as a trader, not a long-term investor. We’d like to help you learn how to trade professionally because trying to navigate the markets without an education is hazardous to your wealth. All the beliefs given in this update are my own. Though I find them useful, you may not. You can only trade your own beliefs about the markets.
Until next month this is Van Tharp.
|
|
|
|
|
|
September 14-16
Friday-Sunday
|
|
|
|
|
|
|
The How to Develop Winning Systems Workshop teaches you what you need to know to develop your own system. The material you will learn is not market or time-frame specific. So whether you trade stocks, futures, currencies, gold, etc., or
whether you place 50 trades per day or 50 trades per year, you will learn all of the components that work in any system. With this knowledge you can both modify existing systems to fit you or the market type better, or master your own system development. Two locations to choose from, Cary, NC in September and London, England in October!
Only a few seats remain in the U.S. September event. If you're considering taking this workshop register now before it is also sold out. $700 Early Enrollment discount expires TOMORROW, September 6th.
|
|
|
|
Presented by Libby Adams and RJ Hixson
|
|
|
|
September 18-21
Tuesday-Friday
|
|
|
|
|
|
Peak Performance 202 is SOLD OUT! Look for the next event January 2019.
|
|
October 2018 - LONDON, ENGLAND
|
|
|
|
Presented by Van Tharp,
with RJ Hixson
|
|
|
|
October 12-14
Friday-Sunday
|
|
|
|
|
|
|
|
Do any of the following sound like you?
- Are you always looking for a new trading system? Or, are you always trying to improve the one you have?
- Do you find your trade setups never quite fit all of your criteria so you have trouble entering trades?
- Do you get anxious about the market or get anxious about risking your money so that you have trouble pulling the trigger?
- Do you get excited and ignore your rules or do you get distracted and fail to follow your system's rules?
- Does a losing trade take your energy away from the next trade or conversely, does a winning trade make you confident about the next trade?
- Is your trading (or your life?) ruled by fear, anger, greed, or shame?
- Are you constantly losing money?
- Do you lack a strong plan to guide your trading or do you fail to follow the plan you created?
- Do you have a performance ceiling where you fall apart or stop doing well consistently? Does your account reach a certain size and then it plateaus or you start losing money at that point?
If you answered yes to any of these questions, then you are experiencing some form of self-sabotage. But don’t worry, these are some very common patterns for traders and you can overcome them in order to reach your potential. This workshop will help you identify and resolve the underlying conflicts causing these patterns — as well as leave you with the tools to address conflicts that come up in the future for you.
It's been Van Tharp's cornerstone workshop for over three decades. Read more to learn the benefits you will walk away with.
Peak Performance is also a very important workshop to put on your calendar if you want to qualify for and apply to the Super Trader Program.
|
|
|
|
October 16-18
Tuesday-Thursday
|
|
|
|
|
|
|
The How to Develop Winning Systems Workshop teaches you what you need to know to develop your own system. The material you will learn is not market or time-frame specific. So whether you trade stocks, futures, currencies, gold, etc., or
whether you place 50 trades per day or 50 trades per year, you will learn all of the components that work in any system. With this knowledge you can both modify existing systems to fit you or the market type better, or master your own system development.
|
|
Presented by Gabriel Grammatidis
|
|
|
|
October 20-22
Saturday-Monday
|
|
|
|
|
|
|
|
Presented by Gabriel Grammatidis
|
|
|
|
October 23-24
Tuesday-Wednesday
|
|
|
|
|
|
|
|
The Theory: All You Need to Know About Forex
Gabriel will spend most of the workshop teaching his trend-following systems. The first half day is spent to go over the specifics of trading the Forex market and cover such topics as:
- Why trade Forex?
- What are the advantages and drawbacks of trading Forex versus other instruments?
- What are the main market characteristics, and who are the Forex market participants?
- What methods work best in the Forex market?
- All you need to know about Forex trading sessions and the currency pairs.
- How are Forex chart characteristics different than stocks or futures?
- What do you look for in a Forex broker? What do you avoid?
- Why Forex may actually be the best market for new traders to learn trading.
- What are the trading edges that work in Forex?
- The Method
Gabriel teaches three specific trading systems. All three are trend-based; you can see the price action patterns in the price charts. His systems can be traded in various timeframes and can be traded across a wide range of currency pairs. Attendees of Gabriel’s workshops enjoy swing trading the systems using primarily 5-min ,15-min, 60-min and daily candle charts. The trades tend to evolve over a timeframe of anywhere from several hours to a couple of days (or even weeks, in the case of strong trends).
Two additional days of live forex trading side-by-side with Gabriel is available as well for hands on trading experience.
|
|
|
|
October 26-28
Friday-Sunday
|
|
|
|
|
|
|
|
In this workshop, you begin to build your plan that includes specific, actionable steps you can begin as soon as you get back home. Here are some of the benefits of attending the workshop:
- Assess your beliefs about trading and about yourself so you can leverage your useful beliefs and eliminate the ones that are holding you back.
- Learn how to steer your entire system development process through your objectives.
- Find the key ingredient that most traders and investors are missing in their objectives that will make you thrive financially.
- Create a business plan with 3 trading strategies compatible with the big picture so your trading results are consistently profitable.
- Learn the 8 critical areas of contingency planning that most traders find out about the hard way (i.e., the expensive way). Developing plans for contingencies minimizes the risks to your trading business that could otherwise wipe you out.
- Discover how to leverage the strengths of your personality type and minimize your personal challenges to improve your trading.
- Learn how to cultivate the most important attitude required for successful trading.
|
|
|
|
Presented by Ken Long
Monday includes instruction plus live trades
|
|
|
|
November 10-11-12
Saturday-Monday
Note schedule change.
|
|
|
|
|
|
|
|
|
|
Exciting New Work from Van Tharp
|
|
|
|
November
15-17
Thursday-Saturday
|
|
|
|
|
|
|
|
|
|
FREE Book!
We pay for the book, you just pay for shipping.
When you add the free book to an item already being shipped there is generally no extra shipping charge (of course, depending on your location).
Read Van’s Latest Book —
TRADING BEYOND THE MATRIX
The Red Pill for Traders and Investors
Eleven traders tell their stories about transforming
their trading results and lives, in this 400 plus page book.
Below is a brief video on how powerful this book is to traders.
|
|
|
|
GDPR COMPLIANCE:
The European Union General Data Protection Regulation (GDPR) went into effect on May 25, 2018 and is designed to allow individuals to more effectively control their personal data. At The Van Tharp Institute (IITM, INC) , client information is private and confidential; we do not share, trade, or sell to anyone. We never have. You may ask us at any time to unsubscribe. We keep your information safe. If you’d like access to your information just ask. You receive this information from us because you opted into the Van Tharp newsletter either through direct registration or registration through our Tharp Trader Test.
You may opt out below.
102A Commonwealth Court | Cary | NC | 27511
Cary, NC Workshop Information
For a list of nearby hotels for our Cary, North Carolina locations,
click here.
Book your flight arriving to the Raleigh-Durham International Airport (RDU).
When traveling to a three-day course, it's best to arrive the evening before.
To help determine your arrival and departure times, see:
Questions? Click Here to Ask Van...
CONTACT US
If you no longer wish to receive our email updates, click the unsubscribe link in the bottom-left corner of this email.
This is a supplement to our subscription based newsletter, Tharp's Thoughts.
800-385-4486 * 919-466-0043 * Fax 919-466-0408
|
|
|
|
|