|
Our Early Bird Discounts end soon on April workshops!
|
|
|
|
|
|
Tharp's Thoughts
Inbox Mentoring
|
|
|
|
|
|
|
|
-
Feature: March Market Update - Neutral Volatile Market Type, by Van K. Tharp, Ph.D.
-
Workshops: April Packed With Special Events: Oneness with Van Tharp, New Futures, and Adaptive, Advanced Swing Systems, offered only once each year.
-
Tips: March SQN Report,
by Van K. Tharp, Ph.D.
-
|
|
Learn New Approaches To Swing Trading and Benefit From Free Coaching After Your Workshop
|

|
|
Act now and save $700! Our Early Bird Discount ends soon!
Ken Long returns to the Van Tharp Institute this April with his popular Advanced Adaptive Swing Trading workshop. Students of this workshop rave about the enormous, and invaluable amount of information and personal support they receive from this instructor. If you're a swing trader, you won't want to miss this opportunity to learn the systems Ken teaches in this class.
Free Coaching
In our Adaptive Swing workshop your instructor will go that extra mile to make sure that you fully understand the content you will learn.
In addition to your workshop, Ken will host three coaching calls, approximately one per month and if you can’t make a session, you can watch the recording when it’s convenient for you. These sessions are more than just Q&A as traders also share what’s working great for them and collaborate on ideas to make the systems even more robust.
To learn more about this this workshop, scroll down to our workshop's section.
|
|
|
|
March Market Update - Neutral Volatile Market Type
by Van K. Tharp, Ph.D.
|
|
|
|
|
I always say that people do not trade the markets; they trade their beliefs about the markets. In that same way, I'd like to point out that these updates reflect my beliefs. I find the market update information useful for my trading, so I do the work each month and am happy to share that information with my readers. However, if your beliefs are not similar to mine, then this information may not be useful to you. If you are inclined to go through some sort of intellectual exercise to prove one of my beliefs wrong, simply remember that everyone can usually find lots of evidence to support their beliefs and refute others. Simply know that I admit that these are my beliefs and that your beliefs might be
different.
These monthly updates are in the first issue of Tharp's Thoughts each month which allows us to get the closing data from the previous month. These updates cover 1) the market type (first mentioned in the April 30, 2008 edition of Tharp's Thoughts), 2) the debt statistics for the US, 3) the five-week status on each of the major US stock market indices, 4) our four-star inflation-deflation model, and 5) tracking the US dollar. I also write a report on the strongest and weakest areas of the overall market as a separate SQN™ Report. Significant market changes may mean the SQN Report comes out more than once a month.
Part I: The Big Picture
The market was in Bull Quiet for many months until recently. Now it’s moving sideways and it's volatile. What was working a few months ago (buy and hold) will not work anymore. This Neutral Volatile market type could continue for a while or it could change to a different market type soon. Our market type classification system is descriptive of today’s conditions, not predictive of tomorrow's. It’s like a trend. You know the direction, but you don’t know whether it will continue.
|
|
|
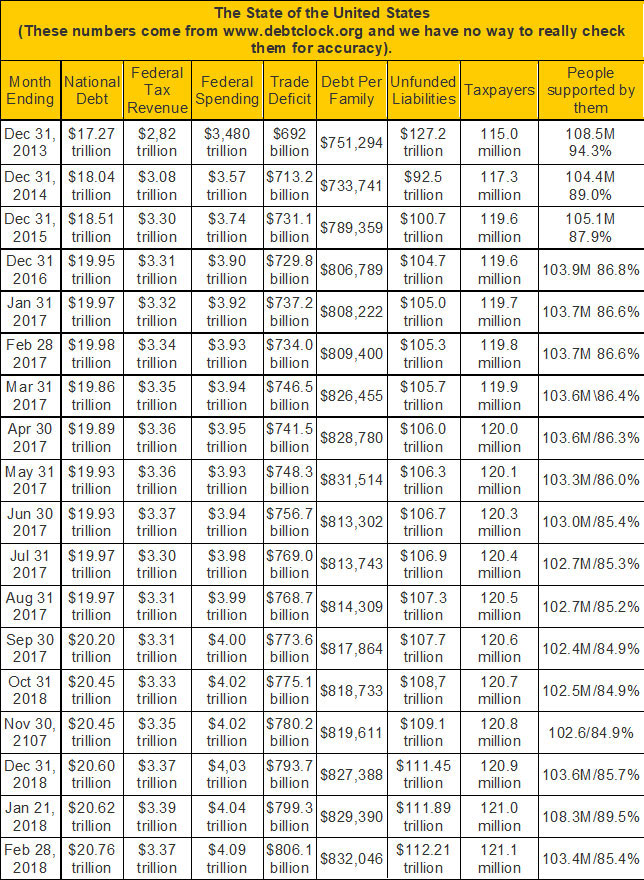
The US National Debt finally surpassed $21 trillion – I remember when I thought a trillion was awful. Federal spending is now listed at over $4 trillion for the last seven months.
Currently there are 121.2 million taxpayers supporting 103.25 million other people. Here I’m counting retirees, disabled, and food stamp recipients, however, the US debt clock site lists 165.9 million people receiving some sort of benefit. I had to start taking social security last year so I guess I’m one of them. Between the tax on my social security and the contributions I still make, however, I actually receive only 1/3 of my benefit while 2/3rds of it goes back to the government.
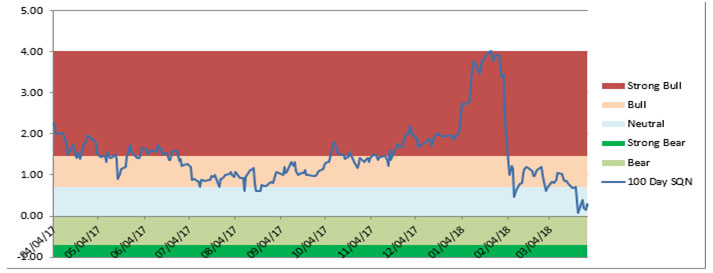
Part II: The Current Stock Market Type Is Neutral Volatile
The market was Bull Quiet or Strong Bull Quiet for most of 2017. At the end of 2017, the Market SQN scores for all four periods I monitor (200, 100, 50 and 25 days) were in Strong Bull. Two months ago the Market SQN score on the S&P 500 for 100 days was 3.43 – as high as I’ve seen it. Perhaps that was a sign that it was bound to come down. At the end of February, it came down to 0.78 – almost Neutral – and this month, it is 0.35 which is Neutral. Pay attention to what the market is doing, not to what you think it might do.
This month the Market SQN score for 200 days is still bullish but the 50 and 25 day scores are now in Bear. In my opinion, going from Strong Bull Quiet to Neutral Volatile (almost Bear Volatile) in two months is almost unheard of. That’s not supposed to happen but it did.
|
|
|
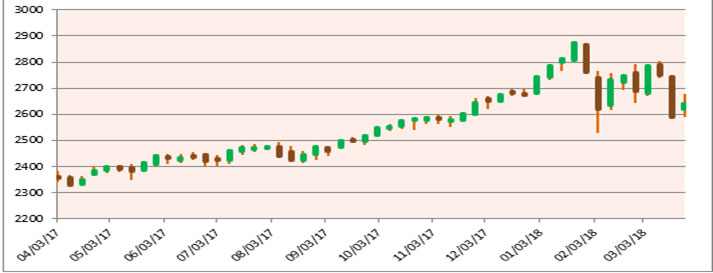
The first graph shows the S&P 500 weekly bars over the last year so it is easy to see bull market type last year. Look at the size of the bars now, however, compared with a few months ago. They are huge compared to what we had in 2017.
In January, the S&P 500 had 14 new all-time highs. In Feb there were none. The last all-time high is now 44 days ago.
|
|
Here is the market type graph. It changed from a very Strong Bull in just a few weeks to Neutral. Since mid February, it has jumped back and forth from Bull to Neutral and is now in low Neutral territory.
|
|
|
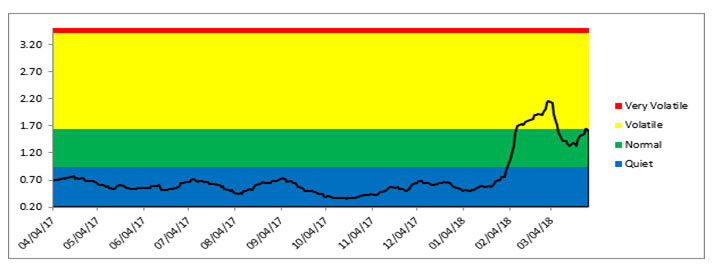
Two months ago I commented: “this volatility is so quiet that I had to change the axis to go below 0.5 in order to show the line (at 0.41). This is not the climate out of which bear markets arrive.” The graph above, however, shows the new volatility in the market zooming through the Normal range in February and reaching Volatile very quickly. It moved back to Normal but is now back up again in Volatile. If it stays there, then we could begin to worry about this market.
Right now the future direction for this market is anybody’s guess. It's highly likely that buy and hold stops (i.e., 25% trailing stops) have been hit. If you haven’t been stopped out, it’s now time to think if your trading strategies will work in a sideways market type or in a bear market.
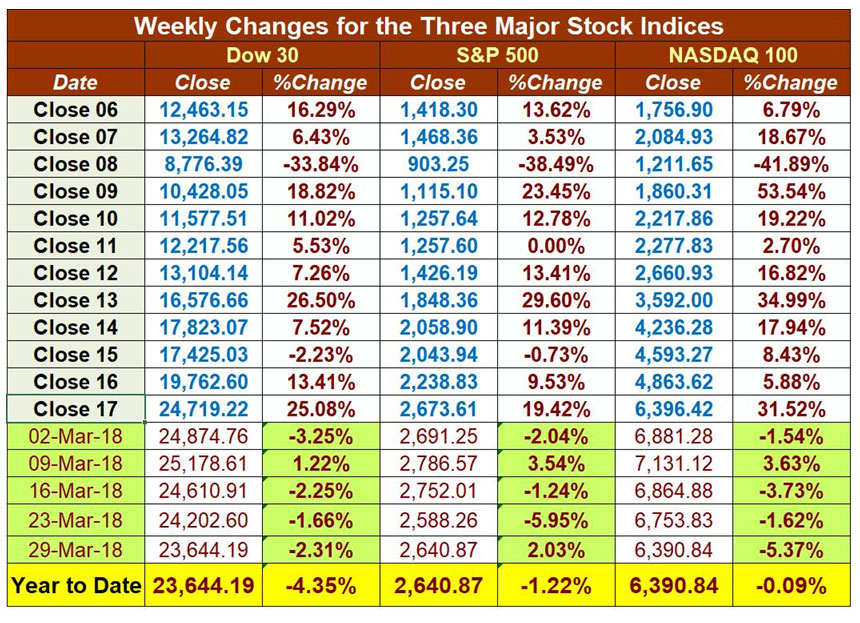
The table below shows the weekly changes in the three major stock indices over the last month.
|
|
|
After huge gains in 2017, the Dow 30 and the S&P 500 at the end of March are actually down for the new year.
Part III: Our Four-Star Inflation-Deflation Model
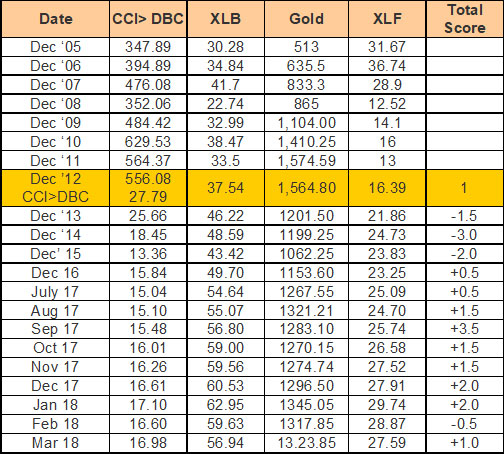
Commodities, basic materials, and gold are all up over the last six months which produced another inflationary model score for March. See the historical numbers for previous years and the monthly figures for the last year below.
|
|

|
|
Our model showed signs of inflation for the past 8 months with a sudden dip down into deflation in February but now it’s back into inflation. I took a look at the shadowstat.com data and noticed that based upon how the CPI was calculated in 1980, inflation still shows close to a 10% rate. According to shadowstats.com (which also calculates real inflation adjusted GDP data), we’ve been in a recession since 2000 – 17.5 years.
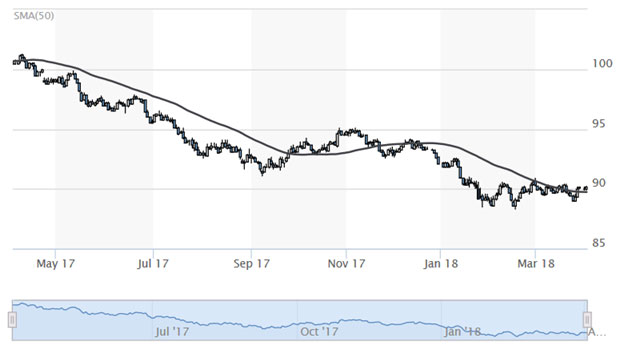
Part IV: Tracking the Dollar
The US Dollar more or less went down throughout all of 2017 but it has been pretty flat for most of 2018. It actually held its own against the Australian Dollar while I was in Australia last month so perhaps I need to give up on the Tharp Phenomenon. The USD hasn’t collapsed lately when I have been outside the US.
|
|
|
from www.marketwatch.com
Conclusion
We’ve gone from Strong Bull Quiet to Neutral Volatile in just two months. That’s quite a change and one we have seldom seen, if ever. But what does it mean?
There’s no more of a prediction in the current market type than there was in the Bull Quiet market type two months ago. You need to pay attention to what the market is doing right now.
Two months ago, a buy and hold strategy worked well (i.e., have a 25% trailing stop). But now the market type is clearly different and if you have not been stopped out, then you should make sure that your trading/investment strategies can tolerate a sideways (perhaps soon to be bear) market.
I monitor market type because it helps traders understand which kind of trading systems they should be using right now. You would not have done too well in March with bull quiet systems but trading systems that take advantage of volatility would have done fine.
Rather than trying to predict what the market will do next and how to be proactive with your positions ahead of the market, know the market type and trade the appropriate systems.
This approach makes a few assumptions –
- You have a market type classification system and you use it. My market type classification system works well for me but it may not fit you. If that’s the case, how would you go about describing and classifying market conditions? And you should really understand it and the implications of the meaning it is giving you.
- You understand trading systems. You know the parts, the purpose of each, and how they work together well. You understand the system’s edge and the beliefs behind it that enable the system to profit.
- You have a trading system development process and can develop one or more systems for each market type. Most people try to create a trading system that performs well all the time. If that’s what you have been trying to do, save your time and effort – focus on one particular set of market conditions per system.
- You trade one or more systems created for the current market type. (Some trading systems may perform best in one market type but will perform acceptably well in one or two other market types also.)
Look at the market type. What’s the market doing right now? It’s sideways and it’s volatile. The bull could resume but a quick transition to bear is equally possible now.
Until next month, this is Van Tharp.
|
|
|
|
|
|
About the Author: Trading coach, and author, Dr. Van K. Tharp is widely recognized for his best-selling books and his outstanding Peak Performance Home Study program - a highly regarded classic that is suitable for all levels of traders and investors. You can learn more about Van Tharp www.vantharp.com.
|
|
|
|
|
|
|
|
|
Learn From An Instructor Who Truly Cares
About Teaching You Everything He Knows
See video below.
|
|
In this 2 minute video, students discuss the benefits of taking Dr. Ken Long's upcoming Advanced Adaptive Swing Trading workshop this April.
|
|
|
|
March 2018 System Quality Number® Report
The SQN® Report
by Van K. Tharp, Ph.D.
|
|
|
|
|
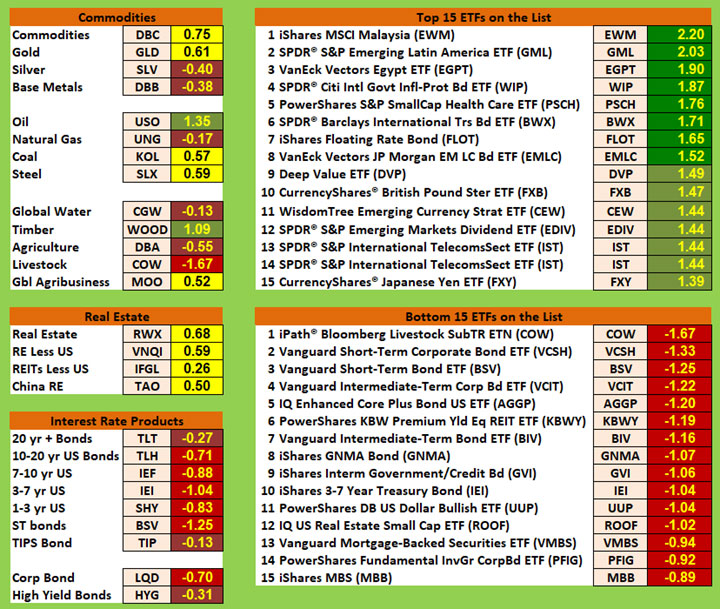
There are numerous ETFs that track everything from countries, commodities, currencies and stock market indices to individual market sectors. ETFs provide a wonderfully easy way to discover what’s happening in the world markets. I apply a version of my System Quality Number® (SQN®) score to measure the relative performance of numerous markets in a world model.
The Market SQN score uses the daily percent change for input over a 100-day period. Typically, a Market SQN score over 1.47 is strongly bullish and a score below -0.7 is very weak. The following color codes help communicate the strengths and weaknesses of the ETFs in this report:
- Dark Green: ETFs with very strong Market SQN scores > 1.47.
- Light Green: ETFs with strong Market SQN scores (0.70 to 1.47).
- Yellow: ETFs with slightly positive Market SQN scores (0 to 0.70). These are Neutral/Sideways.
- Brown: ETFs with slightly negative Market SQN scores (0 to -0.7).
- Red: Very weak ETFs that earn negative Market SQN scores (< -0.7).
This is basically the same rating scale that we use for the Market SQN Score in the Market Update. The world market model spreadsheet report below contains a cross section of currently available ETFs; excluding inverse funds and leveraged funds. In short, it covers equity markets around the globe, major asset classes, equity market segments, industrial sectors, and major currencies.
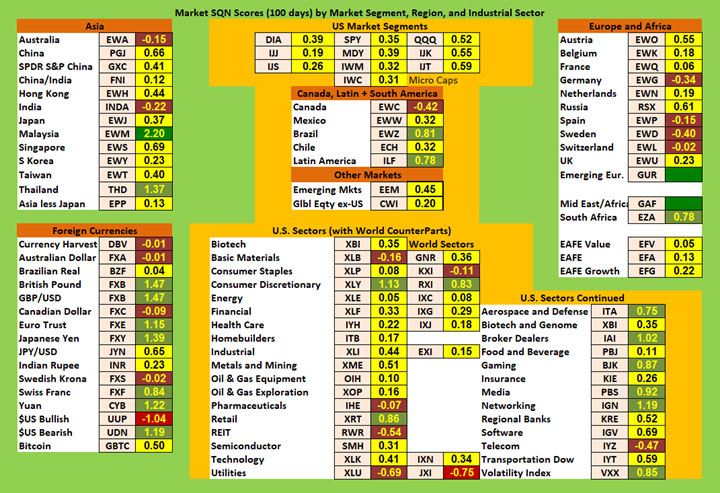
World Market Summary — Equities & Currencies
Each month we look at the equities markets across the globe by segment, region, and sector.
The US Dollar is still a weak currency and since the world model is totally valued in the US Dollar, everything should be increasing relative to it.
Overall, the US market segments looked amazing two months ago, not so good last month, and pretty neutral this month. At the end of January, the Dow had a Market SQN score of 4.5 and the S&P 500 was at 3.62 – both extremely high. But when they reach that high, it could mean oversold time. At the end of March, the DOW’s Market SQN score is now at 0.39 and the S&P 500 score is 0.35. Big changes and both are now yellow.
The other Americas markets are brown (Canada), yellow (Mexico and Chile) while Brazil, and Latin America are light green. Emerging markets are also yellow.
Asia is mostly yellow but weaker than last month. Malaysia is dark green (2.2) while Thailand is light green(1.37). India and Australia are brown and everything else is yellow.
Europe also became weaker in March. There are no green countries at all now and four are brown - Germany (-0.34), Spain (-0.15), Sweden (-0.40), and Switzerland (-0.02). All the rest are yellow.
|
|
|
On the currencies side we have a lot of green including the British Pound (1.47), the Euro (1.15), the Yen (1.39); the Swiss Franc (0.84), and the Chinese Yuan (1.22). That means USD is still weaker than all the other major currencies. Not a good climate in which to have a down stock market. Bitcoin is now neutral as well. It had a 69% drop followed by a 50% recovery and then another smaller drop. The weakest currencies in the model are the Aussie Dollar (where I was in March), the Canadian Dollar, and the Swedish Krona. They are all brown while the US Dollar is red.
Two months back, we had numerous US stock market sectors with Market SQN scores over 3.0. Not this month. No sectors in March were dark green but some were light green. The light green sectors include Consumer Discretionary (1.13), Retail (0.86), Aerospace (0.75), Broker Dealers (1.02), Gaming (0.87), Media (0.92), Networking (1.19) and Volatility (.85). There are now some brown sectors include Basic Materials (-0.16), Pharmaceuticals (-0.07), REITS (-0.54), Utilities (-0.69) and Telecom (-0.47). Everything is yellow.
Commodities, Real Estate, Debt, and the Top and Bottom Lists
Commodities are mixed again. Oil and Timber are light green but nothing else is strong. Five commodity sectors are yellow. Silver (-0.40), Base Metals (-0.38), Natural Gas (-0.17), Global Water (-0.13) and Agriculture (-0.55) are all brown. Livestock is red.
|
|

|
|
Interest rate based products still look terrible and there are no exceptions this month. Junk, 20 year + bonds, and TIPS are brown and all the rest are red.
Real estate across the board is neutral with the US being a little stronger than China.
Looking at the strongest ETFs list, we have only two that are above 2.0 which is the same as last month. Those are Malaysia and Emerging Latin America. And while last month the strongest 15 were all dark green, this month only 8 of the 15 are dark green. The rest are light green.
The weakest areas are all red. The worst is Livestock but most of the weak list ETFs are interest rate based funds.
Summary
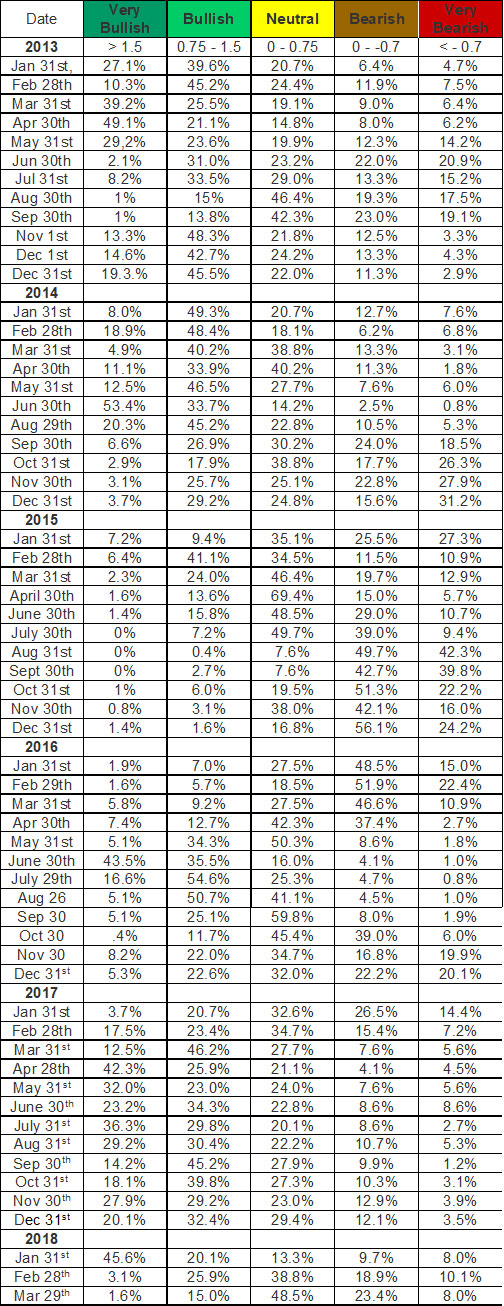
Let’s look at the summary table which measures the percentage of ETFs in each of the strength categories. You can see the distribution of the database by Market SQN score in bullish, neutral and bearish categories just below -
|
|
|
We’ve moved from 45.6% of our ETFs being strong bull two months ago to 1.6% this month. And we’ve moved from 13.3% of our ETFs being neutral two months ago to 48.5% this month. We’re in a correction and that could be temporary before we resume a bull market or before we move into a bear market.
Be careful to base your actions upon what IS happening, not what you think might happen. The markets always offer opportunities but to capture those opportunities, you MUST know what you are doing. If you want to trade these markets, you need to approach them as a trader, not a long-term investor. We’d like to help you learn how to trade professionally because trying to navigate the markets without an education is hazardous to your wealth.
All the beliefs given in this update are my own. Though I find them useful, you may not. You can only trade your own beliefs about the markets.
Until next month this is Van Tharp.
|
|
|
|
Spend A Transformational Weekend With Van Tharp
At Only $495 This is A Great Way To Learn Directly From Van
|
|
|
|
April 14-15
Saturday-Sunday
|
|
|
|
|
|
|
|
Participating in the Oneness Awakening Course is an extraordinary opportunity to benefit from some of the important journeys Dr. Tharp has taken to transform his life.
The course has become a fundamental tool in Dr. Tharp's mission to help his clients succeed. Don't miss a chance to learn more about how you can become more aware, positive, calm, centered, and successful. Plus, this is one of the few courses in which you can apply for Super Trader Program after completion.
Following this weekend training, traders can expect to naturally become more aware, positive, calm, and centered. By extension, they will also experience a shift in how they perceive the market. When a trader sees the market as it really is, rather than what they want to see, the act of trading becomes more relaxed and they become more confident and successful. Does this sound like the type of experience you want trading to be?
While this two-day course is not a technical course about trading, we have seen amazing results in the traders who experience the benefits of being more 'awake' and aware, calmer and more centered. Why? Because the person themselves are always the primary instrument, even before the technical skills of trading are engaged. Just like the athlete with impressive skills, traders can also utilize the phenomenon of tapping into their awareness to achieve premium results. Keen awareness, in turn, opens up new possibilities. Another great thing about the concepts and experiences in this course is that they have benefits that apply throughout students' lives, not just in their trading endeavors. Time and time
again, traders tell us that their trading improved after taking this course, but also their personal lives as well! Plus, at $495 this event is a bargain!
|
|
|
|
Presented by Gabriel Grammatidis
|
|
|
|
April 21-23
Saturday-Monday
|
|
|
|
|
|
|
|
Presented by Gabriel Grammatidis
|
|
|
|
April 24-25
Tuesday- Wednesday
|
|
|
|
|
|
|
|
This brand new workshop is filling up! Register before next week, April 11, to get your $700 Early Bird Discount.
Over the years, we have found that many traders (both novice and experienced alike) have talked themselves out of trading the futures markets. Most of the time, however, simple “fear of the unknown” will limit your ability to reach a higher level on your trading journey.
For instance, see if you agree with any statements like these about trading futures:
- “I’m really afraid of opening gaps.”
- “I would need a much larger trading account.”
- “All of the contract specifications seem so complicated. I wouldn’t know where to start or how to trade those.”
- “What if I had to take physical delivery? … Where would I put it?”
Unfortunately, fears like these prevent many traders from creating consistent profits and immense wealth by trading futures.
Every day, smart traders at every level use various futures contracts to achieve their goals in this global marketplace. Examples include the S&P 500 with the symbol ES, the Dow with YM, Gold with GC, Crude Oil with CL and Bitcoin with XBT.
Thanks to one of our most ambitious and accomplished Super Trader graduates, you can now have the opportunity to learn the EXACT way he trades these markets. He calls it, The Metrix Experience, blending the story from the movie The Matrix with Metrics and all of the needed numbers.
LIVE Futures Trading with Gabriel!
2-day follow-on workshop with Gabriel featuring LIVE trading of the futures markets in REAL-TIME!
Watch, listen, and learn as Gabriel shares with you the exact steps he takes to prepare for each trading day, to find opportunities, to evaluate the market action as it develops during the day, and to execute his systems.
Seating is extremely limited as this additional workshop will ONLY be open to those who have signed up to attend Gabriel’s Futures Trading workshop.
Take advantage today and attend this special, hands-on event for only $2,500 more, for a total investment of $5,795 with the early bird discount of $700.
You’ll learn in real-time the step-by-step processes Gabriel uses daily to trade his own account so that you can replicate the same processes in the futures markets and accelerate your trading confidence!
BONUS: Post-Workshop Instructor Support!
As a bonus for the attendees, Gabriel will conduct a 2-hour online group call approximately 6 weeks after the workshop to assess recent market conditions, see where everybody stands, answer questions, and offer support as needed.
In addition you will receive ongoing email support for another 3 months after the workshop to encourage you and assist those traders with additional questions about trading the futures markets.
|
|
|
|
April 27-29
Friday-Sunday
|
|
|
|
|
|
|
|
In this three-day workshop, Dr. Ken Long presents a series of advanced, adaptive trading systems that work well in the swing period holding timeframe — from two days to two weeks.
In addition to the robust seven patterns found in the RL Framework, Ken will also teach at least three other swing trading systems:
MaxPain Range Compression System
In any given two-week period, some stocks and ETFs will be down. If you compare all of the issues that are down, some of them are down more than others. These are the issues with “max pain”. Of that max pain group, some of them are very near their 10 day lows — they have not yet started to recover. These are the ones who have range compression. MPRC symbols have a higher probability of popping than other groups and Ken has effective and simple ways to take advantage of these situations.
Autoframer System
For this system, Ken starts with the assumption that every symbol has a reward to risk relationship with its 10 day high and 10 day low. The potential long reward is the distance from its current price to its 10 day high and the risk is the distance from its current price to its 10 day low. Ken will stalk very closely those symbols with the greatest reward to risk ratio within those parameters. That idea is so simple that you might not think this system would work well but if you thought that, you would miss out on nearly daily opportunities.
Daily Squeeze Play System
While prices do not move reliably in a cyclical pattern, volatility tends to move much more cyclically. Periods of low volatility are typically followed by periods of high volatility. With an effective way to find symbols that have had low volatility recently, Ken has developed an effective system that captures those volatile moves out of the narrow price ranges.
|
|
|
|
Presented by Van Tharp
with co-presenter RJ Hixson
|
|
|
|
|
|
|
|
|
Presented by Van Tharp
and RJ Hixson
|
|
|
|
May 22-24
Tuesday-Thursday
|
|
|
|
|
|
|
|
|
|
CryptoCurrency Trading
Only available to those enrolled in our Super Trader Program.
Presented by Van Tharp
|
|
|
|
June 19-21
Tuesday-Thursday
|
|
|
|
|
|
|
|
Options Trading
Presented by Chuck Whitman
|
|
|
|
June 23-25
Saturday-Monday
|
|
|
|
|
|
|
|
Options Trading Advanced
Presented by Chuck Whitman
|
|
|
|
June 27-28
Wednesday-Thursday
|
|
|
|
|
|
|
|
|
|
Presented by Van Tharp
with co-presenter RJ Hixson
|
|
|
|
|
|
|
|
|
|
|
July 17-19
Tuesday-Thursday
|
|
|
|
|
|
|
|
|
|
Presented by Gabriel Grammatidis
|
|
|
|
August 11-13
Friday-Sunday
|
|
|
|
|
|
|
|
Presented by Gabriel Grammatidis
|
|
|
|
August 14-15
Monday-Tuesday
|
|
|
|
|
|
|
|
Presented by Kim Andersson
Profit When Price Goes Nowhere: How to Successfully Trade Sideways Markets In Every Time Frame
|
|
|
|
August 17-19
Friday-Sunday
|
|
|
|
|
|
|
|
|
|
Presented by R. J. Hixson
|
|
|
|
September 14-16
Friday-Sunday
|
|
|
|
|
|
|
|
Presented by Libby Adams and RJ HIxson
|
|
|
|
September 18-21
Tuesday-Friday
|
|
|
|
|
|
|
|
|
|
Presented by Van Tharp
with co-presenter RJ Hixson
|
|
|
|
October 12-14
Friday-Sunday
|
|
|
|
|
|
|
|
|
|
October 16-18
Tuesday-Thursday
|
|
|
|
|
|
|
|
Presented by Gabriel Grammatidis
|
|
|
|
October 20-22
Saturday-Monday
|
|
|
|
|
|
|
|
Presented by Gabriel Grammatidis
|
|
|
|
October 23-24
Tuesday-Wednesday
|
|
|
|
|
|
|
|
Presented by Van Tharp
and RJ Hixson
|
|
|
|
October 26-28
Friday-Sunday
|
|
|
|
|
|
|
|
|
|
|
|
November 9-11
Friday-Sunday
|
|
|
|
|
|
|
|
|
|
November 12-13
Monday-Tuesday
|
|
|
|
|
|
|
|
Exciting New Work from Van Tharp
|
|
|
|
November
15-17
Thursday-Saturday
|
|
|
|
|
|
|
|
|
|
FREE Book!
We pay for the book, you just pay for shipping.
When you add the free book to an item already being shipped there is generally no extra shipping charge (of course, depending on your location).
Read Van’s Latest Book —
TRADING BEYOND THE MATRIX
The Red Pill for Traders and Investors
Eleven traders tell their stories about transforming
their trading results and lives, in this 400 plus page book.
Below is a brief video on how powerful this book is to traders.
|
|
|
|
Cary, NC Workshop Information
For a list of nearby hotels for our Cary, North Carolina locations,
click here.
Book your flight arriving to the Raleigh-Durham International Airport (RDU).
When traveling to a three-day course, it's best to arrive the evening before.
To help determine your arrival and departure times, see:
Questions? Click Here to Ask Van...
CONTACT US
If you no longer wish to receive our email updates, click the unsubscribe link in the bottom-left corner of this email.
This is a supplement to our subscription based newsletter, Tharp's Thoughts.
800-385-4486 * 919-466-0043 * Fax 919-466-0408
|
|
|
|
|