|
|
|
Tharp's Thoughts
Weekly Newsletter
|
|
|
|
|
|
|
|
-
Feature: Where Have All The Traders Gone? by Van K. Tharp, Ph.D.
-
-
Tips: An Impressive Streak Broken — Now What? by D.R. Barton, Jr.
-
Quiz: Intra Day Quiz, by Dr. Ken Long
-
Video: Reading Oil Trends Through a Forex System Lens
by Gabriel Grammatidis
-
|
|
|
|
$700 Early Enrollment Discount
Expires TODAY Next Week on April Workshops
|
|
|
|
Where Have All The Traders Gone?
by Van K. Tharp, Ph.D.
|
|
|
|
|
I first started this business of helping traders and investors in 1982. Those first years in business coincided with the start of the great bull market in stocks that lasted from 1982 through 1999. My first clients, however, were mostly futures and option traders; we had very few stock traders. Equity traders really didn’t make a significant portion of our customers until the mid-1990s.
Fast forward to the year 2000 when we were teaching a workshop on trading stocks. One of my Super Traders developed a version of CANSLIM with some modification that I helped him make and he taught that system in this workshop. In March 2000, we had 70 people attending that course — the largest attendance we’ve ever had at one of our workshops. And, of course, March 2000 was just about the top of the stock market. After that record breaking event, we probably offered the CANSLIM workshop 2-3 more times before it died a natural death because people stopped attending. (Stateside, we only give workshops now at our facility in Cary that holds around 30 people seated at tables so we will probably never break that March 2000 record.)
Now fast forward once more to about 2007. We noticed that our psychological workshops had 15-20 people attending on average but technical workshops were always packed. Ken Long would give his trading system workshops at least 3 times a year and the attendance was always at least 30 people. This went on for a number of years but by 2016, more people were attending our psychological workshops than the technical workshops.
Here are some other disappearances I have noticed. If you went into any Barnes & Noble bookstore in the late 1990s, you would find about 40 cases of investment books. And all of my books would be there, often multiple copies. Today, if you go into a Barnes & Noble bookstore you will find perhaps 2 cases of investment books — mostly Robert Kiyosaki, Jim Cramer and the usual crowd. And you will probably not find any useful investment/trading books. While eBook sales are probably now bigger than the sales of hard bound books, those certainly have not come close to accounting for the lack of physical book sales.
In February of last year, The Van Tharp Institute hosted a booth at the Traders Expo in New York City. The event planners claimed the attendance was about 4,000 people. The attendance at that expo used to be about 15,000 people. There was only one weekend evening for the event and huge lines formed at our Trading Beyond the Matrix book giveaway. On the other days, the lines were not nearly as long so I suspect 4,000 was the attendance over the entire event.
What can we conclude? People are afraid of the markets. The GFC of 2008 was probably the last straw for many investors and traders. Most people in the markets at that time didn’t practice risk management through effective position sizing strategies. They didn’t know how to make money in volatile down markets (something which is fairly easy and that we teach), and got wiped out (actually, they wiped themselves out).
Fast forward to today — let’s look at the stock market right now. On March 1st, I prepared my monthly update on the market. My 25-day Market SQN® score, my 50-day Market SQN score, my 100-day Market SQN score, and my 200-day Market SQN score were all Strong Bull and the volatility was Quiet. I’ve been doing the market type report for over 10 years now and that’s the strongest showing I’ve ever seen. And the strongest ETF of the 500 plus that we watch in our world market model report was the one representing the DOW 30 (DIA) with a Market SQN 100 score of over 3.0. I’ve never seen that before.
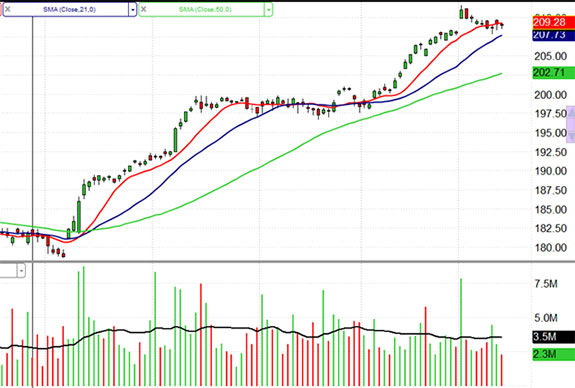
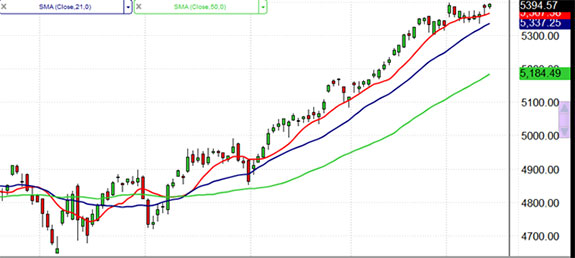
Look at the chart below of the S&P 500 (using the ETF SPY). It’s been easy money since Donald Trump took office. The red line is the 10 day moving average. And it’s been above that red line for about 75% of the time since November 2016. In the 75 days since November 21st there have been 20 all-time new highs in the S&P 500. Twenty of them — that’s more than 25% of the time.
|
|
|
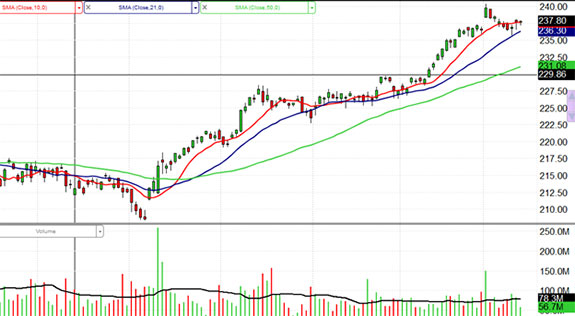
So, look at the chart of the DIA (Dow 30) below since last November. It’s pretty similar. And remember the Market SQN 100 for that ETF is currently over 3.0 which is very, very strong.
|
|
Okay, and just in case you are not convinced, here is a chart of the NDX over the same time period. It’s up over 10% in just two months.
|
|
|
While a strong trend doesn’t necessarily mean the trend will continue and a Strong Bull Quiet market also doesn’t necessarily mean it will continue, I think the lack of interest by investors could easily mean that this market could be strong for a long, long time. How long? Well, I think one indicator could be when everyone wants to come to our workshops and learn how to make money in this market. But of course, by that time, it will be too late.
So what are you doing right now? This is the kind of market that everyone wants — when making money is easy. Are you up 5% on the year like the S&P 500 or the DOW 30? Are you up 10% like the NDX? Or are you sitting on the sideline too afraid of disasters that might happen in the future so you don’t see what is going on right in front of you.
I’d value your input. What’s happening with you and the market right now? Let me know at van <at> vantharp.com
Thanks
|
|
|
|
|
|
About the Author: Trading coach, and author, Dr. Van K. Tharp is widely recognized for his best-selling books and his outstanding Peak Performance Home Study program - a highly regarded classic that is suitable for all levels of traders and investors. You can learn more about Van Tharp www.vantharp.com.
|
|
|
|
|
|
|
|
|
Peak Performance 101
March 31-April 2, 2017
|
|
Is This the Workshop for You?
Peak Performance 101 not only helps you install Dr. Tharp’s model, it also helps you overcome self-sabotage. You’ll be able to free yourself from internal conflicts that keep you from performing at a peak level. For example:
1. Are you always looking for a new trading system? Or, are you always trying to improve the one you have?
2. Do you find your trade setups never quite fit all of the personal criteria you need, so you have trouble entering trades?
3. Do you get anxious about the market or about risking your money, so that you have trouble pulling the trigger?
4. Do you get excited about the market, or do you get distracted and fail to follow your system's rules?
5. Does a losing trade take your energy away for the next trade, or conversely, does a winning trade make you confident about the next trade?
6. Is your trading (or your life?) ruled by the "negative" emotions of fear, anger, or greed?
7. Are you constantly losing money because you don’t have a strong plan to guide your trading, or because you simply don't follow the plan you created?
8. Do you have a performance ceiling where you fall apart or stop doing well? Do you earn $100,000 and then just seem to stop trading? Or, do you reach the million-dollar plateau and then start losing heavily?
Overcome Self-Sabotage
Those are common patterns and if you answered "yes" to any of them, then likely you are experiencing some form of self-sabotage. This workshop would help you identify and resolve the conflicts causing these behaviors – as well as leave you with the tools to address conflicts that come up in the future for you.
If you’re really committed to trading success and willing to do whatever it takes, you’ll find that you've become a different person after this ground-breaking workshop.
Seven money-making benefits are waiting for you. They’ll help you keep your losses smaller, make more consistent profits and be more relaxed about your trading.
1. The three ingredients of success.
After the Peak Performance Trading Course, you’ll thoroughly understand how these three key ingredients can control your life. Most of all, you’ll know how you can control them.
2. The components of a low-risk idea.
You must understand what makes up a low-risk idea. It’s not what you think.
3. Why position sizing™ strategies are so critical to your bottom line results!
Few people understand this critical concept, yet it means the difference between consistent top performance and mediocre performance for most people.
4. 15 ways to develop rock-solid discipline in your trading.
Discipline means controlling your mental state. Most people allow their mental state to control them. In contrast, real winners maintain discipline that allows them to charge ahead of others in the field.
5. Dr. Tharp’s Top Tasks of Trading for successful trading and investing.
The workshop will help you install his model so you can trade like other successful traders. You’ll have tools at your disposal that the average investor or trader never even thought about.
6. How to act quickly with sureness and confidence.
One trait all the best traders and investors have in common is extreme confidence in what they’re doing. Confidence is the one quality you must develop to attain your peak level of performance. At the Peak Performance 101 Workshop, you’ll learn how to develop the kind of confidence only the best traders and investors have.
7. How to develop a plan for trading that will set you way above the crowd.
There are certain disciplines—certain techniques used within a specific structure—that give the professional trader and investor the edge over amateur investors. Dr. Tharp understands these disciplines. He is an expert at coaching others to use them.
Participants in this course will get to meet and network with some really great people who a lot in common with each other. Once you attend Peak Performance 101 you have met the prerequisite to attend other workshops in the Peak series (202, 203, & 204). Plus if you have interest in applying for the Super Trader Program this is a qualifying workshop to submit an application.
A Recent Email From A Student:
"The Peak Performance Workshop is the single greatest transformational and supportive trading activity I've have ever been apart of. The course helps the trader gain an insight about him/herself that is unavailable otherwise. When first taking the course I was looking for a single objective or takeaway that would advance my trading.
After attending the workshop I now see that just as with trading no single aspect contributes greatest to success. Combining all the techniques taught will allow for major transformations just as dieting and exercising will allow someone to get into better shape over time. I highly recommend the course to anyone preferably before you begin trading to save yourself some hard felt emotions."—Sincerely, Davon Albury
|
|
|
|
The $700 Early Enrollment Discount Expires TODAY Next Week on:
Peak 101, March 31- April 2
Peak Performance 203, April 4-6, and
The New Infinite Wealth Workshop, April 8-10
|
|
|
|
Presented by Van Tharp
with co-presenter RJ Hixson
|
|
|
|
March 31-April 2
Friday-Sunday
|
|
|
|
|
|
|
|
|
|
Presented by RJ Hixson
and Kirk Cooper
|
|
|
|
April 4-6
Tuesday-Thursday
|
|
|
|
|
|
|
|
|
|
|
|
April 8-10
Saturday-Monday
|
|
|
|
|
|
|
|
|
|
Attend two events and get an additional $500 off. Attend all three and save $800 more.
|
|
|
|
Presented by Ken Long
(Details on our workshop page. More info coming soon on this new offering)
|
|
|
|
|
|
|
|
|
|
|
Presented by Van Tharp
with co-presenter RJ Hixson
|
|
|
|
|
|
|
|
|
|
|
Presented by Libby Adams and RJ HIxson
|
|
|
|
|
|
|
|
|
|
|
|
|
June 10-12
Saturday-Monday
|
|
|
|
|
|
|
|
|
|
Presented by Van Tharp
and Rebecca Price
|
|
|
|
|
|
|
|
|
|
|
|
|
August 5-7
Saturday-Monday
|
|
|
|
|
|
|
|
|
|
|
|
August 8-9
Tuesday-Wednesday
|
|
|
|
|
|
|
|
|
|
NEW! Trading in a Sideways Market
Presented by Super Trader graduate Kim Andersson
(more information about this workshop will be added soon)
|
|
|
|
August 11-13
Friday-Sunday
|
|
|
|
|
|
|
|
|
|
An Impressive Streak is Broken – Now What?
by D.R. Barton, Jr.
|
|
|
|
|
Think back about four months to mid-October. On October 11, 2016, the S&P 500 fell 1.2%. This one day drop broke the market out of a sideways range and eventually led to a modest selloff that lasted into Election Day.
Here’s what that chart looks like with some additional commentary:
|

|
|
Most importantly for us, notice the blue text box in the middle of the long uptrend. Since October 11th of last year, the market has traded an amazing 109 trading days without a 1% close-to-close drop. That hasn’t happened since 1995. In fact, more than 100 up days with no 1% down day has happened only seven times in the last 63 years!
Here’s some interesting symmetry — the October 11th 2016 and March 21st 2017 drops were both 1.2%. The question for traders now is, “What can we expect to follow?” Long-time readers will be unsurprised to hear my next statement — Don’t worry! I have data.
Some Interesting Numbers…
A week or so ago, the folks over at LPL financial put together a table of all the “100 days without a 1% drop” strings since 1950. Here’s that table:
|

|
|
I can hear the shouts from the statistics professors out there already and no, they would not consider this sample to be statistically significant. This is such a unique market situation that here have only been 13 cases of a 100+ day trading swing with no 1% down days in the last 2/3 of a century. And almost half of those occurred in the 1961-1968 period. As traders, however, we want to get a feel for what happens after long streaks and this data can give us some insight.
What do I take away from this data? Two main things:
- After the first 1% down day that breaks the streak (yesterday — 3/21/17), the following week tends to be pretty lousy. 11 of 13 follow-on weeks were down (or flat). The only other two weeks were only up mildly.
- Further out — the data look quite bullish with up markets 67% to 75% of the time.
This data is very consistent with my intermediate-term momentum begets intermediate-term momentum thesis that I discussed two weeks back. In that article, I talked about seasonal data also pointing to March as a strong up month.
So What?
I expect we’ll get some additional selling over the next week as the data from LPL’s research above suggests. After that, the data suggests more follow through then to the upside — for which we have other seasonal and momentum factors confirming as well. And unless something else in the external economic environment changes, I believe this pullback will be yet another buying opportunity for the intermediate and longer term trend.
Your thoughts and comments are always welcome — please send them to drbarton “at” vantharp.com
Great Trading,
D. R.
|
|
|
|
|
|
About the Author: A passion for the systematic approach to the markets and lifelong love of teaching and learning have propelled D.R. Barton, Jr. to the top of the investment and trading arena. He is a regularly featured analyst on Fox Business' Varney & Co. TV show (catch him most Thursdays between 12:30 and 12:45), on Bloomberg Radio Taking Stock and MarketWatch's Money Life Show. He is also a frequent guest analyst on CNBC's Closing Bell, WTOP News Radio in Washington, D.C., and has been a guest on China Central Television - America and Canada's Business News Network. His articles have appeared on SmartMoney.com MarketWatch.com and Financial Advisor magazine. You may contact D.R. at "drbarton" at
"vantharp.com".
|
|
|
|
|
|
|
|
|
Intra Day Quiz Series
by Dr. Ken Long
|
|
|
|
|
In this lesson from the morning trade in our chatroom, our trader Sonal offers her work this morning for review. The green and red dots show her entries and exits. The yellow dots and blue numbers show points of interest. The marked up chart contains an example of our approach to coaching by looking and commenting on the "game film" of her closed trade case study.
The lesson has 5 parts:
- A review of the importance of understanding and applying the concept of resistance.
- A technique we use in our RLCO/BB framework of marking resistance at areas where the "Dragon" indicator turns over.
- A discussion of how to use resistance in framing trades.
- Commentary about not being "surprised" by the expected behavior of price once it breaks thru resistance.
- A quiz to examine 3 different ways to play the exit, given the magnitude of the move.
As always, our grateful thanks to Sonal and the other chatroom traders who courageously and selflessly offer their work for us to review in the hopes of getting better, collaboratively. In my opinion, offering your work to others for comment is evidence of the emotional strength and resilience it takes to survive in the emotionally challenging world of trading, as well as being the fastest way to gain mastery that I know of.
Click the image below to view full size.
To watch the video discussion for this quiz CLICK HERE.
|

|
|
|
|
|
|
About the Author: Dr. Ken Long retired from the Army as a Lieutenant Colonel and teaches at the U.S. Army Staff College. He is a proud father of three, a husband, teacher, student, martial artist and active trader. Ken also instructs dynamic trading workshops for the Van Tharp Institute.
Ken's next workshop is just around the corner. Watch this video to hear two testimonials from students of Ken Long.
|
|
|
|
|
|
|
|
|
Reading Oil Trends Through a Forex System Lens
by Gabriel Grammatidis
|
|
|
|
|
Part 1 (from last week)
Our Forex instructor Gabriel Grammatidis recorded a short video about oil. Through the lens of one of his trading systems, he clearly sees what oil is doing and where it’s going — but even he admits that it’s hard to imagine. Still, he understands what the charts are saying.
|
|
|
|
Part 2 (update)
In this week’s update, Gabriel looks at other time frame charts for oil and provides some timing guidance for a possible trade. Gabriel’s chart patterns are based on psychology and his systems tend to find good trades in Forex, large indexes, and highly liquid commodities. See what his system says about oil right now.
|
|
|
|
|
|
About the Author: Gabriel Grammatidis is a successful full-time trader and graduate of the Super Trader program. He has extensive experience trading Forex and shares his knowledge at his Forex and Live Forex Trading workshops, held regularly at VTI.
For more information on the Busted Breakout psychological dynamics see his article in the Traders' magazine. Gabriel can be reached at gabriel "at" vantharp.com. We expect the next Forex Trading Systems workshop to be held in November 2017, though this is tentative until further notice.
|
|
|
|
|
|
|
|
|
FREE Book!
We pay for the book, you just pay for shipping.
Read Van’s Latest Book —
TRADING BEYOND THE MATRIX
The Red Pill for Traders and Investors
Eleven traders tell their stories about transforming
their trading results and lives, in this 400 plus page book.
Below is a brief video on how powerful this book is to traders.
|
|
|
|
This home study course is Dr. Tharp’s masterpiece.
Dr. Tharp carefully crafted the information from his studies into a model that people like you can use to improve your skills and increase profits. It's designed for all levels of investors and traders—beginners, advanced, unsuccessful traders seeking to better their performance and successful traders who want to be continue to improve. The course contains 5 workbooks and 4 CDs.
Think of the enriched trading experince, the savings of costly mental mistakes, the propects of more winning trades, and the cost $795 is a true value. BUY PEAK PERFORMANCE HOME STUDY NOW
|
|
|
|
|
This course is most appropriate for success-driven men and women who really want to excel in the market and who are willing to devote the time and energy that it takes to master the key principles. It’s also for brokers and institutional investors and traders who want to improve their company profits.
We expect you to be logical, ethical, practical, open-minded and willing to tenaciously persevere. You must also be willing to invest the effort to better yourself and your trading business. You must be willing to really work to change yourself and your approach to the markets. If that description fits you, then the course will help you immensely. And, we stand behind the results. If you are not happy with the course after one year, return it, along with your completed exercises, for a full refund. Want one month to review the material to see if it is right for you? Do that and return it if you don't like what you see.
The course is for those of you who have considered casting off the handcuffs that tie you down to consistent tax write-offs every year for investment losses. Deep down you know there is a better way for you to direct your energy that will make you consistent profits. LEARN MORE ABOUT PEAK PERFORMANCE HOME STUDY
- "The Peak Performance Home Study Course is the most comprehensive guide ever written about achieving peak performance trading and a peak performance life! It is one of the most challenging things I have ever done, but also one of the most rewarding. The comprehensive planning and discipline acquired through the course has improved my life on a physical, mental, and spiritual level. The improvement in my trading by reducing mistakes and maintaining the discipline to follow my trading rules has been invaluable. I have learned so much about myself and look forward to continuing to apply what I have learned to my trading and continuing to review the course at least once a year. No matter how new or experienced you are, if you commit
to doing the work in this course, you will be amazed by the results in many areas of your life, not just your trading."—Ashay B., Bolder, Colarodo
|
|
|
|
|
|
|
|
|
Cary, NC Workshop Information
For a list of nearby hotels for our Cary, North Carolina locations,
click here.
Book your flight arriving to the Raleigh-Durham International Airport (RDU).
When traveling to a three-day course, it's best to arrive the evening before.
To help determine your arrival and departure times, see:
Questions? Click Here to Ask Van...
CONTACT US
If you no longer wish to receive our email updates, click the unsubscribe link in the bottom-left corner of this email.
This is a supplement to our subscription based newsletter, Tharp's Thoughts.
800-385-4486 * 919-466-0043 * Fax 919-466-0408
|
|
|
|
|