|
|
|
Tharp's Thoughts
Weekly Newsletter
|
|
|
|
|
|
|
|
-
Feature: March Market Update:
Strong Bull Quiet Market Type, By Van K. Tharp, Ph.D
-
Workshops: The New Infinite Wealth Workshp, Plus Peak 203 Coming in April
-
Tips: March System Quality Number™ Report, By Van K. Tharp, Ph.D
-
|
|
|
|
March Market Update:
Strong Bull Quiet Market Type
by Van K. Tharp, Ph.D
|
|
|
|
|
I always say that people do not trade the markets; they trade their beliefs about the markets. In that same way, I'd like to point out that these updates reflect my beliefs. I find the market update information useful for my trading, so I do the work each month and am happy to share that information with my readers. If your beliefs are not similar to mine, however, then this information may not be useful to you. Thus, if you are inclined to go through some sort of intellectual exercise to prove one of my beliefs wrong, simply remember that everyone can usually find lots of evidence to support their beliefs and refute others. Simply know that I admit that these are my beliefs and that your beliefs might be different.
These monthly updates are in the first issue of Tharp's Thoughts each month which allows us to get the closing data from the previous month. These updates cover 1) the market type (first mentioned in the April 30, 2008 edition of Tharp's Thoughts), 2) the debt statistics for the US, 3) the five-week status on each of the major US stock market indices, 4) our four-star inflation-deflation model, and 5) tracking the US dollar. I also write a report on the strongest and weakest areas of the overall market as a separate SQN™ Report. Significant market charges may mean the SQN Report comes out more than once a month.
Part I: The Big Picture
So what are the markets telling us now?
The markets have been quite strong since the election of Trump as president. The Market SQN® scores are bullish for all four timeframes that we monitor – 200 days, 100 days, 50 days, and 25 days. In the last 67 days, we have had 20 new all-time highs in the S&P500. I don’t recall a time since I have been writing these market updates that I have seen a market this strong.
|
|
|
|
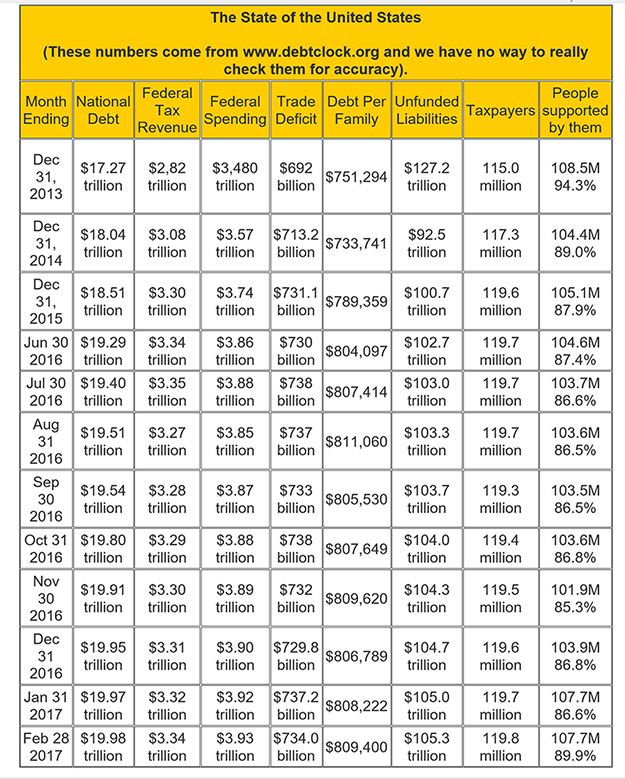
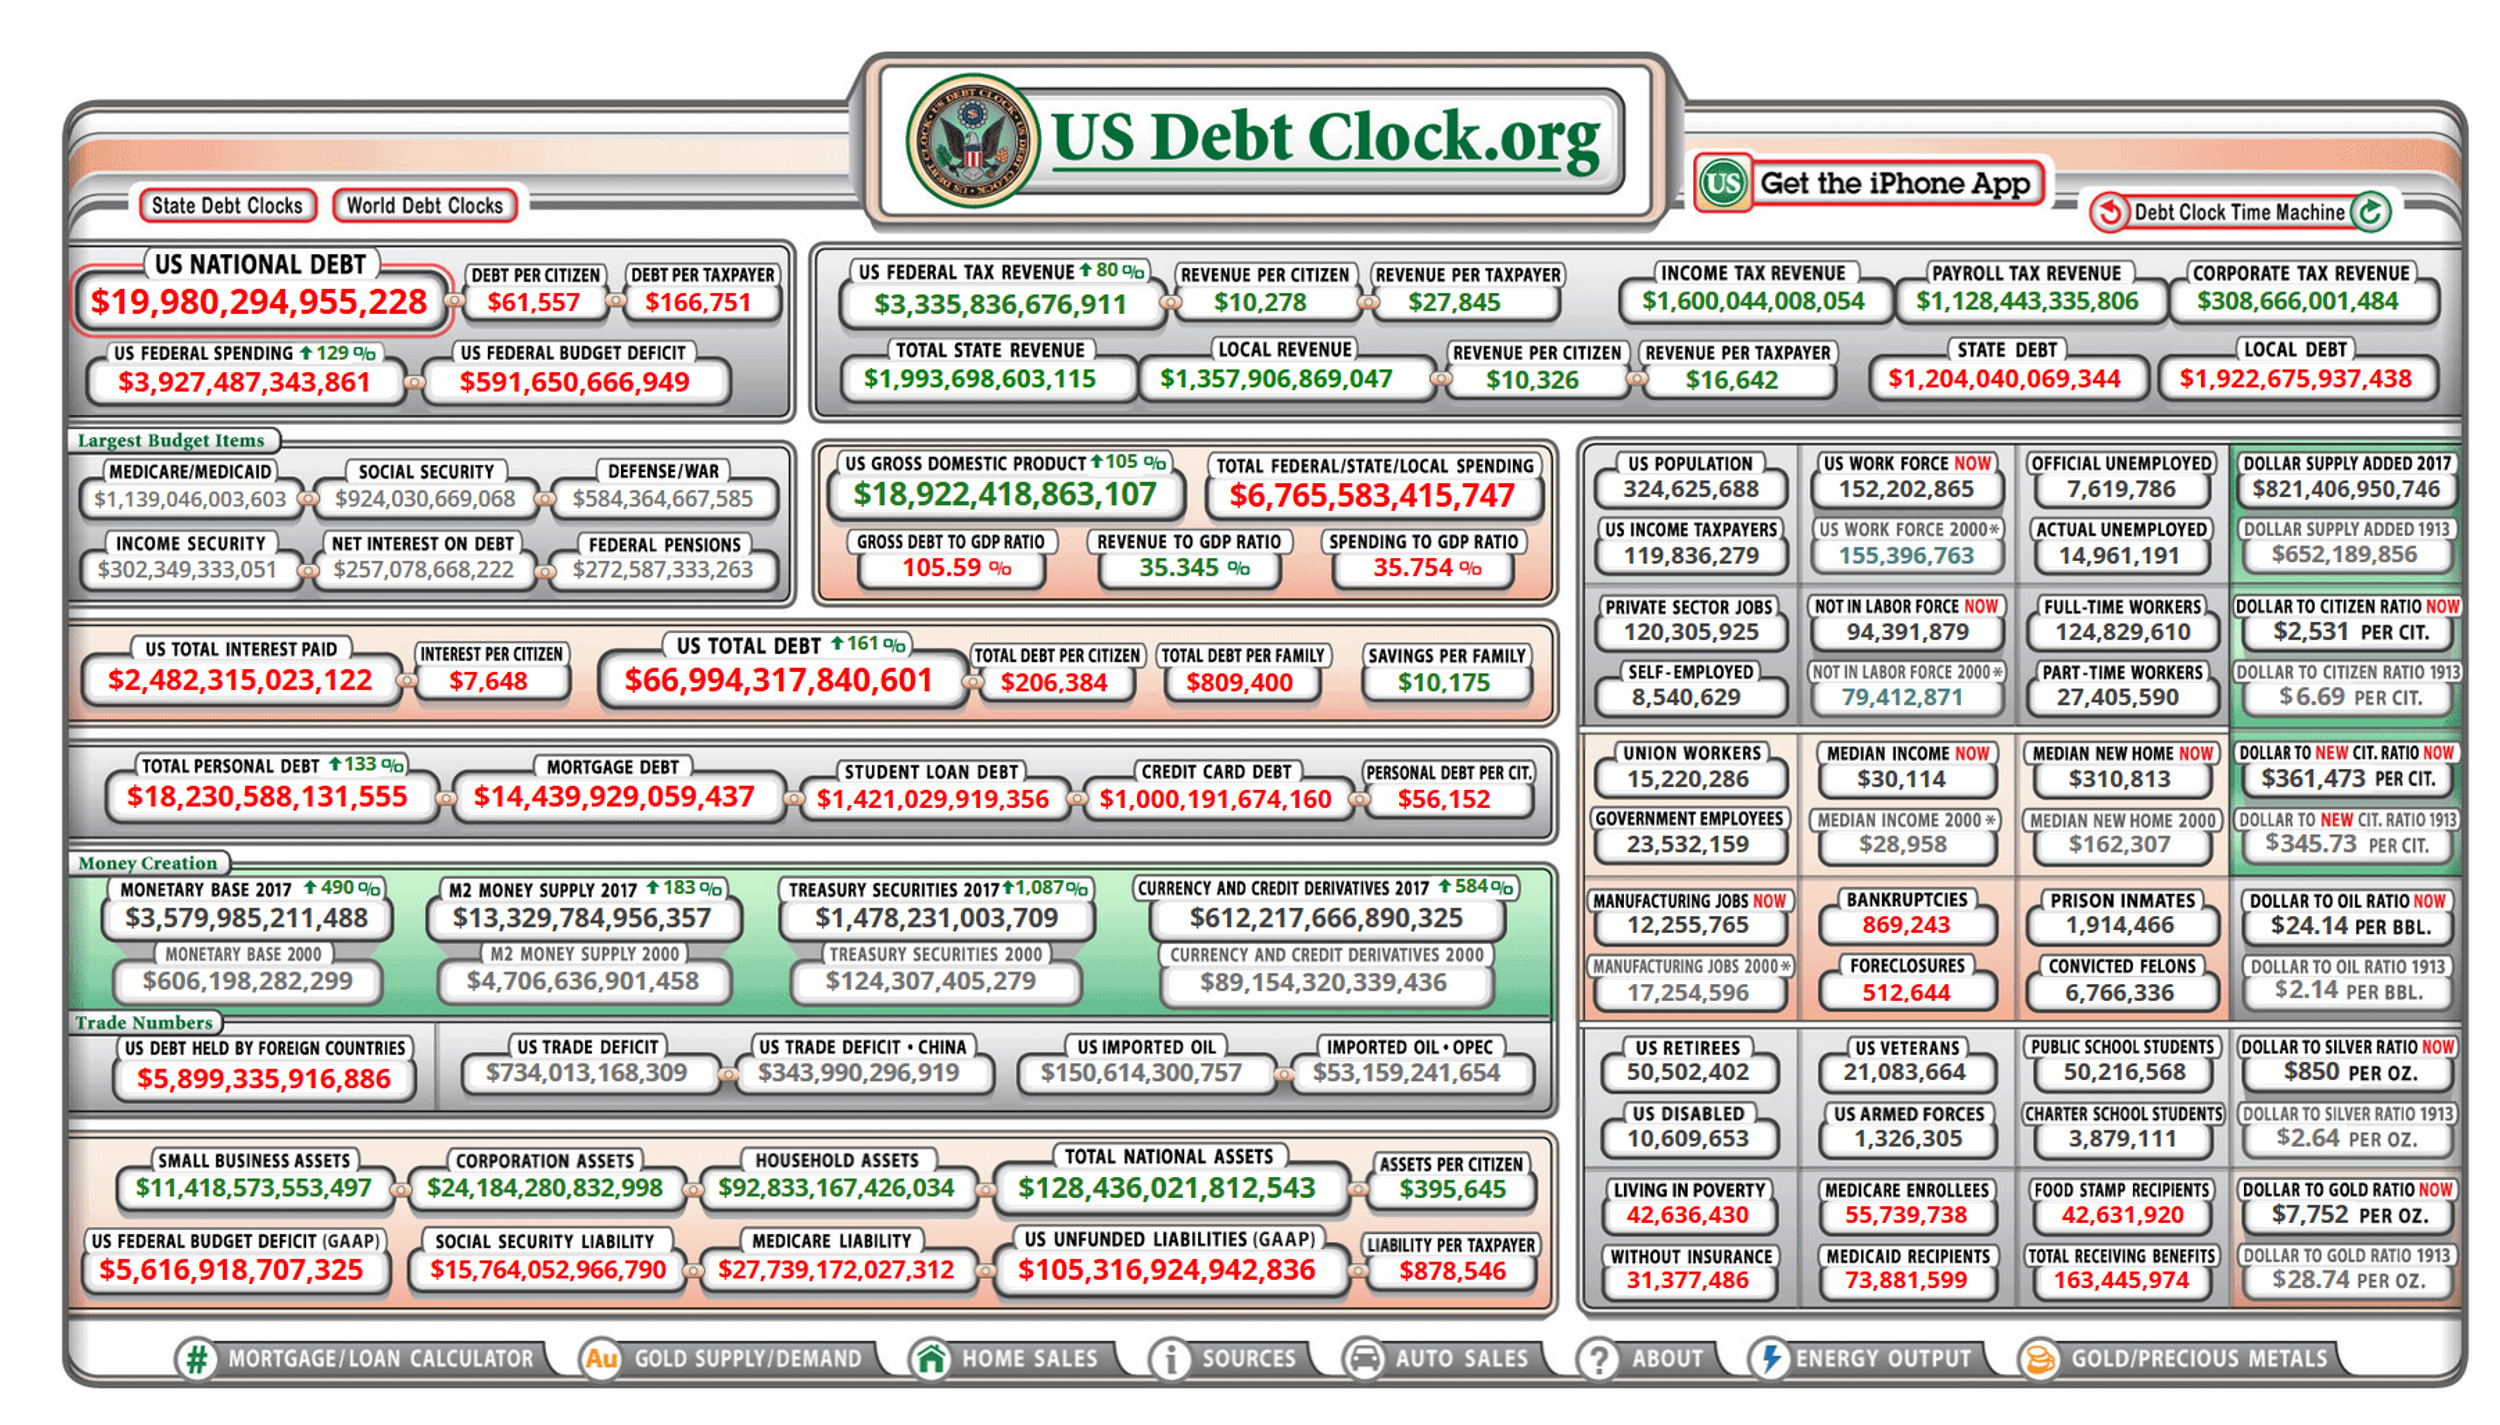
In late April 2016, usdebtclock.org said our official debt went over the $19 trillion mark and now we are almost at $20 trillion so our politicians continue doing their usual “wonderful” job of spending our money plus money they don’t have. Don’t expect Donald Trump to be any better.
Incidentally, the website says there are 119.8 million U.S. taxpayers. I add together US Retirees (50.5 million) food stamp recipients (42.6 million) and disabled people drawing social security (10.6 million). I don’t think there is any overlap here. Those groups total 103.7 million and that’s why I say that they constitute a group that’s 89.9% of the number of taxpayers. I could also include all government employees (23.5 million) as among those supported by taxpayers - but they do pay taxes. Remember about 10% of the taxpayers (11.98 million) pay most of the tax revenue. By the way, the debt clock lists Medicaid, Medicare, and several other sources of benefits that I don’t include because I assume they are overlaps and thus lists 164.4 million people as receiving benefits.
That’s over half the population. I’m now one of them, as I had to start taking Social Security after I turned 70. I guess I shouldn’t complain, as I never thought I’d collect any of it. However, the US government collects about 30% of what I receive each year from me. And I pay taxes at a high rate which amounts to another 30% of it.
|
|
|
|
|
Part II: The Current Stock Market Type Is Strong Bull Quiet
The market type classification tells us what is happening today – not what is going to happen tomorrow.
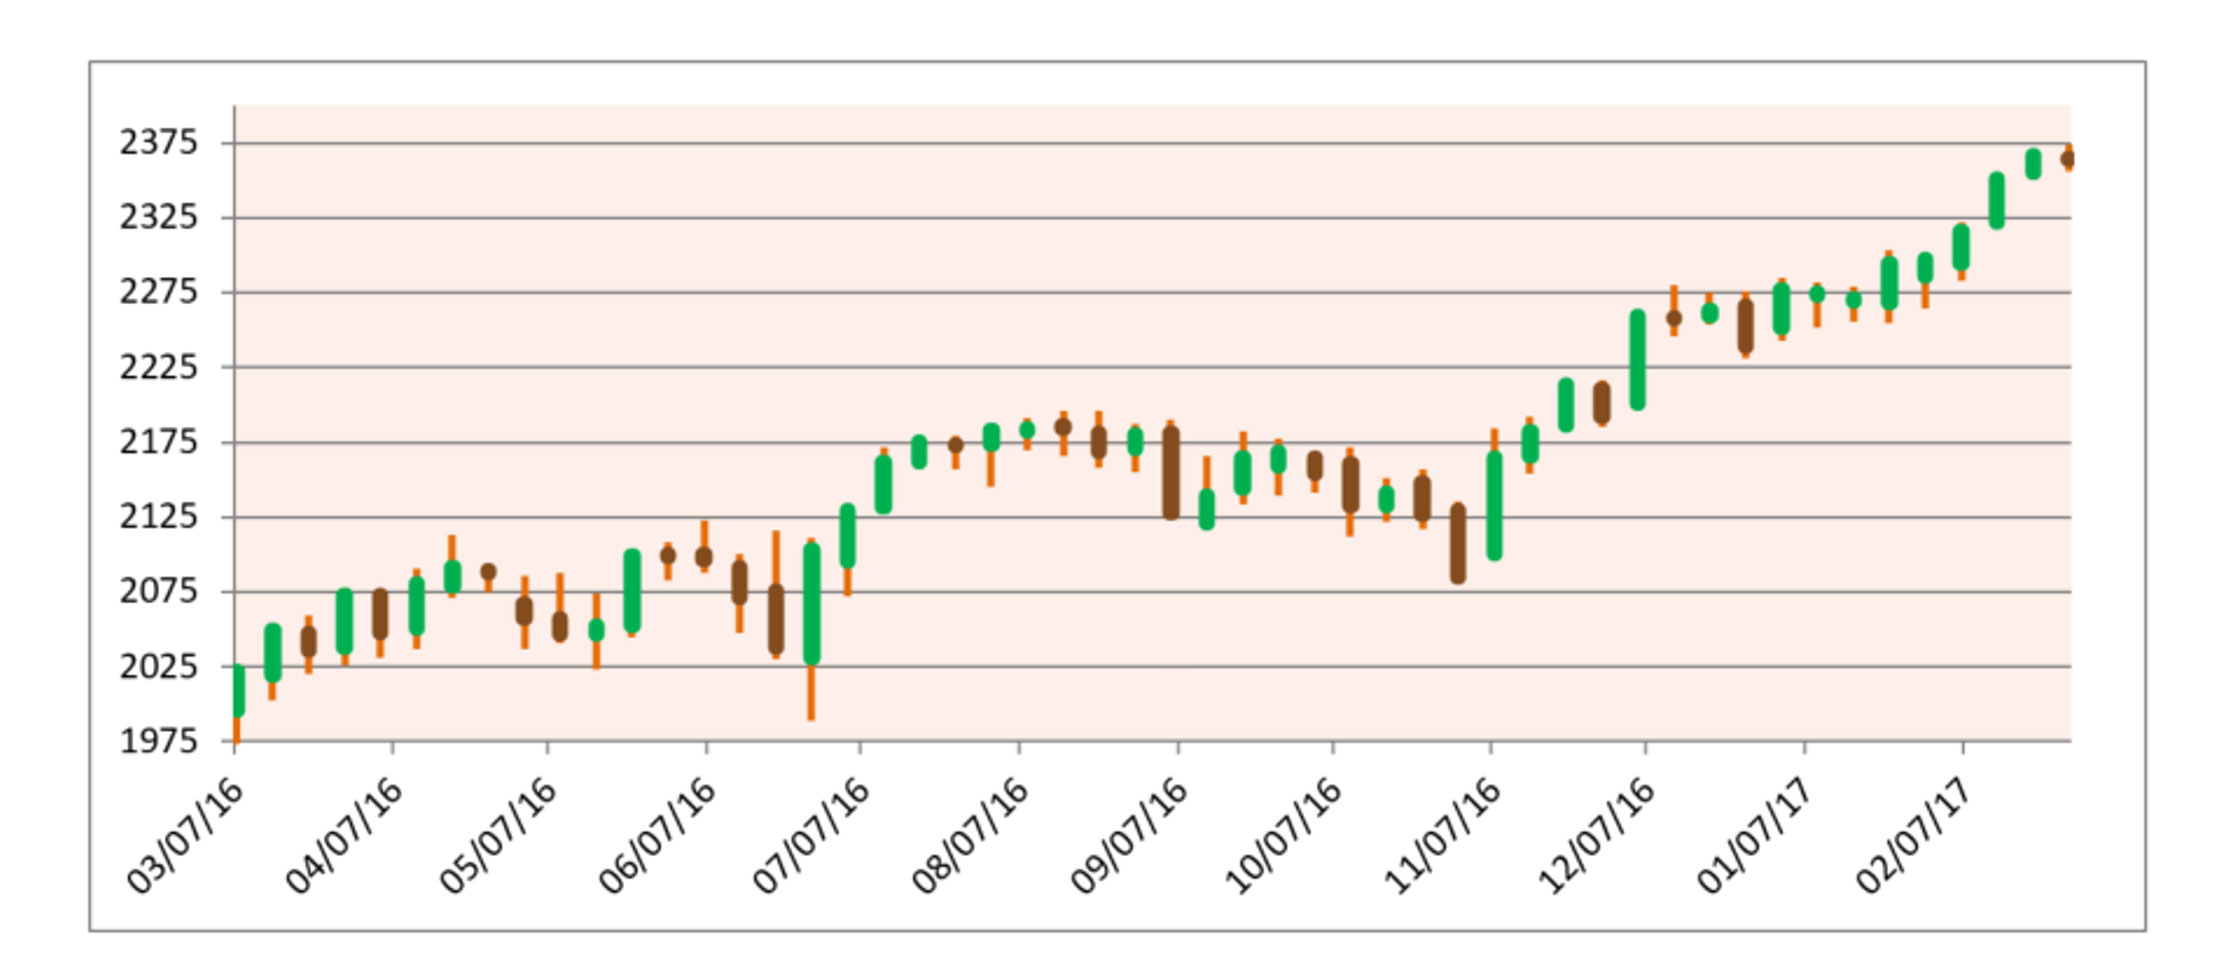
All of last year through October, the market was moving mostly sideways in a relatively tight range. Since the election, however, the S&P has been on fire and all four Market SQN scores between 200 and 25 days are rated strong bull quiet.
|
|
|
|
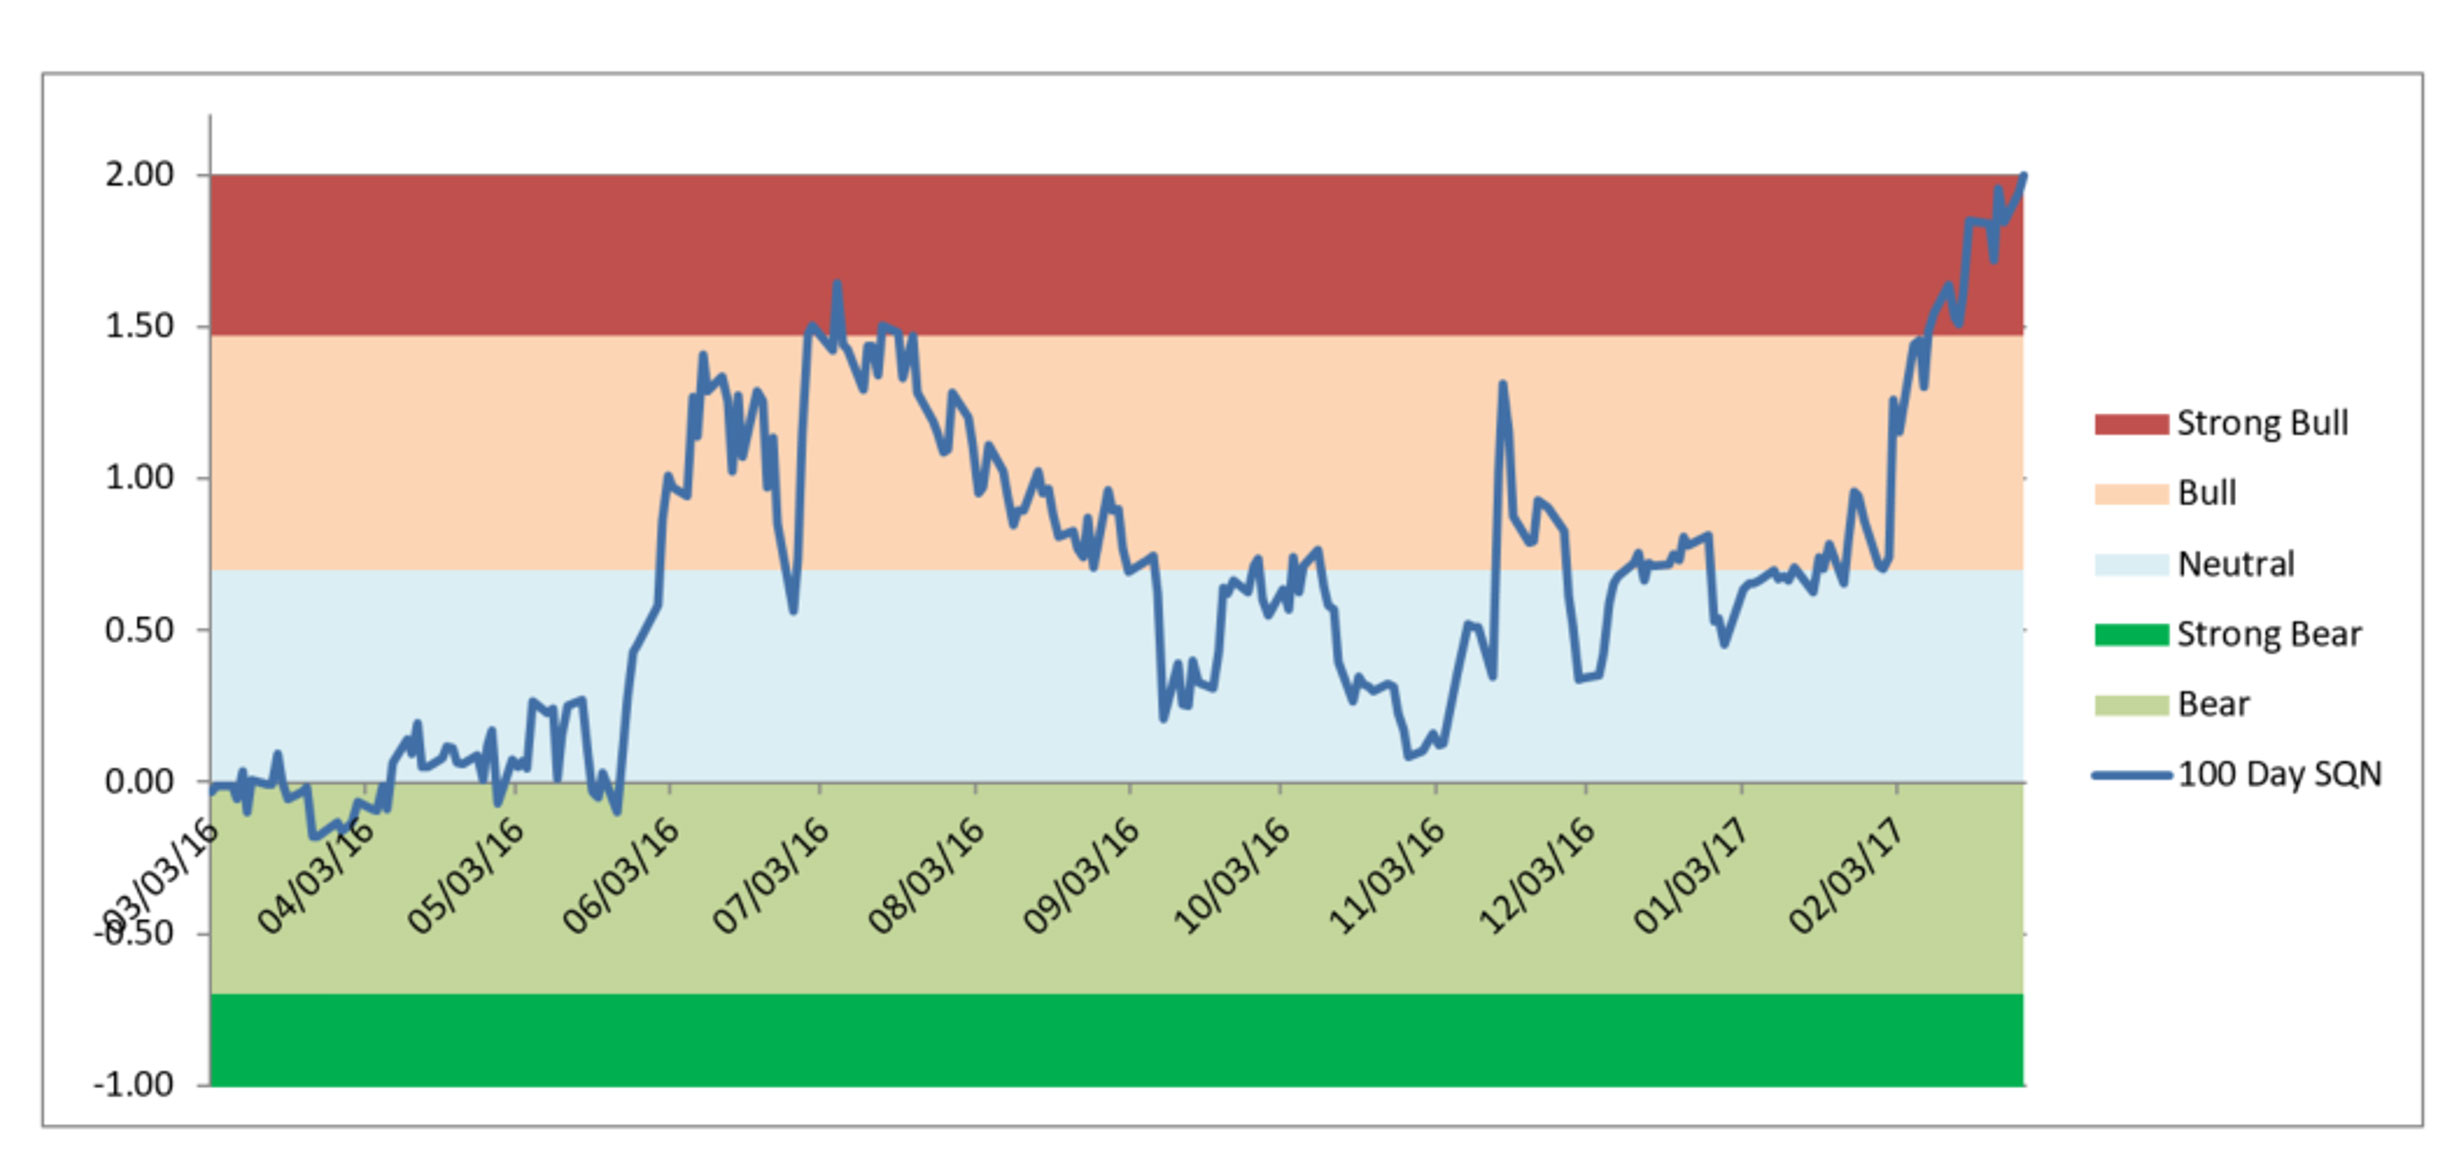
Compare the price bar patterns to the Market SQN chart below. The Market SQN score was neutral to bullish after June of 2016 but since November, it has moved from neutral, to bullish and now to strong bullish.
|
|
|
|
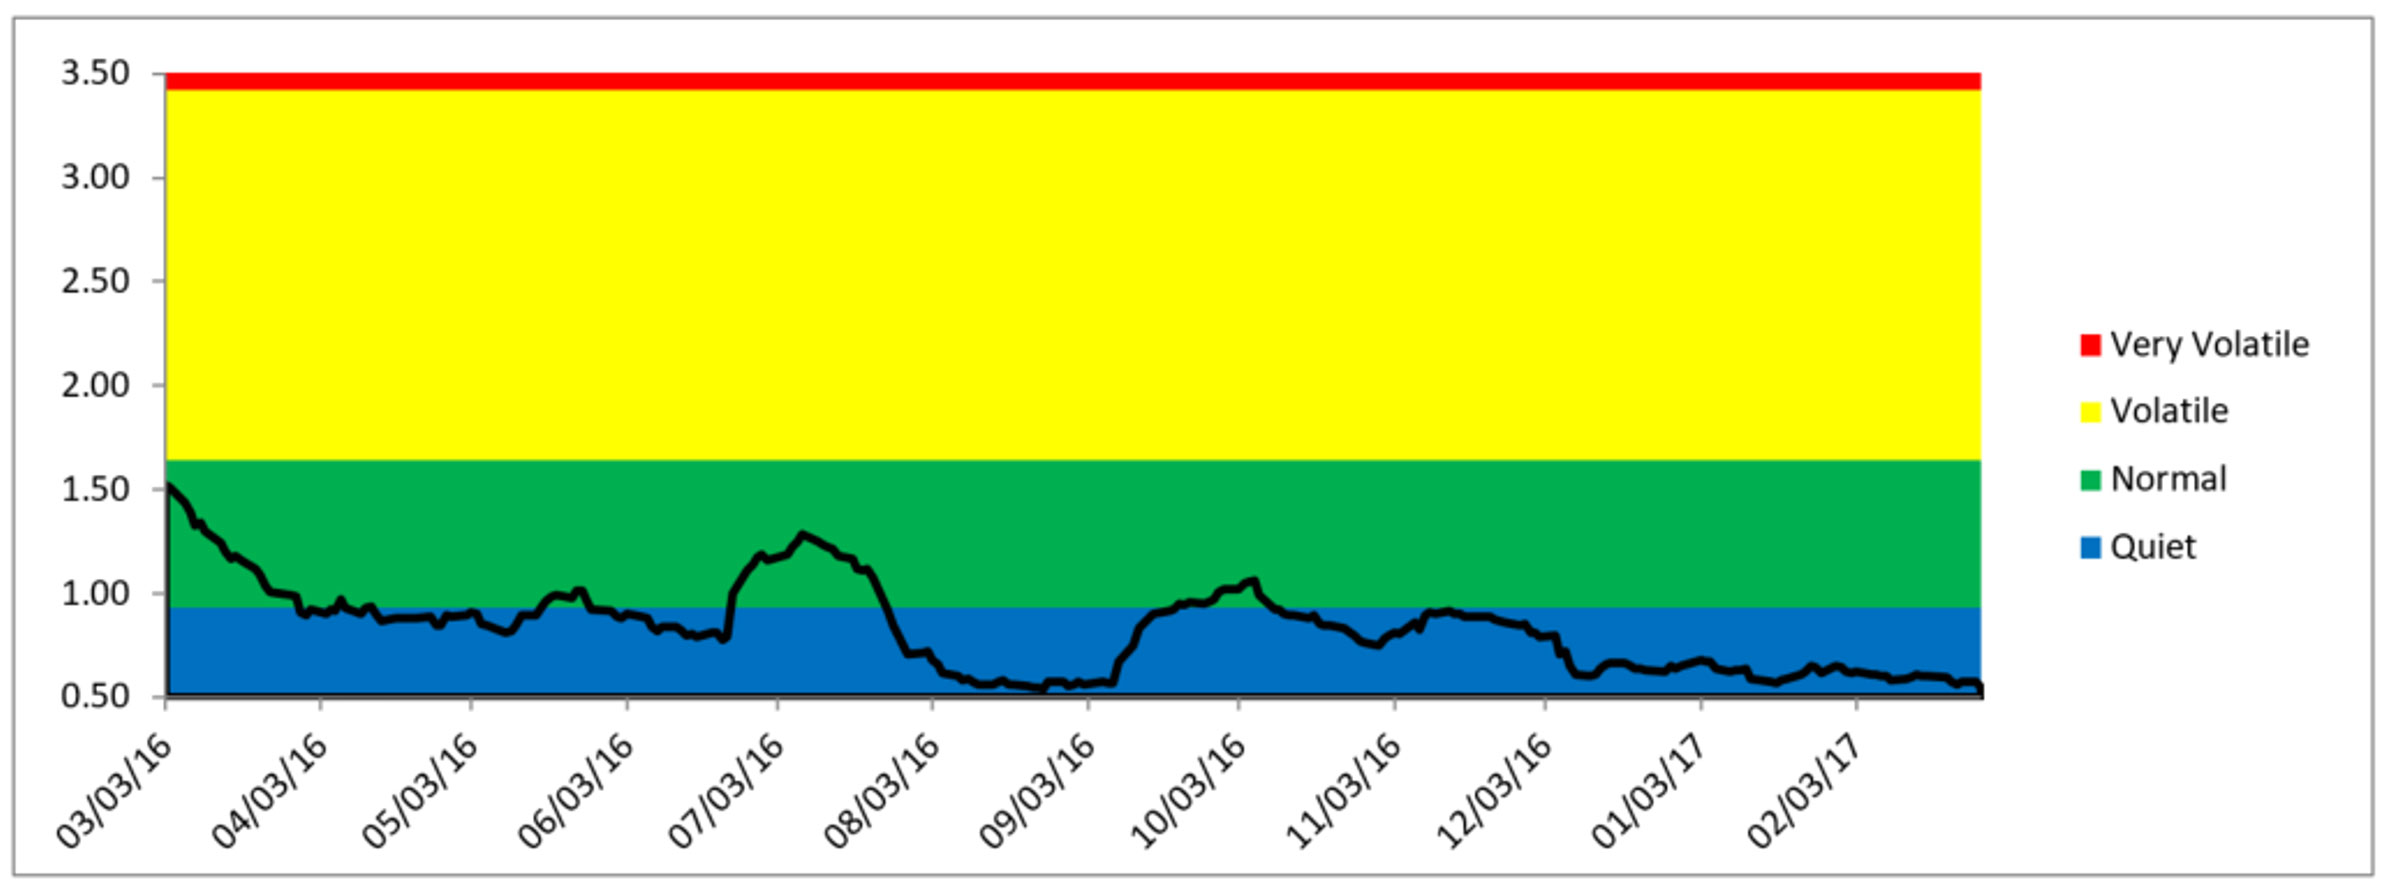
Volatility has been in the quiet range mostly for nearly the last year. Right now, there is little danger in terms of volatility.
|
|
|
|
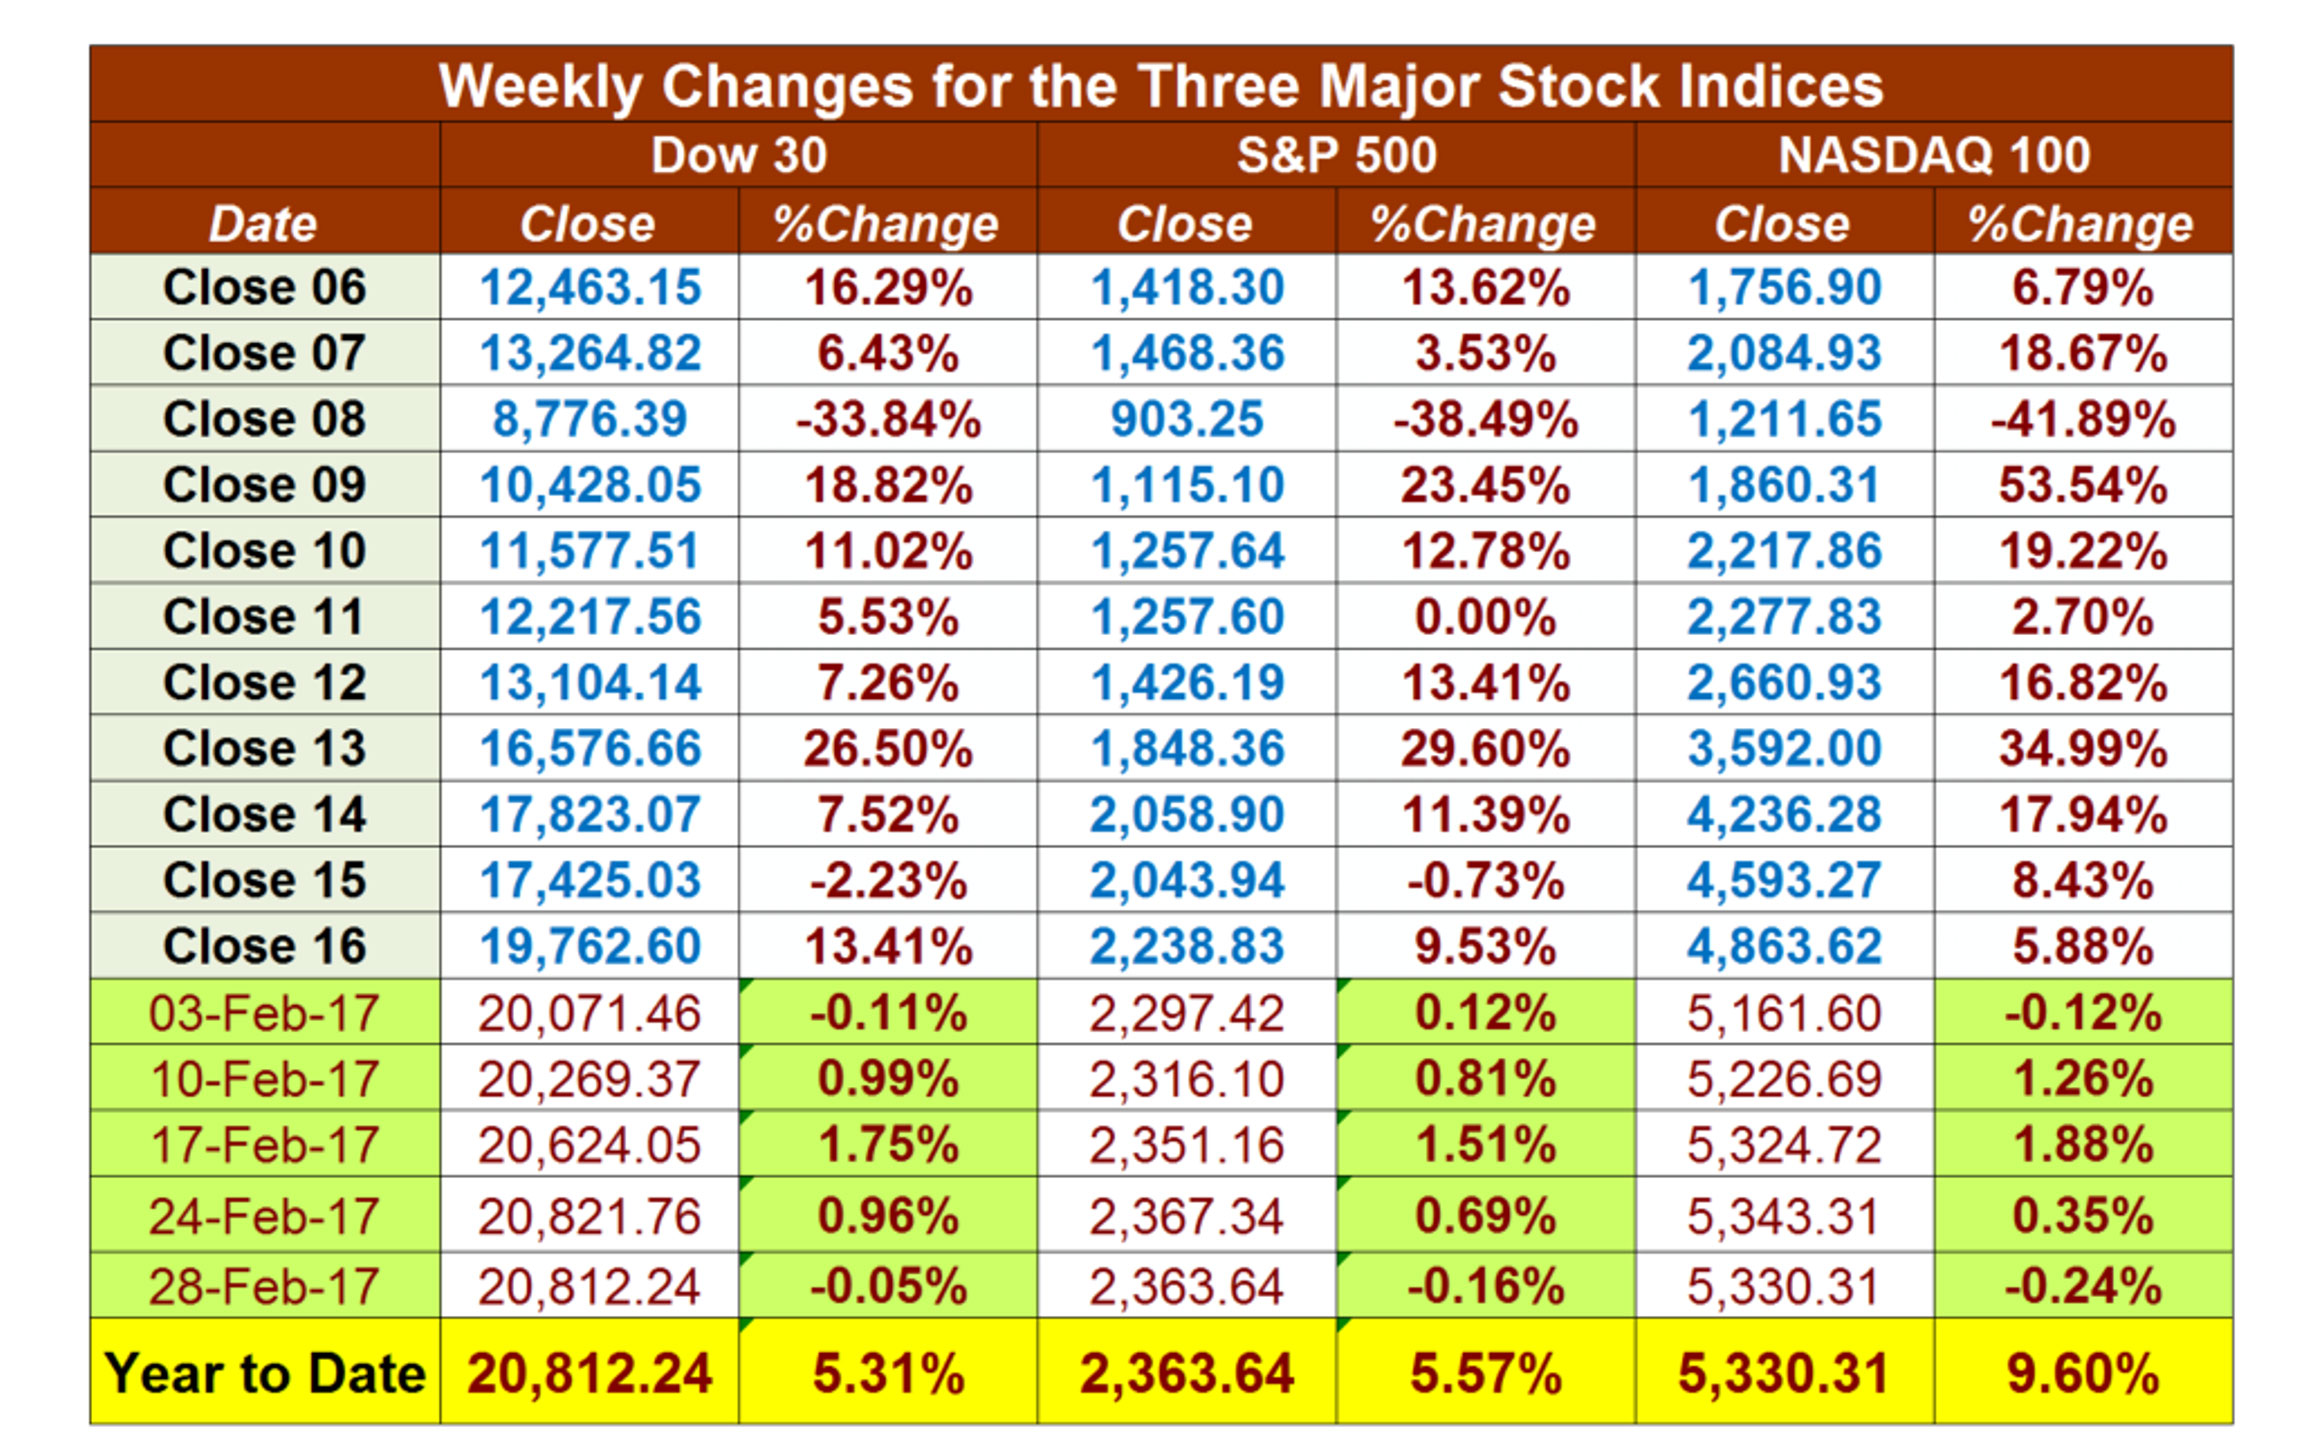
The table below reports the three major US Indices levels through Tuesday, February 28th. All three market indices are up nicely for the first two months of the year of 2017. The S&P 500 is up 5.57% on the year, the Dow is up 5.31% and the NASDAQ 100 is up 9.6%. Are you up over 5% already for 2017?
|
|
|
|
Part III: Our Four Star Inflation-Deflation Model
My inflation-deflation model has generated mostly deflationary scores for the last few years. Deflation means that stuff generally becomes cheaper. For the last few years, the model has generated mostly deflationary scores but in 2016, the model started shifting results to the inflation side, which means that stuff has tended to get more expensive. Markets move in correlation to inflation/deflation trends so it can be helpful to track these trends.
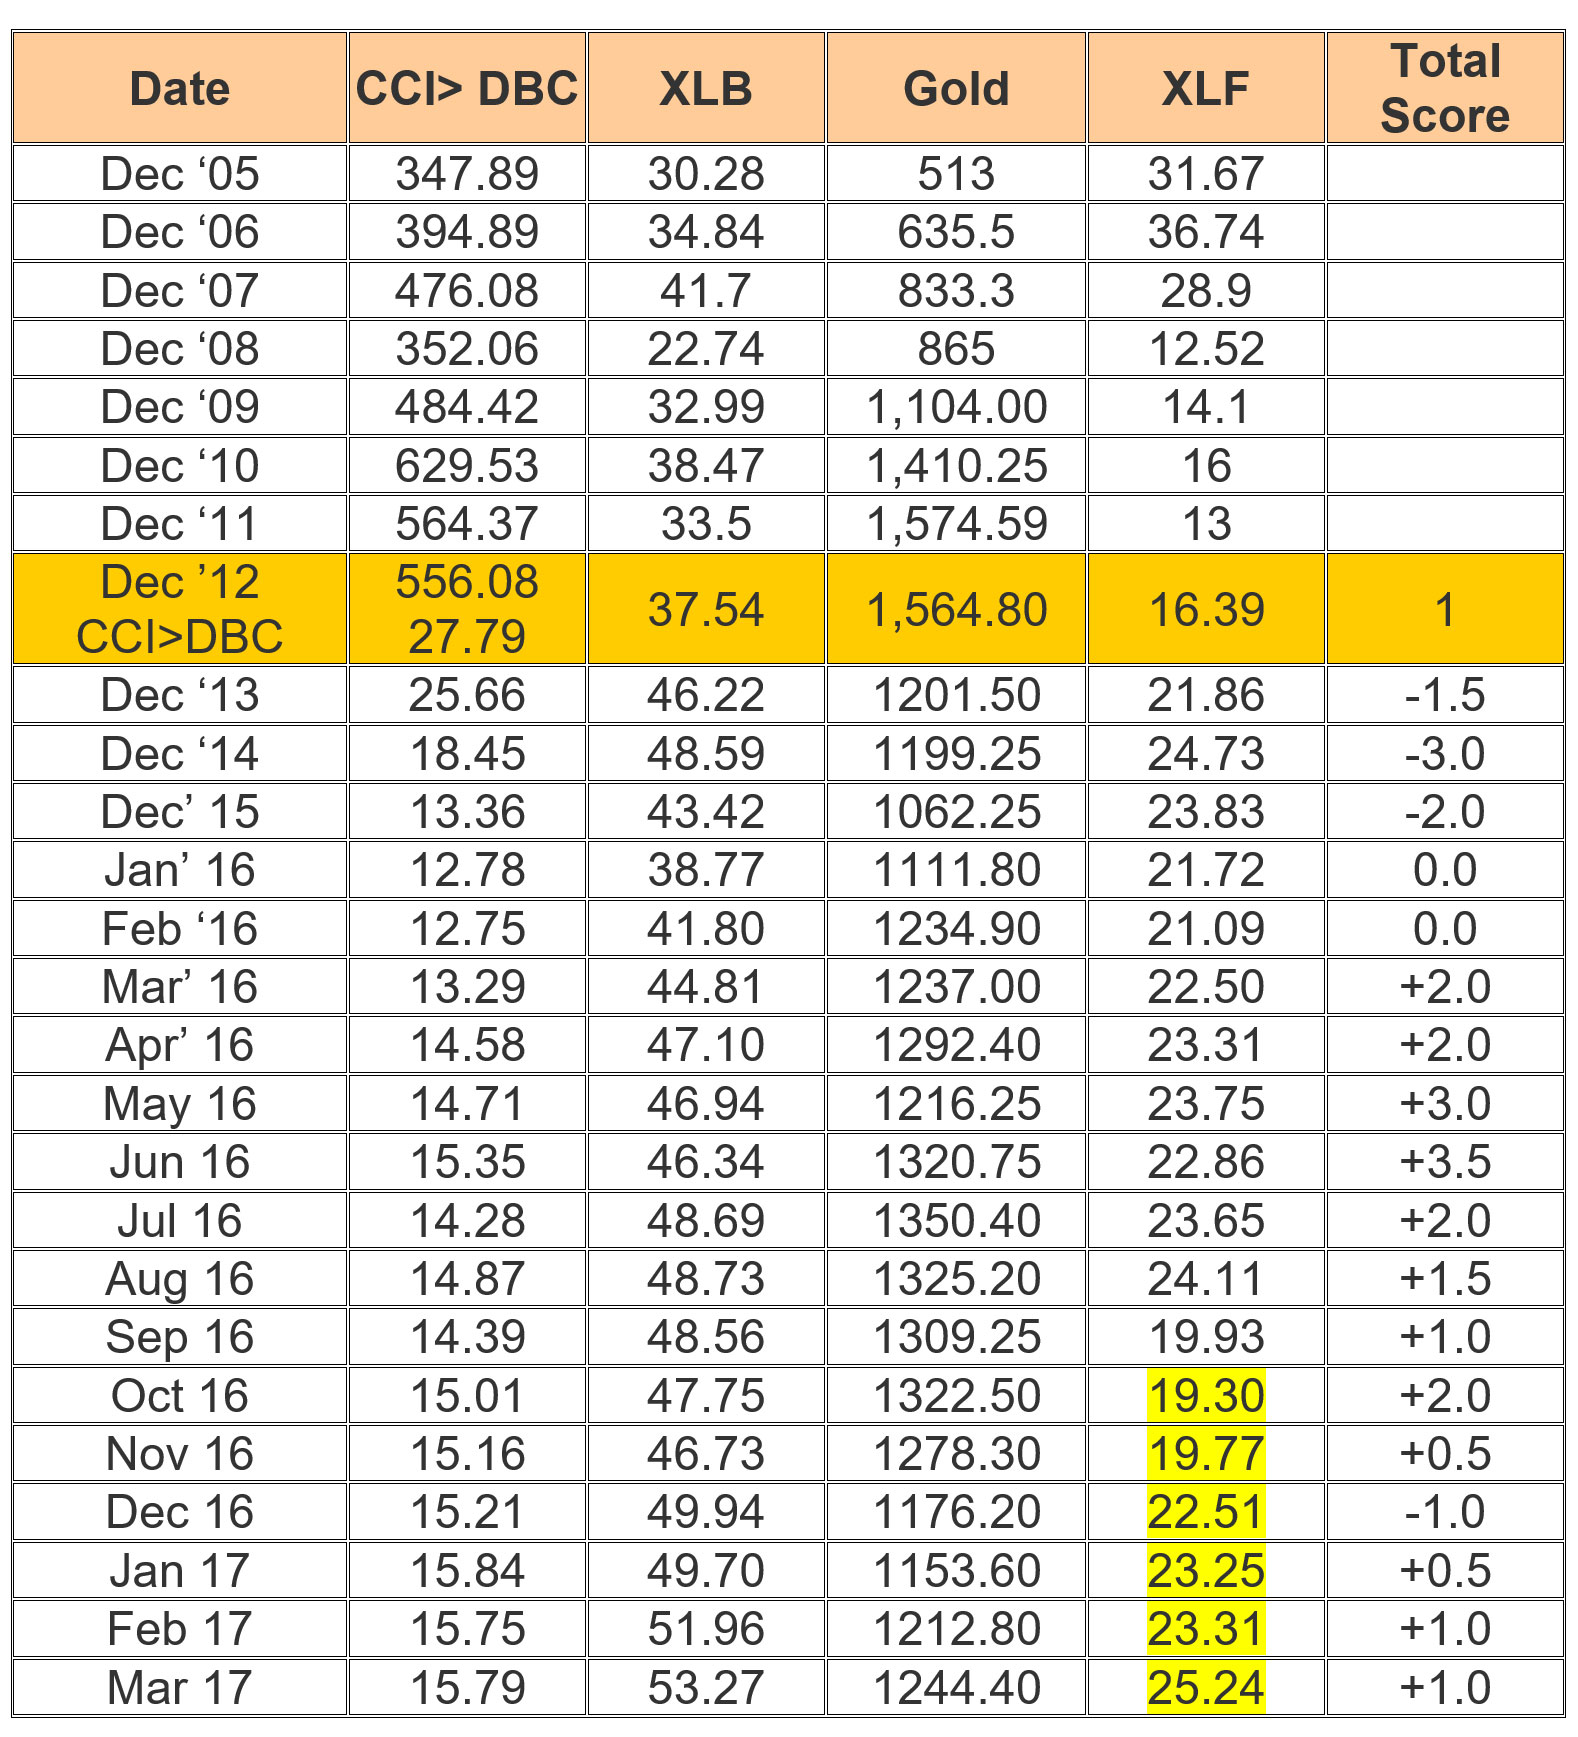
The tracking table below has historical and current year figures.
|
|
|
|
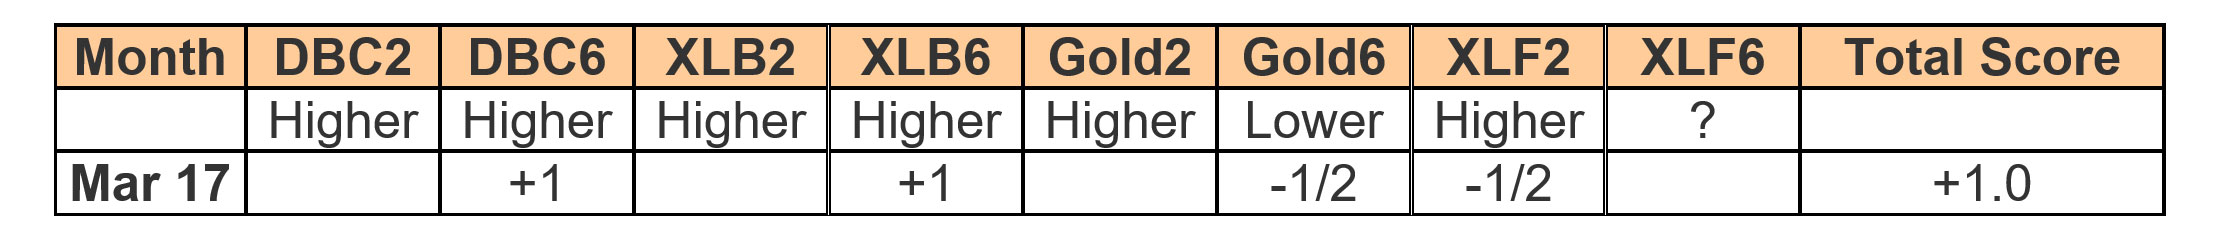
Here are the model components and how the prices looked at the end of February compared with two months back and six months back.
|
|
|
|
The score of 1.0 out of a possible 3.5 is again moving toward inflation, which continues the trend started in 2016.
The score of 1.0 out of a possible 3.5 is again moving toward inflation which continues the trend started in 2016.
Note: XLF recently had a stock split and declared a dividend. As a result, I will use the other three full components of the model and only use the two-month change portion of the XLF component. When we have seven months of the new XLF price data (next month), I will start using that long-term portion of the model again.
Part IV: Tracking the Dollar
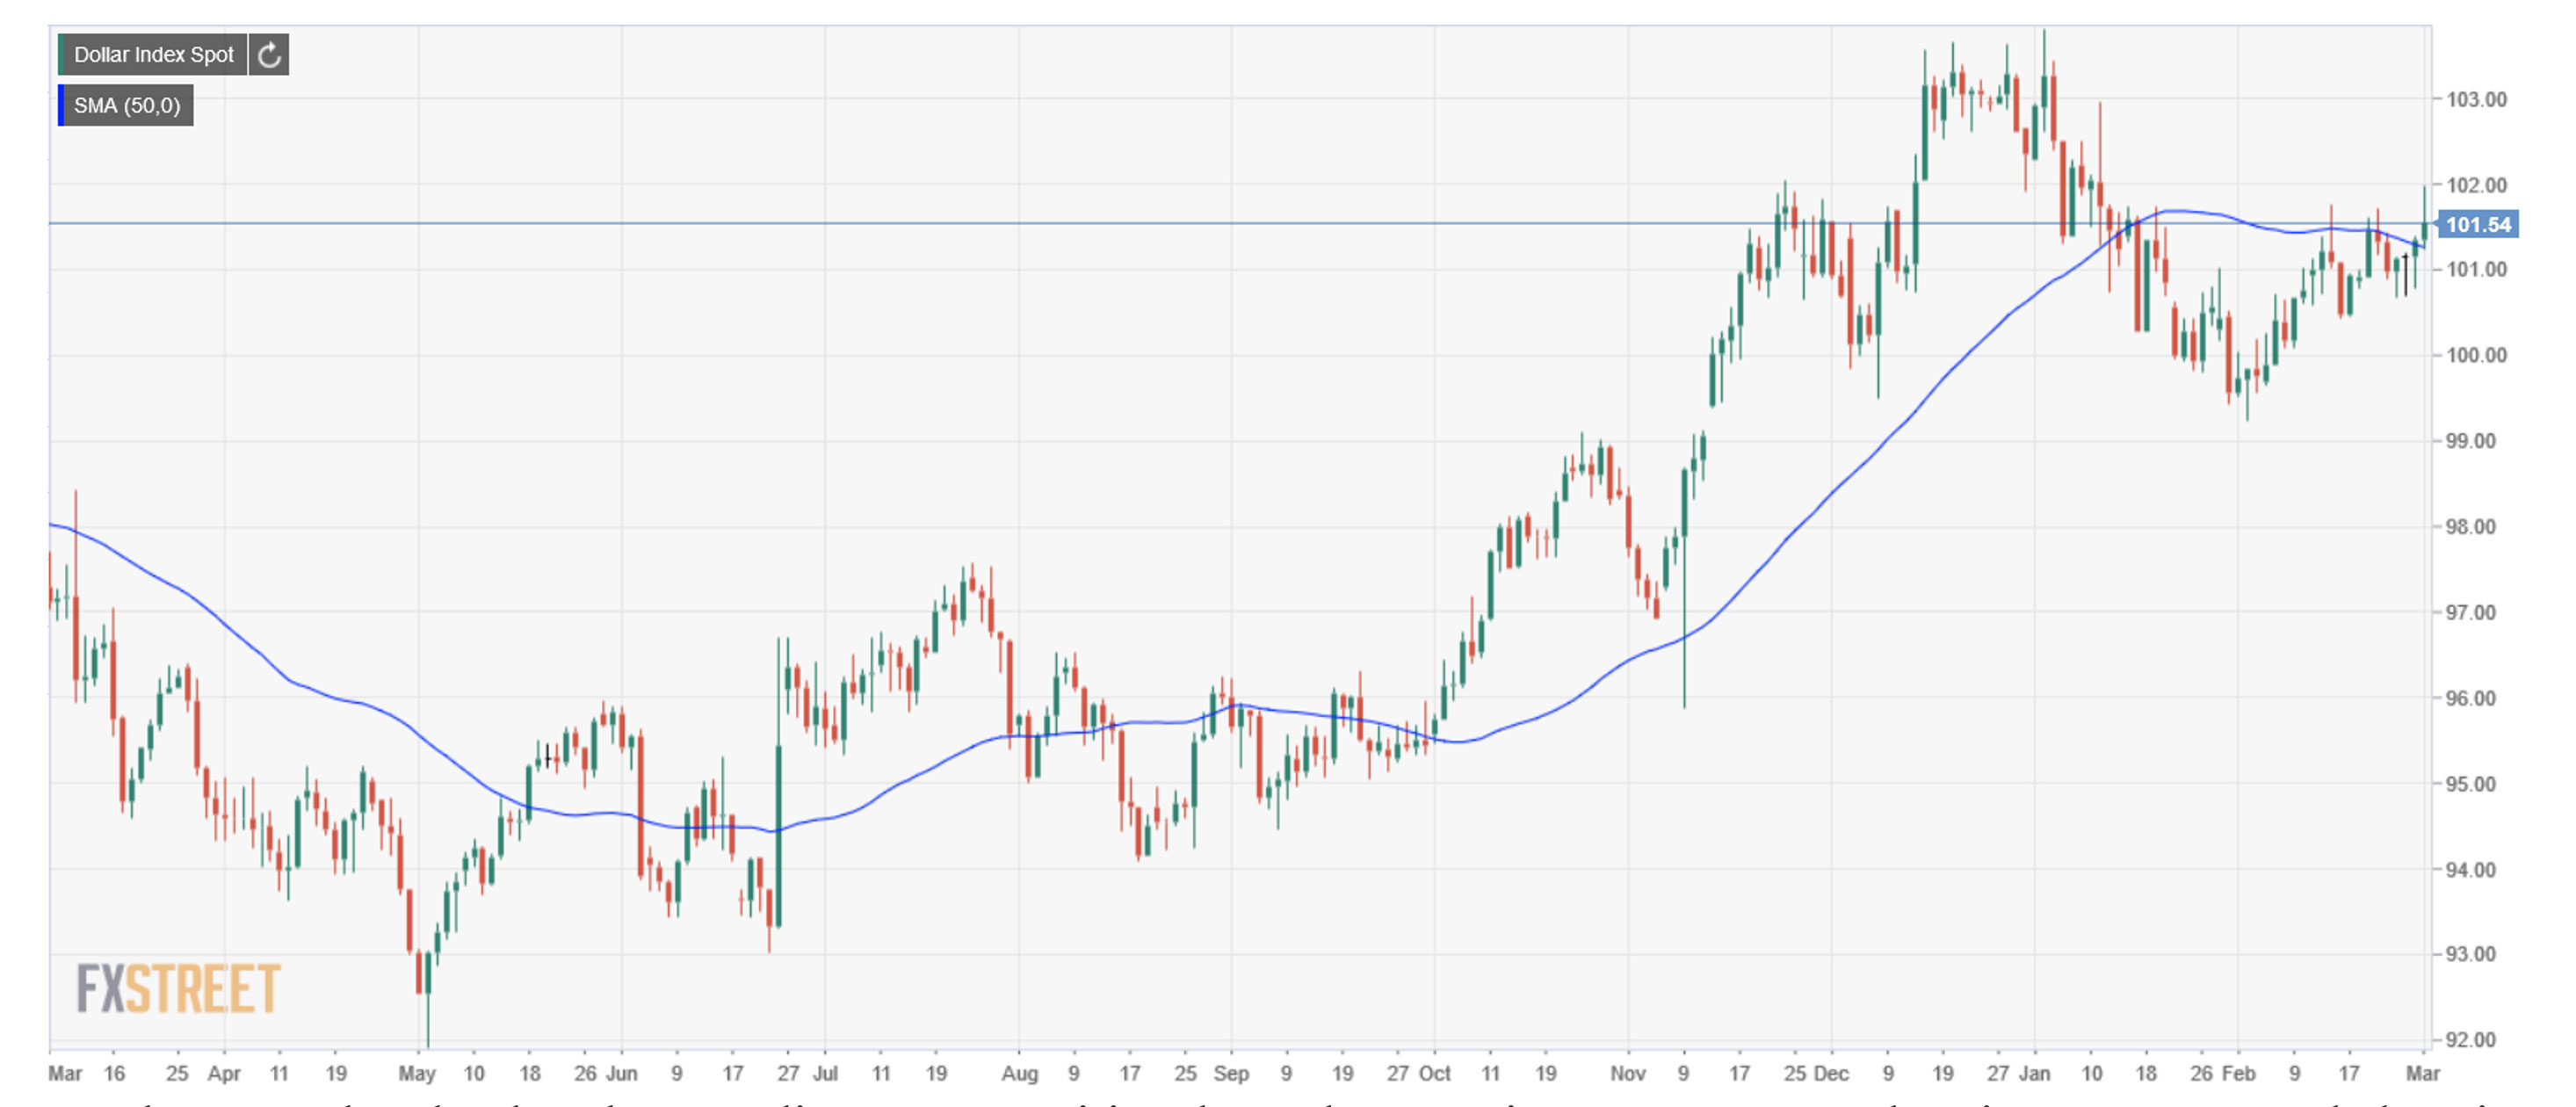
The US Dollar Index remains very strong because the Fed raised interest rates for the second time in December, however, the index declined for most of January. In February, it started climbing again and now it’s at 101.52 - which is still very strong. I was in Vietnam, Cambodia and Malaysia during a cruise in February and they all prefer US Dollars to their own currency.
|
|
|
|
Conclusion
I wrote an update on the state of the market in January, and none of my conclusions have changed since then.
Until next month, this is Van Tharp.
|
|
|
|
|
|
About the Author: Trading coach, and author, Dr. Van K. Tharp is widely recognized for his best-selling books and his outstanding Peak Performance Home Study program - a highly regarded classic that is suitable for all levels of traders and investors. You can learn more about Van Tharp www.vantharp.com.
|
|
|
|
|
|
|
|
|
Peak Performance 101
March 31-April 2, 2017
|
|
Over the past 25 years, Van K. Tharp has modeled traders and the trading process, seeking answers to questions like, “Why do some traders make fortunes while others lose their nest egg?”
Van Tharp is a NLP modeler. To “model” effectively, you have to find out what behaviors and habits highly accomplished people have in common. Once you identify the common tasks that produce excellent results, you need to develop the beliefs, mental states and strategies that allow you to perform those tasks.
You do not trade the markets. You can only trade your beliefs about the markets.—Van K. Tharp
The Peak Performance workshop hones in on these common tasks and puts you in the driver's seat to take control of your trading success. During this three-day intensive course, you will come to understand how your mental states and beliefs play such a major role in your trading, and reality, your whole life.
What does it mean to say we only trade our beliefs about the markets?
Let’s look at some statements and see what you believe about them:
- The market is a dangerous place to invest. (You are right.)
- The market is a safe place to invest. (You are right.)
- Wall Street controls the markets and it’s hard for the little guy. (You are right.)
- You can easily make money in the markets. (You are right.)
- It’s hard to make money in the markets. (You are right.)
- You need to have lots of information before you can trade profitably. (You are right.)
Do you see the theme? Your opinion about each one of these statements is correct, whatever it happens to be. There is no real right or wrong answer. Some people will have the same beliefs as you and others won’t, but that's not important. What is important is that your beliefs about the markets will direct your thinking and your subsequent actions.
Workshop Objectives:
- How great traders approach their craft and learn a daily procedure that resembles what they do.
- How you create your own experience in the market and how you are responsible for the results that you get.
- Become more aware of some of your own psychological issues that affect your performance as a trader/investor.
- Learn about expectancy, position sizing strategies and the power of big R-multiples through a simulation game. This game is also designed to help you observe your emotions in a setting in which only a small amount is at stake compared with what you will face in the market.
- Learn some of the variables that affect your emotions and how you can gain control over them.
- Learn to overcome self-sabotage through exercises done in the class.
- Students will get guidance on how to develop an ongoing program to work on themselves using the Super Trader Program as a model.
- Students will leave with a plan to make the maximum use of the workshop.
Participants in this course will get to meet and network with some really great people who a lot in common with each other. Once you attend Peak Performance 101 you have met the prerequisite to attend other workshops in the Peak series (202, 203, & 204). Plus if you have interest in applying for the Super Trader Program this is a qualifying workshop to submit an application.
A Recent Email From A Student:
"The Peak Performance Workshop is the single greatest transformational and supportive trading activity I've have ever been apart of.
The course helps the trader gain an insight about him/herself that is unavailable otherwise. When first taking the course I was looking for a single objective or takeaway that would advance my trading.
After attending the workshop I now see that just as with trading no single aspect contributes greatest to success. Combining all the techniques taught will allow for major transformations just as dieting and exercising will allow someone to get into better shape over time. I highly recommend the course to anyone preferably before you begin trading to save yourself some hard felt emotions."—Sincerely, Davon Albury
|
|
|
|
Following Peak 101 in April, we will have
Peak Performance 203 and
The New Infinite Wealth Workshop.
|
|
|
|
Presented by R. J. Hixson
and Kirk Cooper
|
|
|
|
|
|
|
|
|
|
|
|
|
March 7-9
Tuesday-Thursday
|
|
|
|
|
|
|
|
|
|
Presented by Van Tharp
and Rebecca Price
|
|
|
|
March 18-19
Saturday-Sunday
|
|
|
|
|
|
|
|
|
|
Presented by Van Tharp
with co-presenter RJ Hixson
|
|
|
|
March 31-April 2
Friday-Sunday
|
|
|
|
|
|
|
|
|
|
Presented by RJ Hixson
and Kirk Cooper
|
|
|
|
April 4-6
Tuesday-Thursday
|
|
|
|
|
|
|
|
|
|
|
|
April 8-10
Saturday-Monday
|
|
|
|
|
|
|
|
|
|
Attend two events and get an additional $500 off. Attend all three and save $800 more.
|
|
|
Swing Home Study Systems Update
Presented by Ken Long
(Details coming soon on this new offering)
|
|
|
|
|
|
|
|
|
|
|
Presented by Van Tharp
with co-presenter RJ Hixson
|
|
|
|
|
|
|
|
|
|
|
Presented by Libby Adams and RJ HIxson
|
|
|
|
|
|
|
|
|
|
|
|
|
June 10-12
Saturday-Monday
|
|
|
|
|
|
|
|
|
|
March 2017 System Quality Number™ Report
The SQN™ Report
by Van K. Tharp, Ph.D
|
|
|
|
|
There are numerous ETFs that track everything from countries, commodities, currencies and stock market indices to individual market sectors. ETFs provide a wonderfully easy way to discover what’s happening in the world markets. I apply a version of my System Quality NumberTM (SQNTM) score to measure the relative performance of numerous markets in a world model.
The Market SQN score uses the daily percent change for input over a 100-day period. Typically, a Market SQN score over 1.47 is strongly bullish and a score below -0.7 is very weak. The following color codes help communicate the strengths and weaknesses of the ETFs in this report:
- Dark Green: ETFs with very strong SQN 100 scores > 1.47
- Light Green: ETFs with strong SQN 100 scores (0.70 to 1.47).
- Yellow: ETFs with slightly positive Market SQN scores (0 to 0.70). These are Neutral/Sideways
- Brown: ETFs with slightly negative Market SQN scores (0 to -0.7).
- Red: Very weak ETFs that earn negative Market SQN scores (< -0.7).
This is basically the same rating scale that we use for the Market SQN Score in the Market Update. The world market model spreadsheet report below contains a cross section of currently available ETFs; excluding inverse funds and leveraged funds. In short, it covers equity markets around the globe, major asset classes, equity market segments, industrial sectors, and major currencies.
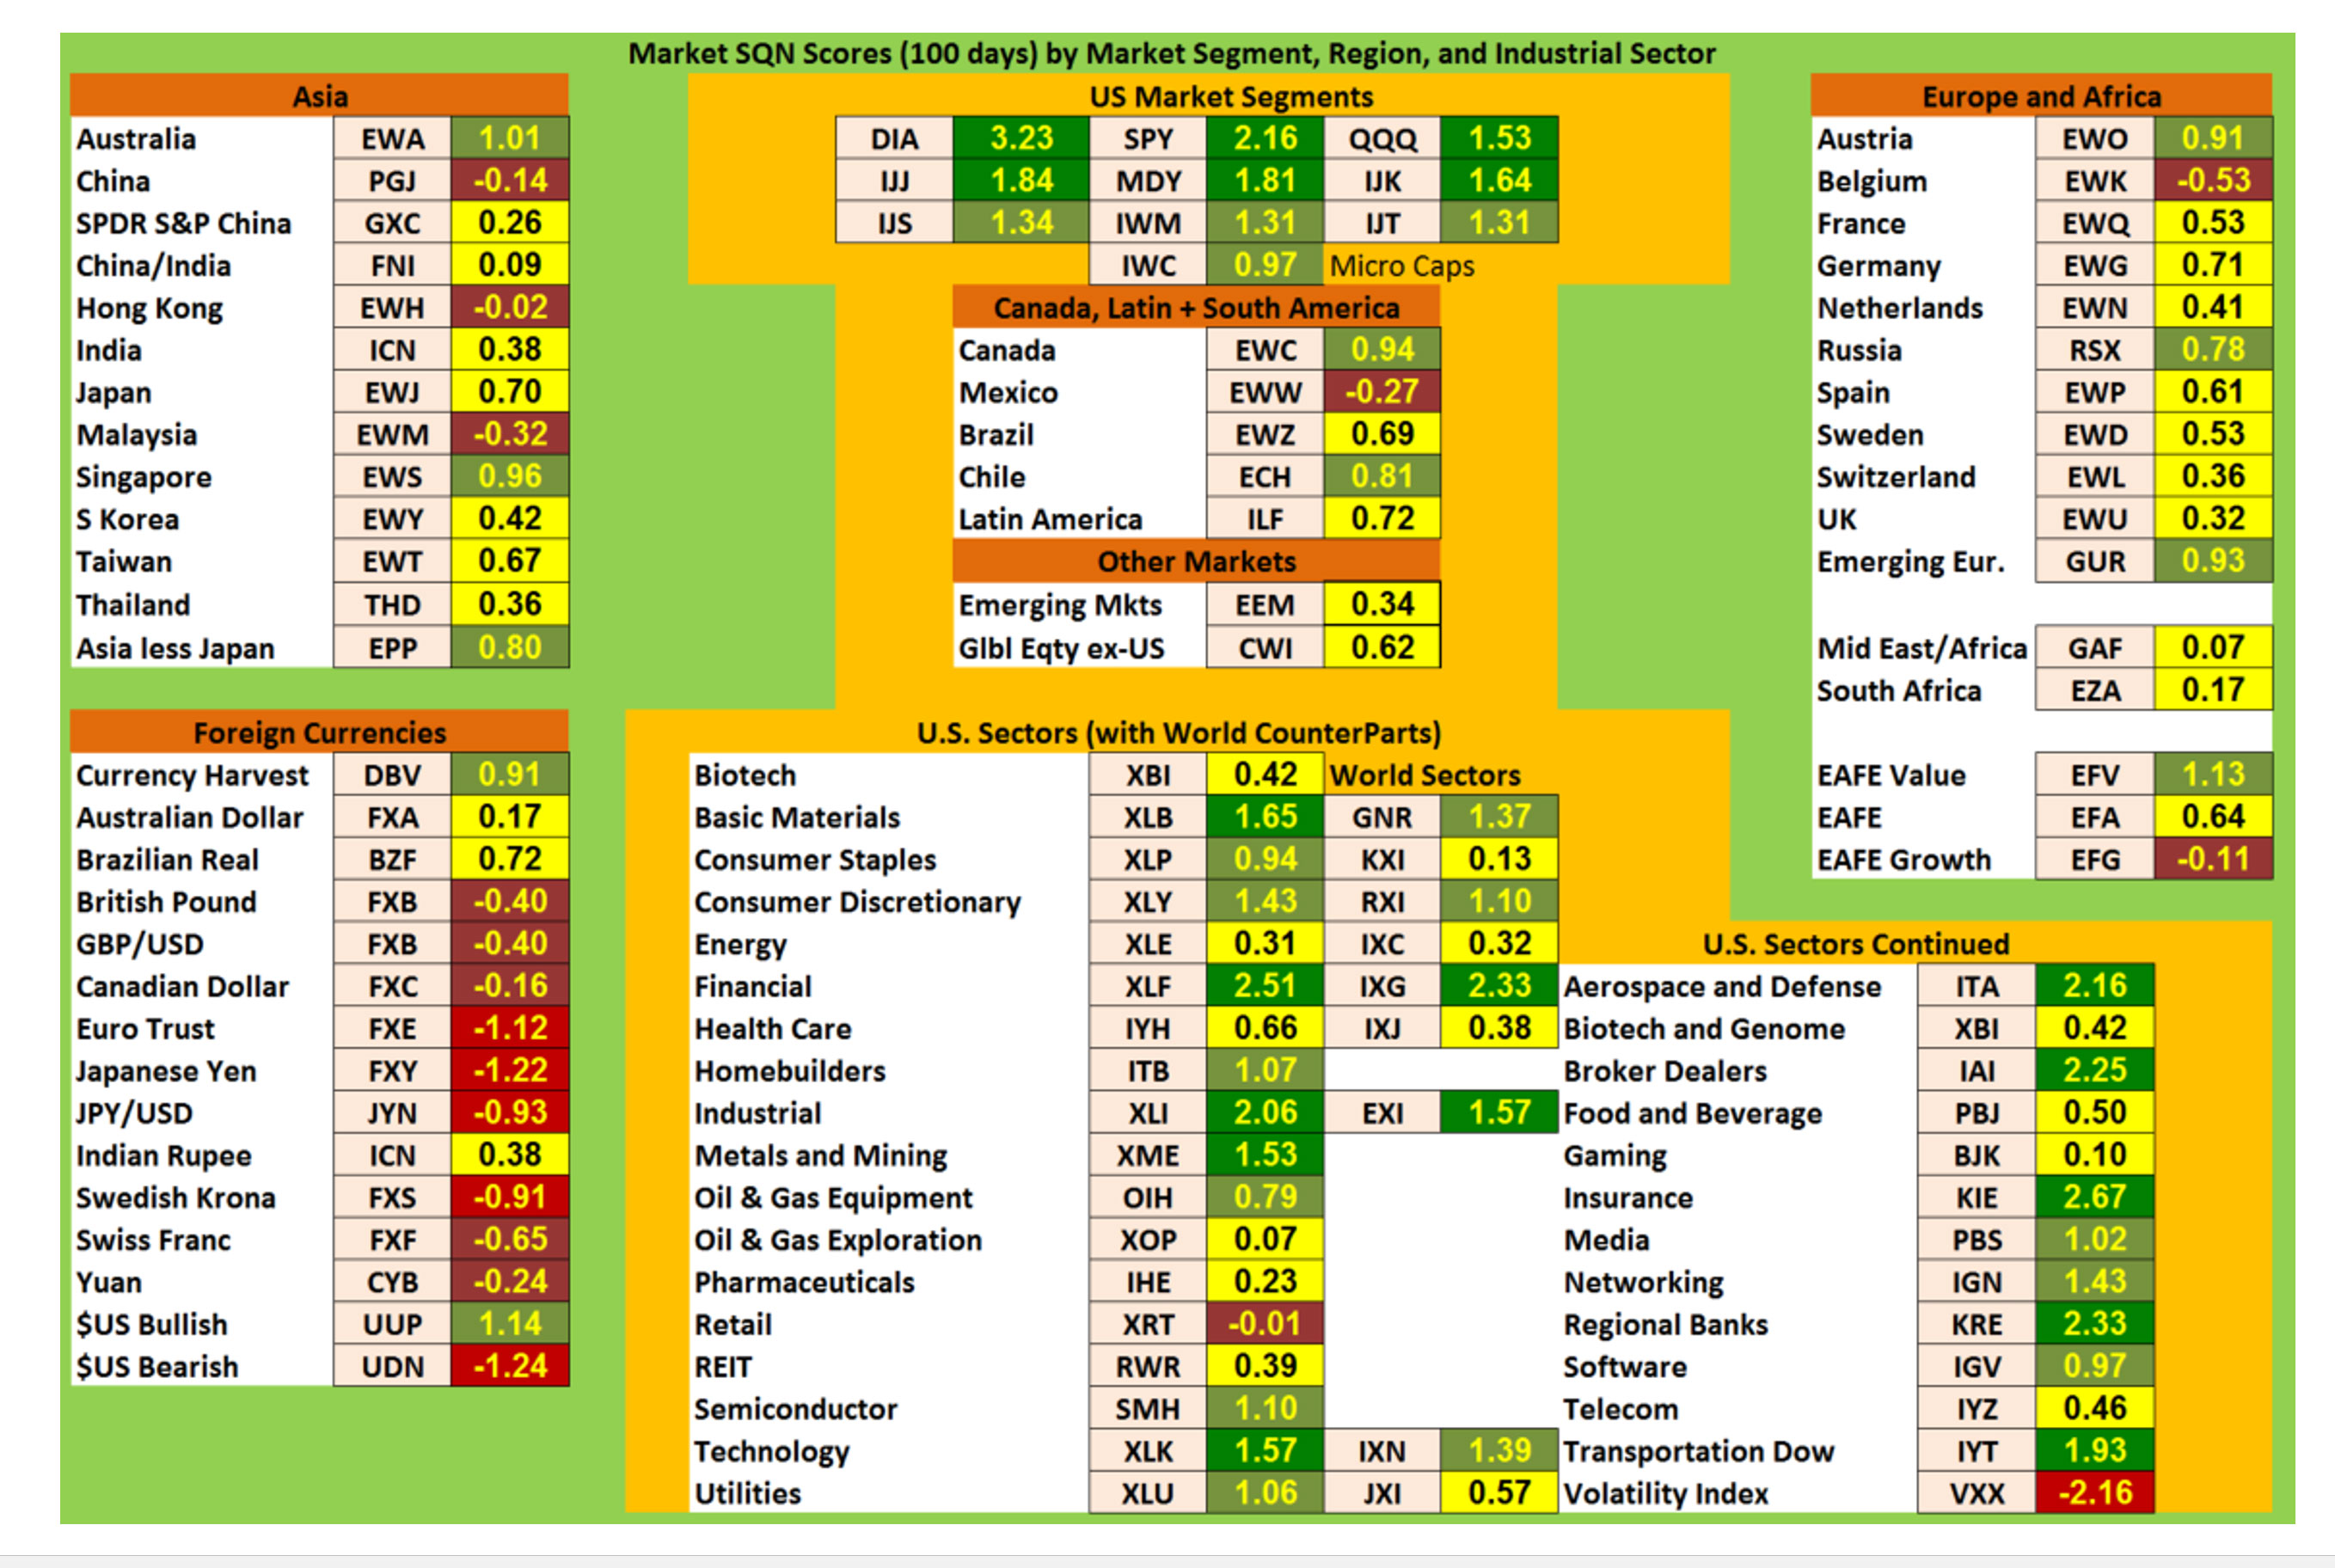
World Market Summary — Equities & Currencies
Each month we look at the equities markets across the globe by segment, region, and sector. I want to caution everyone that the US Dollar (UUP) has a Market SQN® 100 reading of 1.14 at the end of February 2017. Since the entire World Market Model is based upon the US Dollar, its strength could make foreign markets look much weaker than they actually are; they might appear weak only relative to the strong US Dollar.
All of the US equity market segments are dark green or light green. The dark green are all the large and medium cap stocks and the light green are all the small and microcap stocks. The other countries in the Americas are yellow and light green except for Mexico. Hurt by Trump’s policies, Mexico remains brown. Canada and Chile are light green and Brazil and Latin America are yellow.
As a region, Asia has gotten stronger. Malaysia is still now brown and China and Hong Kong remain brown. That’s a function of Trump’s expected trading plans and the strong dollar. Australia and Singapore are now light green.
On the right hand side of the chart, Austria, Russia, and Emerging Europe are light green like last month. France, Germany, the Netherlands, Spain, Sweden, and the UK are all yellow. Belgium is the only remaining brown. The African countries have moved to yellow from brown.
|
|
|
|
In currencies, the only green currency is the US Dollar – light green after having moved there from dark green two months ago. The Brazilian Real and Aussie Dollar are now neutral but everything else is either red or brown. The Japanese Yen is still the weakest currency.
In the US sectors, basic materials, financial, industrial, metals and mining, technology, aerospace and defense, broker dealers, insurance, regional banks, and transportation are all dark green. Many other sectors are light green, including: consumer staples, consumer discretionary, homebuilders, oil and gas equipment, semiconductors, utilities, media, networking, and software. All the rest are yellow with the exception of retail (just brown) and volatility (red). This is a quiet strong bull market.
Commodities, Real Estate, Debt, Top and Bottom Lists
Commodities have had an interesting month. Gold and natural gas are brown. Blended commodities, silver, oil, global water, and agriculture are yellow while steel, timber, livestock, and global agribusiness are dark green. Coal and base metals are light green. The market believes in Trump’s infrastructure buildup promises.
With the Fed raising interest rates twice now and possibly again sometime soon, the real estate and debt sections are all red/brown except for high yield bonds, which are now light green. Junk bonds are now the safe value of income.
|
|
|
|
The Top Ranking List:
What’s really interesting is the top ETF on the list: The Dow Jones Industrials with whopping 3.23 Market SQN Score. The rest of the ETFs on the top list are all financial related or big cap indices. All of the top 15 ETFs in the database are dark green and all have scores above 2.0.
The Bottom Ranking List:
This month’s bottom list is entirely red but only two ETFs show a lower negative than a -2 score – which is the best we’ve seen in a while. Three months ago, we had 3 ETFs below -3.0 which I’d never seen before. The weakest areas now include VIX (volatility) and cocoa. Many of the ones lower on the list are debt instruments.
Summary
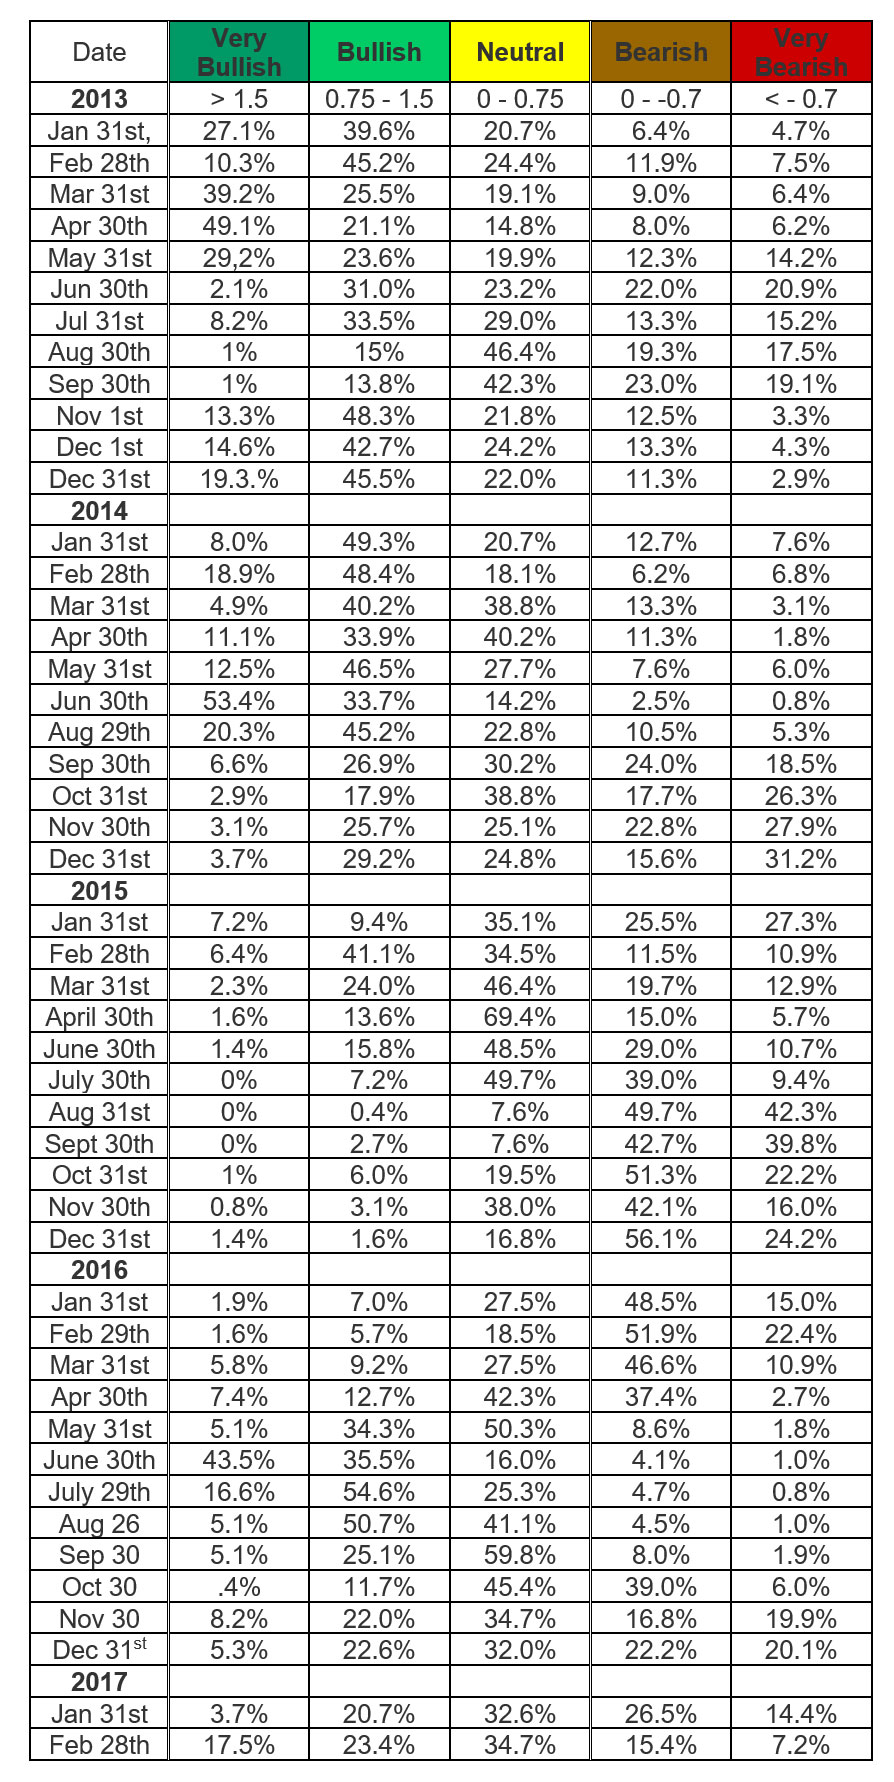
Let’s look at the summary table which measures the percentage of ETFs in each of the strength categories. You can see the figures for the distribution of the database by Market SQN score in bullish, neutral and bearish categories just below.
This table has the database distribution for nearly the last four years -
|
|
|
|
At the end of January the split for bullish/neutral/bearish ETFs was 25%/ 33%/ 43%. This month it’s more bullish at 41%/35%/23%.
So Donald Trump is now president. The markets have moved up broadly although the media seems to use Trump’s actions to explain only the down days in the markets. The media hates Trump and the markets love him.
Be careful to base your actions upon what IS happening, not what you think might happen. The markets always offer opportunities, but to capture those opportunities, you MUST know what you are doing. If you want to trade these markets, you need to approach them as a trader, not a long-term investor. We’d like to help you learn how to trade professionally because trying to navigate the markets without an education is hazardous to your wealth. All the beliefs given in this update are my own. Though I find them useful, you may not. You can only trade your own beliefs about the markets.
|
|
|
|
FREE Book!
We pay for the book, you just pay for shipping.
Read Van’s Latest Book —
TRADING BEYOND THE MATRIX
The Red Pill for Traders and Investors
Eleven traders tell their stories about transforming
their trading results and lives, in this 400 plus page book.
Below is a brief video on how powerful this book is to traders.
|
|
|
|
This home study course is Dr. Tharp’s masterpiece.
Dr. Tharp carefully crafted the information from his studies into a model that people like you can use to improve your skills and increase profits. It's designed for all levels of investors and traders—beginners, advanced, unsuccessful traders seeking to better their performance and successful traders who want to be continue to improve. The course contains 5 workbooks and 4 CDs.
Think of the enriched trading experince, the savings of costly mental mistakes, the propects of more winning trades, and the cost $795 is a true value. BUY PEAK PERFORMANCE HOME STUDY NOW
|
|
|
|
|
This course is most appropriate for success-driven men and women who really want to excel in the market and who are willing to devote the time and energy that it takes to master the key principles. It’s also for brokers and institutional investors and traders who want to improve their company profits.
We expect you to be logical, ethical, practical, open-minded and willing to tenaciously persevere. You must also be willing to invest the effort to better yourself and your trading business. You must be willing to really work to change yourself and your approach to the markets. If that description fits you, then the course will help you immensely. And, we stand behind the results. If you are not happy with the course after one year, return it, along with your completed exercises, for a full refund. Want one month to review the material to see if it is right for you? Do that and return it if you don't like what you see.
The course is for those of you who have considered casting off the handcuffs that tie you down to consistent tax write-offs every year for investment losses. Deep down you know there is a better way for you to direct your energy that will make you consistent profits. LEARN MORE ABOUT PEAK PERFORMANCE HOME STUDY
- "The Peak Performance Home Study Course is the most comprehensive guide ever written about achieving peak performance trading and a peak performance life! It is one of the most challenging things I have ever done, but also one of the most rewarding. The comprehensive planning and discipline acquired through the course has improved my life on a physical, mental, and spiritual level. The improvement in my trading by reducing mistakes and maintaining the discipline to follow my trading rules has been invaluable. I have learned so much about myself and look forward to continuing to apply what I have learned to my trading and continuing to review the course at least once a year. No matter how new or experienced you are, if you commit
to doing the work in this course, you will be amazed by the results in many areas of your life, not just your trading."—Ashay B., Bolder, Colarodo
|
|
|
|
|
|
|
|
|
Cary, NC Workshop Information
For a list of nearby hotels for our Cary, North Carolina locations,
click here.
Book your flight arriving to the Raleigh-Durham International Airport (RDU).
When traveling to a three-day course, it's best to arrive the evening before.
To help determine your arrival and departure times, see:
Questions? Click Here to Ask Van...
CONTACT US
If you no longer wish to receive our email updates, click the unsubscribe link in the bottom-left corner of this email.
This is a supplement to our subscription based newsletter, Tharp's Thoughts.
800-385-4486 * 919-466-0043 * Fax 919-466-0408
|
|
|
|
|