|
|
|
Tharp's Thoughts
Weekly Newsletter
|
|
|
|
|
|
|
|
-
Feature: February 2017 Market Update:
Bull Quiet Market Type, By Van K. Tharp, Ph.D
-
-
Tips: February 2017 System Quality Number™ Report, By Van K. Tharp, Ph.D
-
|
|
|
|
$700 Discount Expires NEXT WEEK,
Feb 8th, on Forex Workshop, Singapore
Watch this video below to hear what others who attended have to say.
|
|
|
|
Forex and Forex Live Trading
About The Forex Systems You Learn In This Workshop:
Every trading system rests on a set of beliefs — whether the trader and/or system developer realizes this or not.
You gain your first edge by simply being aware of the underlying beliefs of a trading system. A great system has many useful beliefs about the market and price behavior that create an edge — it also creates positive expectancy.
As an example, trading against the crowd in certain circumstances can be an edge. Applying those beliefs about why that works by developing a trading system that generates a positive expectancy is an edge — the advantages your system has in the market. You want to find and develop an edge (or several) for each of your trading systems.
I have developed all of my Forex trading systems aligned with Van’s Tharp Think principles. Why? I have simply found that what Van teaches works very well in the markets.
I have worked hard over the years developing three forex trading systems that not only take these principles into account but are robust, profitable, trading systems.
All three systems are trend-based.
The systems can be traded in various time-frames and can be traded across a wide range of currency pairs.
The systems can be used for swing trading using primarily 5-min ,15-min, 60-min, 240-min and Daily candle charts. The trades usually tend to evolve over a time-frame of anywhere from several hours to a couple of days (or even weeks, in the case of strong trends).
Each trend-following system is based on similar “ingredients,” but each has a different recipe to capture a different part of the trend. So, each systems is complementary to each other and together offer several trading setups nearly every day of the year.
I teach these systems over three days in easy to understand terms. I know you need to be able to start trading these systems when you get back home and my goal is to train you to do that.
Our Singapore event also offers two optional days of Live Forex trading so you can trade the systems live, side-by-side with me. This is the ideal path. The workshop can be thought of as the classroom learning and the live workshop is the "field training!
I hope to see you in Singapore in February! This is the closest location we'll have on this workshop for our Australian and Asian clients. Typically you would need to travel to the US for this specialize workshop. --G. Grammatidis
|
|
|
|
Discounts are also expiring soon for Peak Performance 101 in Singapore
In the 4 minute video below Van talks about what he teaches
|
|
Peak Performance 101
Join the thousands of fortunate traders and investors who have already learned the secrets of Dr. Tharp’s carefully researched model for successful trading through this workshop. You will learn for yourself the incredible difference that adopting this model can make for yourself—both in terms of trading profits and in improving your life. That’s the amazing thing about Dr. Tharp’s model—not only will it teach you how to enhance your profits, it will likely help you to become more successful in all aspects of your life, as well.
|
|
|
|
February 2017 Market Update:
Bull Quiet Market Type
by Van K. Tharp, Ph.D
|
|
|
|
|
I always say that people do not trade the markets; they trade their beliefs about the markets. In that same way, I'd like to point out that these updates reflect my beliefs. I find the market update information useful for my trading, so I do the work each month and am happy to share that information with my readers. If your beliefs are not similar to mine, however, then this information may not be useful to you. Thus, if you are inclined to go through some sort of intellectual exercise to prove one of my beliefs wrong, simply remember that everyone can usually find lots of evidence to support their beliefs and refute others. Simply know that I admit that these are my beliefs and that your beliefs might be different.
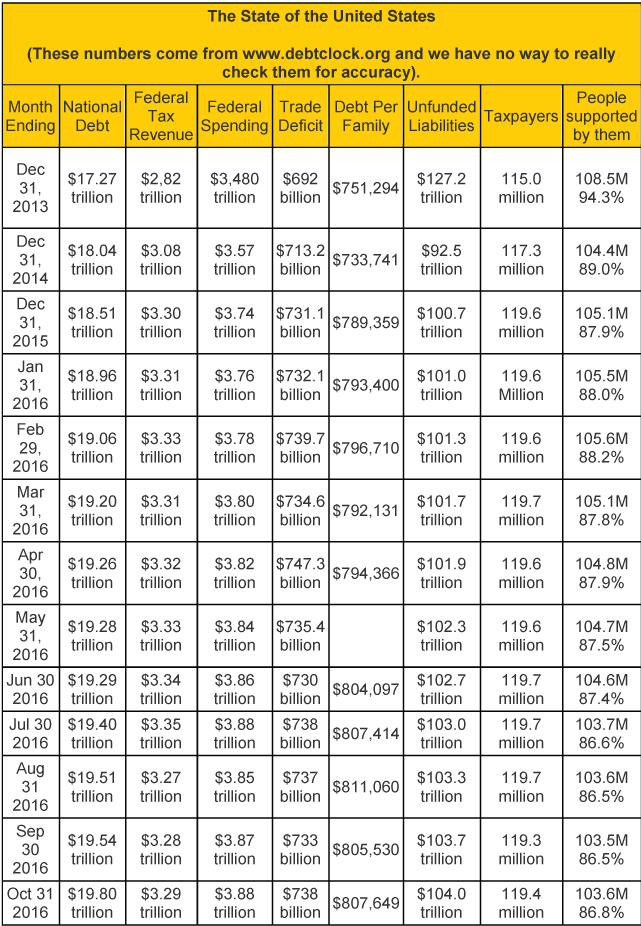
These monthly updates are in the first issue of Tharp's Thoughts each month which allows us to get the closing data from the previous month. These updates cover 1) the market type (first mentioned in the April 30, 2008 edition of Tharp's Thoughts), 2) the debt statistics for the US, 3) the five-week status on each of the major US stock market indices, 4) our four-star inflation-deflation model, and 5) tracking the US dollar. I also write a report on the strongest and weakest areas of the overall market as a separate SQN™ Report. Significant market charges may mean the SQN Report comes out more than once a month.
Part I: The Big Picture
So what are the markets telling us now?
The markets have been quite strong since the Trump election. The Market SQN® score is bullish for the 100-day period as it is for 200 days. The S&P 500 has actually shown 11 new all-time highs in the last 100 days. The Market SQN score for 50 days is strong bull while the 25-day score is neutral — and has been so for 11 of the last 13 days.
|
|
|
|
In late April 2016, usdebtclock.org said our official debt went over the $19 trillion mark and now we are almost at $20 trillion. So, our politicians are doing their usual “wonderful” job of spending our money plus money they don’t have. Don’t expect Donald Trump to be any better.
Incidentally, website says there are 119.7 million U.S. taxpayers. I add together US Retirees (50.4 million) food stamp recipients (42.7 million) and disabled people drawing social security (10.6 million). I don’t think there is any overlap here. Those groups total 103.7 million and that’s why I say that they constitute a group that’s 86.6% of the number of taxpayers. I could also include all government employees (23.5 million) as among those supported by taxpayers - but they do pay taxes. Remember about 10% of the taxpayers (11.97 million) pay most of the tax revenue. By the way, the debt clock lists Medicaid, Medicare, and several other sources of benefits that I don’t include because I assume they are overlaps and thus lists 163.3 million people as receiving benefits.
That’s over half the population. I’m now one of them, as I had to start taking Social Security after I turned 70. I guess I shouldn’t complain, as I never thought I’d collect any of it.
|

|
|
|
|
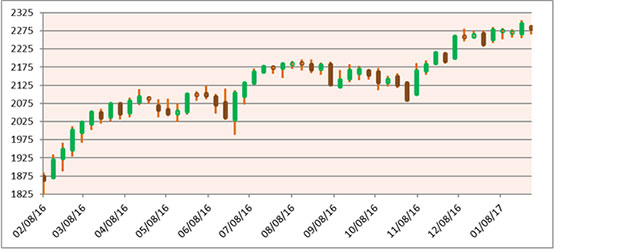
Part II: The Current Stock Market Type Is Neutral/Bull Quiet
The market type classification tells us what is happening today — not what is going to happen tomorrow. All through October, the market moved mostly sideways in a relatively tight range, however, after the election the S&P jumped nearly 200 points and then it has been mostly in a range again now for the last few weeks. You can see that easily just looking at the S&P chart below of weekly bars going back one year. The only negative influence on the market has been some interest rate fears because the Fed raised rates twice late last year — but it decided to leave them alone yesterday.
|
|
|
|
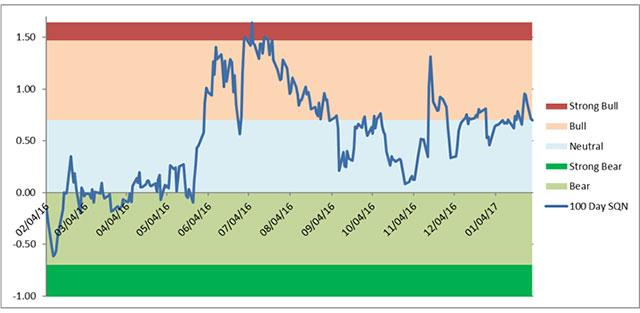
Compare the price bar patterns to the Market SQN chart below. The Market SQN score has been neutral to bullish since June of 2016.
|
|
|
|
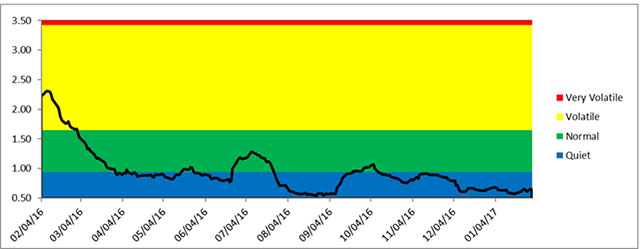
While volatility rose into the normal range in late September/early October for a few days, it has settled in the Quiet range since then. Right now, there is little danger in terms of volatility.
|
|
|
|
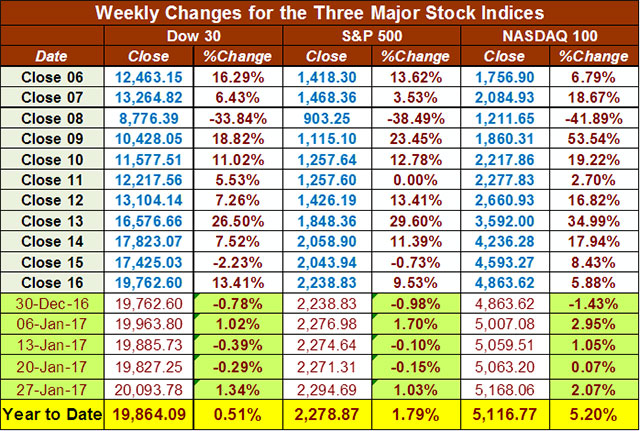
The table below reports the three major US Indices levels through Tuesday, January 31st. All three market indices are up nicely for the first month year of 2017. The S&P 500 is up nearly 1.79% on the year, the Dow is up 0.51% and the NASDAQ 100 is up 5.2%. The NASDAQ 100 is up almost as much in the month of January as it went up in all of 2016.
|
|
|
|
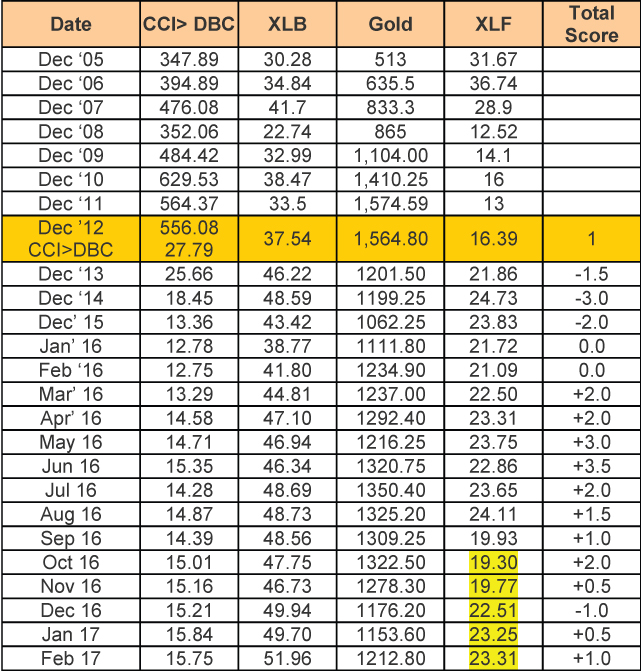
Part III: Our Four Star Inflation-Deflation Model
My model has generated mostly deflationary scores for the last few years. Deflation means that stuff generally becomes cheaper. In 2016, however, the model shifted results to the inflation side, which means that stuff tends to get more expensive. Markets move in correlation to inflation/deflation trends so it can be helpful to track these trends.
The tracking table below has historical and current year figures.
|
|
|
|
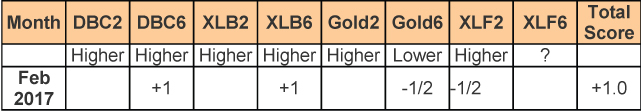
Here are the model components and how the prices looked at the end of February compared with two months back and six months back.
|
|
|
|
The score of 1.0 out of a possible 3.5 is again moving toward inflation, which continues the trend started in 2016.
Note: XLF recently had a stock split and declared a dividend. As a result, I will use the other three full components of the model and only use the two-month change portion of the XLF component. When we have six months of the new XLF price data, I will start using that long-term portion of the model again.
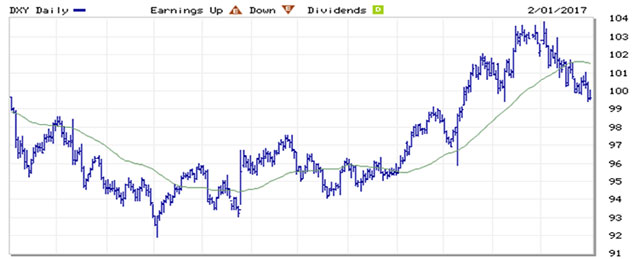
Part IV: Tracking the Dollar
The US Dollar Index remains very strong because the Fed raised interest rates for the second time in December, however, the index declined for most of January. It’s now at 100 — which is still very strong. We are going to Singapore in February so if the Tharp effect holds, perhaps it’s time to start watching the Singapore dollar.
By the way, the absolute best trading opportunities these days are in Forex. We are hosting a Forex workshop in Singapore in a few weeks. We are bringing our Forex workshop to Asia in large part for the many Australians who are trading or want to trade Forex. We cannot, however, present “technical” trading workshops in Australia. The Forex workshop in Singapore in February is a great opportunity for anyone in the Asia Pacific region who wants to experience the numerous benefits of trading Forex. I’ll also be teaching a Peak Performance 101 workshop, our first one in Singapore in perhaps 10 years.
|
|
|
|
Conclusion
I wrote an update on the state of the market two weeks ago, and none of my conclusions have changed since that time.
Next month, RJ Hixson will write the market update as I’ll be returning from Singapore.
|
|
|
|
|
|
About the Author: Trading coach, and author, Dr. Van K. Tharp is widely recognized for his best-selling books and his outstanding Peak Performance Home Study program - a highly regarded classic that is suitable for all levels of traders and investors. You can learn more about Van Tharp www.vantharp.com.
|
|
|
|
|
|
|
|
|
February 2017
$700 Early Enrollment Discount Expires NEXT WEEK on Forex Workshops!
|
|
|
|
Presented by Gabriel Grammatidis
|
|
|
|
February 18-20
Saturday-Monday
|
|
|
|
|
|
|
|
|
|
Presented by Mr. Gabriel Grammatidis
|
|
|
|
February 21-22
Tuesday-Wednesday
|
|
|
|
|
|
|
|
|
|
|
|
February 24-26, 2017
Friday-Sunday
|
|
|
|
|
|
|
|
|
|
Presented by R. J. Hixson
and Kirk Cooper
|
|
|
|
|
|
|
|
|
|
|
|
|
March 7-9
Tuesday-Thursday
|
|
|
|
|
|
|
|
|
|
Learn more about our Bear Workshop
in this short 1 minute video.
|
|
|
|
|
Presented by Van Tharp
and Rebecca Price
|
|
|
|
March 18-19
Saturday-Sunday
|
|
|
|
|
|
|
|
|
|
Presented by Van Tharp
with co-presenter RJ Hixson
|
|
|
|
March 31-April 2
Friday-Sunday
|
|
|
|
|
|
|
|
|
|
Presented by RJ Hixson
and Kirk Cooper
|
|
|
|
April 4-6
Tuesday-Thursday
|
|
|
|
|
|
|
|
|
|
|
|
April 8-10
Saturday-Monday
|
|
|
|
|
|
|
|
|
Swing Home Study Systems Update
Presented by Ken Long
(Details coming soon on this new offering)
|
|
|
|
|
|
|
|
|
|
|
February 2017 System Quality Number™ Report
The SQN™ Report
by Van K. Tharp, Ph.D
|
|
|
|
|
There are numerous ETFs that track everything from countries, commodities, currencies and stock market indices to individual market sectors. ETFs provide a wonderfully easy way to discover what’s happening in the world markets. I apply a version of my System Quality Number™ (SQN™) score to measure the relative performance of numerous markets in a world model.
The Market SQN score uses the daily percent change for input over a 100-day period. Typically, a Market SQN score over 1.47 is strongly bullish and a score below -0.7 is very weak. The following color codes help communicate the strengths and weaknesses of the ETFs in this report:
- Dark Green: ETFs with very strong Market SQN scores > 1.47
- Light Green: ETFs with strong Market SQN scores (0.70 to 1.47).
- Yellow: ETFs with slightly positive Market SQN scores (0 to 0.70). These are Neutral/Sideways
- Brown: ETFs with slightly negative Market SQN scores (0 to -0.7).
- Red: Very weak ETFs that earn negative Market SQN scores (< -0.7).
This is basically the same rating scale that we use for the Market SQN Score in the Market Update. The world market model spreadsheet report below contains a cross section of currently available ETFs; excluding inverse funds and leveraged funds. In short, it covers equity markets around the globe, major asset classes, equity market segments, industrial sectors, and major currencies.
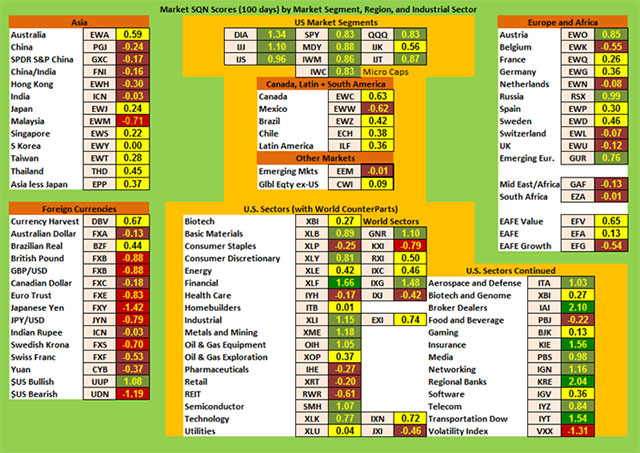
World Market Summary — Equities & Currencies
Each month we look at the equities markets across the globe by segment, region, and sector. I want to caution everyone that the US Dollar (UUP) has a Market SQN™ score of 1.52 at the end of December and is 1.08 now. Since the entire World Market Model is based upon the US dollar, its strength could make foreign markets look much weaker than they actually are; they might be weak only relative to the strong US Dollar.
All of the US equity market segments are light green except for one yellow, IJK, which is midcap growth stocks. Microcaps have moved back from dark green, showing the tendency for a slight pullback in speculation. The other countries in the Americas are yellow and getting stronger so perhaps there’s not as much fear over a Trump presidency. Mexico is the remaining brown candidate, but even that’s an improvement — it was red last month.
As a region, Asia has gotten stronger. Malaysia is still red, and China, Hong Kong, and India are brown. That’s a function of Trump’s expected trading plans and the strong dollar. Australia is the strongest country in that section but its Market SQN™ score is only 0.59 — not very strong.
On the right hand side of the chart, Austria and Russia are light green, like last month, and emerging Europe has also moved into that category. Belgium, the Netherlands, Switzerland, and the UK are all brown. The African countries are also brown. But everything else in that section is neutral.
|
|
|
|
In currencies, only the US Dollar is green — light green after having moved there from dark green. The Brazilian Real is now neutral but everything else is either red or brown. The Japanese Yen is still the weakest currency.
In the US, the financial sector is dark green (the market is inferring a Trump presidency means the possibility for a lot of financial deregulation). Broker Dealers (strong markets), Insurance, Regional banks, and the Dow Transports are also dark green. The light greens include — Basic Materials, Consumer Discretionary, Industrial, Oil and Gas Equipment, Semiconductors, Technology, Aerospace and Defense, Media, Networking and Telecom. We have a few browns, Consumer Staples, Health Care, Pharmaceuticals, Retail, REITS, Food and Beverage. The only red is Volatility because this has been a very quiet market in the last 100 days (see the volatility chart in the Market Update article above).
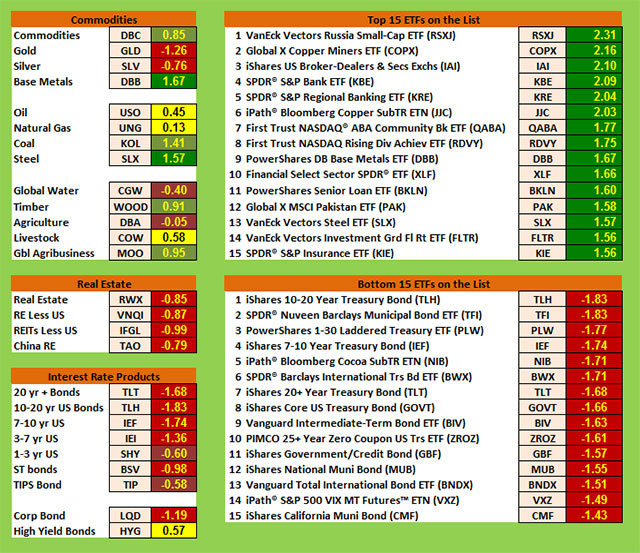
Commodities, Real Estate, Debt, Top and Bottom Lists
Commodities have had an interesting month. Gold and Silver are red, while Agriculture and Global Water are brown. The neutral commodities include: Oil, Natural Gas and Livestock. Steel and Base Metals (which would profit during a Trump infrastructure buildup) are dark green. Commodities, Coal, Timber and Global Agribusiness are all light green.
With the Fed raising interest rates twice now and possibly raising them again sometime soon, the real estate and debt sections of the model are all red/brown except for High Yield Bonds, which are yellow.
|
|
|
|
The Top Ranking List:
All of the top 15 ETFs in the database are dark green with 6 of them having scores above 2.0. These include many of the ETFs we’ve been talking about — Brokers, Regional Banks, Base Metals, and Financial issues being way up on the chart. Copper is also way up there. The market is expecting financial deregulation under Trump with the potential that everything put in place after the financial crisis will be undone. That’s what’s expected so bank stocks are doing really well.
The Bottom Ranking List:
This month’s bottom list is entirely red but the whole list has scores greater than -2.0 — which is better than last month and actually, it’s better than the last few months. Two months ago, we had three ETFs below -3.0 which I’d never seen before. The weakest areas now include ETFs from a few former darling categories — Muni Bonds and various debt instruments. But Cocoa is also in there for some reason.
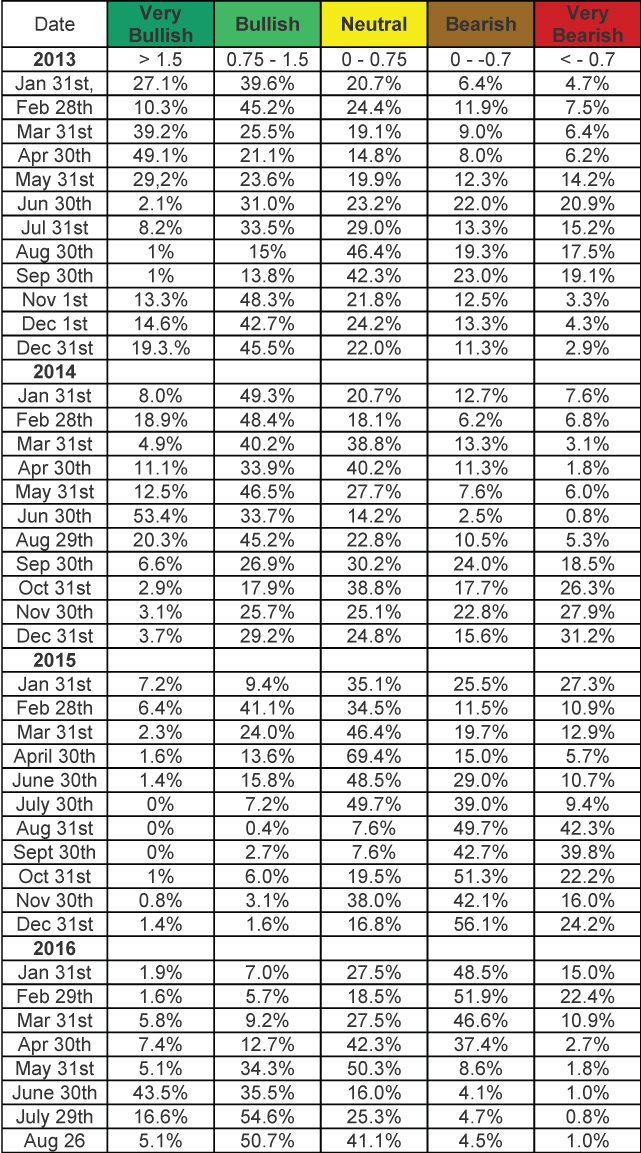
Summary
Let’s look at the summary table which measures the percentage of ETFs in each of the strength categories. At the bottom of the table, you can see the Jan 31st figures for the distribution of the database by Market SQN score in bullish, neutral and bearish categories just below.
This table has the database distribution for nearly the last four years —
|
|
|
|
In December, the split for bullish/neutral/bearish ETFs was 28%/ 32%/ 40%. This month it’s still pretty balanced at 25%/33%/42% but we’ve had two months in a row shifting more bearish.
So Donald Trump is now president. The markets have generally moved up although it seems the media uses Trump’s actions to explain days that are down in the markets.
Next month RJ Hixson will write this report, as I’ll be returning from our Singapore workshops.
Be careful to base your actions upon what IS happening, not what you think might happen. The markets always offer opportunities, but to capture those opportunities, you MUST know what you are doing. If you want to trade these markets, you need to approach them as a trader, not a long-term investor. We’d like to help you learn how to trade professionally because trying to navigate the markets without an education is hazardous to your wealth. All the beliefs given in this update are my own. Though I find them useful, you may not. You can only trade your own beliefs about the markets.
|
|
|
|
FREE Book!
We pay for the book, you just pay for shipping.
Read Van’s Latest Book —
TRADING BEYOND THE MATRIX
The Red Pill for Traders and Investors
Eleven traders tell their stories about transforming
their trading results and lives, in this 400 plus page book.
Below is a brief video on how powerful this book is to traders.
|
|
|
|
|
|
Ken Long's systematic approach to swing trading with 5 distinct trading systems. This course has over 10 hours of instruction with significant follow-along documents included for students to download.
Review the videos as many times, and as often as you like, for one full year. Plus, you receive a bonus workshop at no extra charge—Dr. Van Tharp's Tharp Think Essentials!
You can complete this course at your own pace, from the comfort of your own home or office, and access the materials as many times as you wish during your 1-year subscription period.
|
|
|
|
Take a look at this video from Ken to learn more about this course.
|
|
We have extensive information about the Swing Trading System e-learning course, including how to purchase...click the link below!
|
|
|
|
Cary, NC
For a list of nearby hotels for our Cary, North Carolina locations,
click here.
Book your flight arriving to the Raleigh-Durham International Airport (RDU).
When traveling to a three-day course, it's best to arrive the evening before.
To help determine your arrival and departure times, see:
Questions? Click Here to Ask Van...
CONTACT US
If you no longer wish to receive our email updates, click the unsubscribe link in the bottom-left corner of this email.
This is a supplement to our subscription based newsletter, Tharp's Thoughts.
800-385-4486 * 919-466-0043 * Fax 919-466-0408
|
|
|
|
|