|
|
|
Tharp's Thoughts
Weekly Newsletter
|
|
|
-
Feature: A Strong Buy — All Major USD Currencies Revealing Long-Term Strength, by Gabriel Grammatidis
-
Workshops: Singapore Workshop Finalized! Forex Trading Systems and more...
-
Tip: A Quick Look at Oil, by D. R. Barton, Jr.
-
|
|
|
|
Two Peak Performance 101 Workshops Coming Soon:
One in Cary, NC &
One in Singapore
For the first time, VTI is bringing the
Forex Trading Systems Workshop to Singapore
Check out Gabriel Grammatidis' article below on Forex Trading
|
|
|
|
Van Tharp's Monthly Market Update will be sent to you tomorrow, December 1st, in a special edition of this week's newsletter!
|
|
|
|
A Strong Buy — All Major USD Currencies Revealing Long-Term Strength
by Gabriel Grammatidis
|
|
|
|
Impatience or even euphoria are two emotions most detrimental to trading success. The ability of knowing when to “Stay out of the Market” is one of Van’s Top Tasks of Trading (see Critical trading habit needed). In that last article, I wrote about the prolonged but healthy sideways consolidation in the EURUSD. It lasted for over a year after the EUR had fallen so hard against the USD the year before. With this typical trend-following consolidation about to complete, the USD shows strong bullishness now — it just needed some time-out to regain strength on its further way up. The USD is growing stronger in relation to what? Generally, stronger in relation to many currencies and specifically in relation to the Euro.
EURUSD Continuing Its Long-Term Downtrend
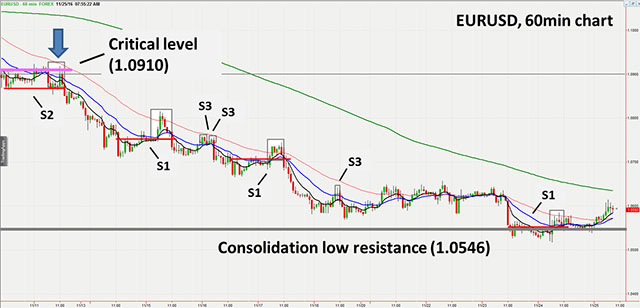
The break of the critical level 1.0910 in the EURUSD pair (see purple line in the chart) created a strong momentum move down to the lower range of the sideways consolidation in the last few weeks (read above article pre-indicating this critical level). The break of 1.0910 has also locked-in the price target of 0.8000. Please be aware this target is more than 2000 pips (or 25%) lower than the current price which offers investors and traders excellent trade opportunities (from the weekly chart down to the 5min chart).
|

|
|
In any case price should not close above the high of the red rejection bar (3rd bar from the right). This very important level was created when the markets learned of the US presidential election results. A lot of market participants were caught on the wrong foot and that price represents an ideal place to put a stop for a long-term position to ride a EURUSD short towards its’ target level.
In the short term, there are two possible price moves:
- Price finds resistance most probably at the consolidation low and will pull back towards the critical level. This would be a healthy pullback — or —
- Price might break through the consolidation low immediately and increase its downward momentum. A failure to pullback from this strong consolidation low would indeed be a sign of a very strong USD.
Multiple EURUSD Trades in November
These last 2-3 weeks offered excellent trading opportunities for all three systems that I trade (and that I teach in the Forex Trading Workshop). Look at the numerous trade setups labeled by system number on the 60min chart below. The grey boxes show each individual trade and indicate entry and initial stop levels. On an hourly basis, more than +10R were available within a few weeks – in just this one pair. This shows the power of trading with the trend in the higher timeframe. Once a higher timeframe gives you a clear directional edge you can easily scale-in building a position-trade or grow a day-trade into a large R swing-trade.
|
|
|
Can you see the weekly consolidation low (the horizontal gray line at 1.0546) representing strong support? The failure of the last S1 pattern to deliver a winning trade at that exact level is a good counter-trend long signal indicating the beginning of an overall pullback (described earlier). Due to the fractal nature of the markets, patterns like this appear regularly in several timeframes with good trends like this. In these kind of conditions, you should definitely trade systems that help you stay “in the markets.”
I am always interested to hear all of the reasons that people use to explain why certain price moves happened (Trump won the election, etc.). I have a strong belief that news does not make price move but that price moves from one level to the next one because of the inherent dynamics of the chart. This is why reading price chart patterns is so important — charts really do tell you what is going on in the markets.
What is the USD Index Doing Now?
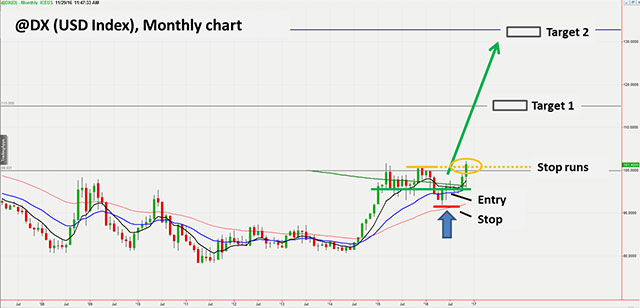
The USD Index is an index calculated as the weighted average of 6 important currencies against the USD (being EUR, JPY, GBP, CAD, SEK and CHF). The USD Index has been calculated since 1973 and is listed as a currency future on the ICE futures exchange. You can also trade the USD Index through the ETF called UUP (Powershares) that tracks the index very well. The Index is said to be a leading indicator reflecting the market dynamics of the Forex market. It just sent out a signal that the Forex market overall is in strongly trending mode again!
For most of the time since 2008, the USD Index has been in a sideways range (see monthly chart below). The up move in early 2015 which broke prior highs was a first sign of a developing uptrend. A one-leg move, however, does not yet make an uptrend. The consolidation that followed formed a long-term setup signal in a classic Busted Breakout pattern (System S1). The entry and stop levels for this long-term trade are indicated in the chart. That trade is currently running for other peoples’ stops above the prior high (see orange line) and the trade is break-even now as a worst case. If a Busted pattern occurs in a beginning trend, it gives you good early signal of a strong trend developing. Target 1 at the 115 level is the projected target coming out of the S1 entry signal. Target 2 above 130 is the more aggressive target that clusters with the high of the USD Index in 2002. These levels act like magnets pulling the price higher.
|
|
Now that the USD Index made a higher high, it is technically in early uptrend mode with a lot of room to go to meet its’ target levels. As an early indication to the Forex market as a whole, this S1 Busted pattern gives traders a high probability that other FX pairs are going into trend mode soon. Get prepared now to trade the multiple Forex trends in the coming months and years. This monthly US Index chart can be a guide to you revealing the trendiness of the FX markets (read more about the many advantages Forex trading offers — Ten Reasons to Trade Forex).
Here’s another currency pair with a high likelihood to start trending again shortly.
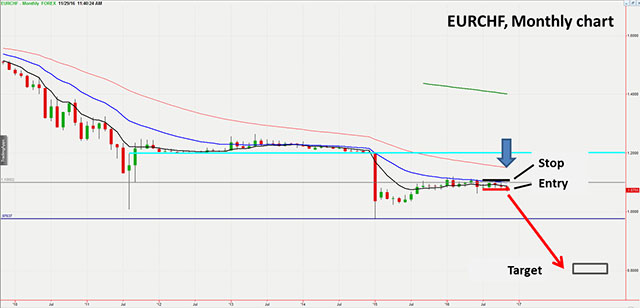
EURCHF — About to Resume Downtrend
EURCHF has been in “refresher mode” for quite some time. If you have been following my articles, you might remember that I outlined the likely scenario after the unpeg occurred about 1½ year ago (see Starting Signal for Extended Currency Trends). The unpeg created a huge move down of the EURCHF in trend direction. That pronounced move, similar in scope to the EURUSD, required price to pause and regain strength again. By now prices have pulled back nicely to the Big number of 1.1000 as well as rejoined with the 21EMA (see monthly chart below).
|
|
|
Actually you can clearly see how the monthly bars have found support and resistance at the 8EMA respecting the 21EMA and how the price bars have become very tight. These signs indicate that the very healthy pullback is nearing its’ end. The rounded consolidation is showing the first signs of ending with the breaking lower of the last small red bar (see red line). This triggered a short entry based on System 3 (3TMA). Being able to set a tight stop protected by the 21EMA above as well as the Big number (1.1000) represents two edges already helping this trade. This pair and the other CHF pairs are back on my list of very promising long-term trends.
Over the coming weeks and months, many excellent short, medium and long-term trading opportunities for low risk Forex trades will present themselves. Now is the time to put together your game plan with multiple edges to profit from these trending currency pairs. Now is the time to more actively stalk the markets for easy to identify low-risk setup patterns. Most of the CAD, JPY and AUD pairs have already been trending nicely for quite some time. Now the USD and CHF pairs are about to join the other pairs in major trend moves.
You can see these long-term trends beginning in the charts above. Whether you want to open investment positions (using the weekly or daily chart), swing trade the 4-hour chart, or day trade the 5 minute charts, the opportunities are going to be plentiful. With these nascent trends, the leverage, the liquidity, and the 24-hour-trading the Forex market offers, you have to ask yourself: why aren’t you trading currencies yet?
(Note: Even if you are not set up to trade Forex yet, you could still trade these trends using currency ETFs. You could short the EURUSD through EUFX or the double leveraged EUO. Likewise, you could simply go long the USD with the ETF symbol UUP. For the EURCHF trade mentioned above, Europeans could short a 5x leveraged EURCHF ETF - though that offering may not be available in other geographies.)
For more information on how to scale-into a trade pyramid (position-trade) or transfer a day-trade into a swing-trade please click here to view my “Trade of the Week” video.
Good trading,
Gabriel Grammatidis
|
|
|
|
|
|
About the Author: Gabriel Grammatidis is a successful full-time trader and graduate of the Super Trader program. He has extensive experience trading Forex and shares his knowledge at his Forex and Live Forex Trading workshops, held regularly at VTI.
For more information on the Busted Breakout psychological dynamics see my article in the Traders´ magazine.
Gabriel can be reached at gabriel "at" vantharp.com.
|
|
|
|
We will be in Singapore in February with Gabriel's Forex Trading Systems and Dr. Tharp's Peak Performance 101.
|
|
|
|
January 2017
Register now before the holiday season gets hectic.
|
|
|
|
Presented by Van Tharp
with co-presenter RJ Hixson
|
|
|
|
January 20-22
Friday-Sunday
|
|
|
|
|
|
|
|
|
|
Presented by Van Tharp
and RJ Hixson
|
|
|
|
January 24-26
Tuesday-Thursday
|
|
|
|
|
|
|
|
|
|
Presented by Gabriel Grammatidis
|
|
|
|
February 18-20
Saturday-Monday
|
|
|
|
|
|
|
|
|
|
Presented by Mr. Gabriel Grammatidis
|
|
|
|
February 21-22
Tuesday-Wednesday
|
|
|
|
|
|
|
|
|
|
|
|
February 24-26, 2017
Friday-Sunday
|
|
|
|
|
|
|
|
|
|
Presented by R. J. Hixson
and Kirk Cooper
|
|
|
|
|
|
|
|
|
|
|
More 2017 dates will be announced soon!
Other first quarter selections will likely include How to Develop Winning Trading Systems, Trading in Bear and Down Markets, plus more Advanced Peak Performance offerings. More information will be available soon.
|
|
|
|
A Quick Look at Oil
by D. R. Barton, Jr.
|
|
|
|
|
As a young boy, I rode around a lot in the back of my family’s 1968 Ford Torino Squire station wagon. In case you don’t remember what that car looks like, here’s an image of that vehicle courtesy of Wikipedia.com —
|

|
|
Ah, those were the days (before the ubiquitous “SUVs” came on the scene).
Our license plate ended in an odd number and for those of you who lived through late 1973 here in the US, you might remember what that meant. We could only buy gasoline on odd number days. That was the time of the OPEC (Organization of Petroleum Exporting Countries) oil embargo against the U.S., the Netherlands and Denmark. Here’s a very short version of why that happened.
In October of 1973, Egypt and Syria launched a joint military attack against Israel. After suffering preliminary losses, Israel turned the tide of battle with a U.S. airlift of weapons plus military assistance from Denmark and the Netherlands. Not only did Israel reclaim lost ground, it also took additional territory and refused to withdraw. So OPEC, which was (and is) dominated by Arab nations, decided to protest by drastically increasing the price of oil to punish Israel and its allies. The price of oil increased 70% and then to 130% before OPEC imposed a complete embargo on the U.S., Denmark and the Netherlands.
When all was said and done, gas prices had quadrupled over their former levels. As a result, the U.S.’s energy policy would radically change. All I knew at the time, though, was I had to sit in the back of that station wagon freezing my tail off while my mom waited in line on odd numbered days — sometimes for hours — just to buy gas.
So it’s little surprise that I have not been saddened as OPEC’s influence has waned over the years. In fact, they perhaps hit a recent low in pricing power since their “pump-at-will” policy was put into effect in 2014. Today’s announcement that they’ve reached agreement to limit production is, in part, an effort to regain some of their pricing clout. Markets have responded with the price of oil soaring more than 8 percent.
Lots of Bluster, Not Much Substance
I’m not buying that these price gains are going to last. Let me tell you several reasons why.
Start with this first: OPEC faces increasing trouble making consensus decisions. With Iraq and Iran regaining influence in the organization, OPEC can no longer play the old game of “What Saudi Arabia wants, happens”.
Second, and perhaps most importantly, OPEC just agreed to cut production — from all-time high levels. For example, Saudi Arabia will cut production to 10.058 million barrels a day, which is roughly their production levels for the first half of 2016. From April 2016 to June of 2016, production ramped from 10.24 MM barrels per day to 10.54MM.
Third, OPEC’s share of global production is down to around 40% (according to the U.S. Energy Information Administration). The organization still has a strong influence on the price of oil — but it is far from having monopolistic pricing powers.
Lastly, OPEC has agreed to limit production to 32.5 MM barrels per day. Compare that number to the 31.8 MM barrels per day that balances current supply and demand. Any production number above 31.8MM will continue to generate a surplus of supply – that’s not a recipe for a sustained bullish price charge.
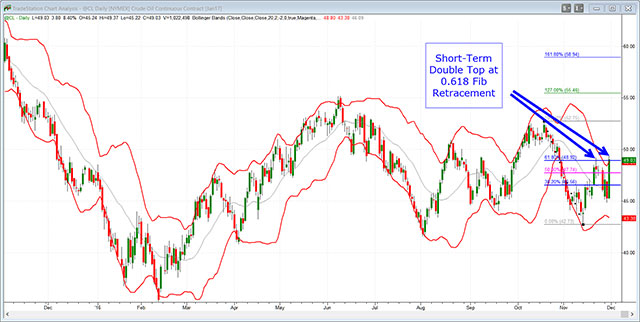
What Does the Price Chart Say?
When we look at the current daily price chart for the crude oil contract (CL), we see that we’re at a key short term resistance level right now:
|
|
|
That double top at a fib ratio is not a sign of bullish strength. In fact, if this price action holds into the afternoon (Wednesday), I’m much more likely to short this market (again) rather than stay neutral.
So for a host of fundamental and technical reasons, you can see why I don’t believe that oil is making any modest move up.
Finally, if anyone has memories (fond or otherwise) from the days of the oil embargo in 1973, drop me a note. What do you remember? Please send those thoughts and comments to drbarton “at” vantharp.com — I always appreciate hearing from you!
Great Trading,
D. R.
|
|
|
|
FREE Book!
We pay for the book, you just pay for shipping.
Read Van’s Latest Book —
TRADING BEYOND THE MATRIX
The Red Pill for Traders and Investors
Eleven traders tell their stories about transforming
their trading results and lives, in this 400 plus page book.
Below is a brief video on how powerful this book is to traders.
|
|
|
|
Save Over $500, For A Limited Time Only
|
|
|
|
|
|
Ken Long's systematic approach to swing trading with 5 distinct trading systems. This course has over 10 hours of instruction with significant follow-along documents included for students to download.
Review the videos as many times, and as often as you like, for one full year. Plus, you receive a bonus workshop at no extra charge—Dr. Van Tharp's Tharp Think Essentials!
You can complete this course at your own pace, from the comfort of your own home or office, and access the materials as many times as you wish during your 1-year subscription period.
|
|
|
|
Take a look at this video from Ken to learn more about this course.
|
|
We have extensive information about the Swing Trading System e-learning course, including how to purchase...click the link below!
|
|
|
|
Cary, NC
For a list of nearby hotels for our Cary, North Carolina locations,
click here.
Book your flight arriving to the Raleigh-Durham International Airport (RDU).
When traveling to a three-day course, it's best to arrive the evening before.
To help determine your arrival and departure times, see:
Questions? Click Here to Ask Van...
CONTACT US
If you no longer wish to receive our email updates, click the unsubscribe link in the bottom-left corner of this email.
This is a supplement to our subscription based newsletter, Tharp's Thoughts.
800-385-4486 * 919-466-0043 * Fax 919-466-0408
|
|
|
|
|


