|
|
|
Tharp's Thoughts
Weekly Newsletter
|
|
|
-
Feature: President Elect Donald Trump! What Happened and Why? by L. Michael Hall
-
Workshops: Singapore Workshop Dates Finalized! Register Now!
-
Tip: Keep Things in Perspective — 500+ Years of Stock Market Advances, by D. R. Barton, Jr.
-
|
|
|
|
Workshop e-Courses Reduced More Than 20% Off,
During This Special Promotion
|
|
|
|
E-LEARNING SYSTEMS WORKSHOPS
Priced for extra savings!
|
|
|
|
Streaming — Instant Delivery
Ken Long's systematic approach to swing trading with 5 distinct trading systems. This course has over 10 hours of instruction with significant follow-along documents which you can download. Review the videos as many times and as often as you like for one full year. Plus, you receive a bonus workshop at no extra charge — Dr. Van Tharp's Tharp Think Essentials (when sold separately it's $1,295)! ...more info
$2,540 On Sale $1,999
|
|
|
|
Streaming — Instant Delivery
Would you like your money to make money—even when the market goes down? You can! And it could take as little as a few minutes or less per week. Learn low-maintenance systems to earn consistent returns using longer-term trading systems.With nearly 7 hours of video and downloadable companion documents you'll learn these systems in your own space. ...more info
$1,295 On Sale $995
|
|
|
|
President Elect Donald Trump! What Happened and Why?
By L. Michael Hall
|
|
|
|
Note from Van — I have been absolutely shocked that people have been protesting the results of the presidential election for the last week. Trump won fair and square in a democratic process. So why the extreme reaction? Well, Dr. Michael Hall explains it in the following article that he wrote last week on Nov. 10. While some of my staff thought this article was “political”, I don’t see it that way at all. Much of the same below could be said if Dr. Hall was explaining any protests had Clinton won the election instead.
In reality, various reactions to this article just show the power of language and the thought process (which you can’t express without language). As you read what Michael Hall wrote, monitor how you interpret his observations and conclusions. What words do you use and meanings do you assign to your thoughts and feelings? After reading, consider if you viewed this more as a political piece or more as an analysis of the election in the context of NLP and neuro-semantics. In either case, Dr. Hall expresses his beliefs about the election and the reactions to it. You may or may not find his beliefs useful.
On a related note, Oneness conducted a collective prayer for the election. To me, that said we would accept the 'what is' of the election — no matter what happened. We would trust in the divine. Now some of the people who organized the collective prayer are wanting to reform the electoral college. To me, that's not trusting the divine.
|
|
When America woke up on November 9, many people were shocked! Many were depressed and upset, others frustrated and even angry. Why? The person they thought and expected to be elected was not. She lost. The person that they never ever seriously thought had a chance at the Oval Office was elected. Shocking! Astonishing. So what happened? And why?
I'm writing this post in an attempt to try to explain what happened and why, and to do so especially for people outside of the United States. What follows is my view and does not represent anyone else. It is not a policy statement for anyone. It is solely my personal view. Since November 9 many have written asking how did that happen, what it means, why there are protests, etc. I think that there are several explanatory facts. If you don't like my opinion, that's perfectly fine. You have that right as I do.
Explanatory factor number one: The way the media mis-handled the news. Almost all of the media was for Hillary and against Trump. Now true enough, they presented most of the facts (maybe 80 to 85% of them) about the events of the campaigns, but facts alone are never enough. Facts always have to be interpreted. And interpret they did - the spin that 90 to 95 percent of the media put on the facts created an impression against Trump and for Hillary. The negative stories on the news and in print against Trump was overwhelming. I have heard that it was 70% to 80% negative for Trump and only 20% negative for Hillary. That spin biased the news.
CNN was especially biased against Donald Trump and I experienced that in every single country that I have traveled during the campaign, some 30 or so countries. The news I heard when I was away from the US was completely different from what I heard at home. When I talked with people about American politics, what they heard and what I had learned at home were completely different. I eventually started saying early this year (2016) that "just about everything you have heard in the news about Trump is wrong." And it was. It was taken out of context, it was exaggerated, it was given negative spin. Half of the American population discovered that on November 9. They were absolutely shocked because the media bias had set them up for a disappointment.
Second explanatory fact: The "message" that the Democratic candidate put out. During the campaign Hillary painted Donald Trump as being so bad, so evil that people were absolutely convinced that he was a bigot, hateful, that he would be a dictator like Hitler, etc. No wonder her people are now protesting! If Hitler had been elected, I would be protesting too! But what are they protesting? They can't be protesting the democratic process. A free election process? The peaceful transfer of power? Actually, the protesting is an unthinking reaction to the framing rhetoric of Hillary Clinton. But it was just rhetoric - the extreme language that both candidates used as they painted the other one as the embodiment of evil. But it was all just words. Not reality. Yet some people don't seem to
know that.
For months I have been objecting to the way both candidates talked about the other. Both used what we call "cognitive distortions" - exaggerations, over-generalizations, personalizing, awfulizing, emotionalizing, etc. That's not good. Many people do not know how to process that kind of language. They think it is real! They don't know that these childish kinds of words create cognitive biases and distortions and prevents clear thinking! It sells papers. It gets notice on the evening news. But it is childish, immature, and psychologically debilitating. In therapy, in counseling, in trainings, and in coaching- we warn people against that kind of language. In NLP, the Meta-Model of Language is a model designed to challenge and question that kind of language and enable people to clean up
their language patterns.
Both of the candidates should have known better! But "political speech" in 2016 seems to be full of it and the US elections is a riot of mis-languaging. So no wonder people without training, believing the words and getting into cognitive distorted states of mind-and-emotion are out on the streets protesting. It is an inevitable result of the kind of language that was put out.
Third explanatory factor, the division and polarization of the country. A divide of values, understandings, lifestyles, etc. has been dividing Americans for a couple decades. It got much, much worse in 2008 when Obama was elected and in spite of him wanting to unify the country, the country has become much more divided. In terms of unifying the country, he failed. And now at the end of his presidency, there is a deeper divide than has been in decades. The deepening of that division then showed up in the election in terms of the vision of the future that each candidate presented. Today, that division is deeper than ever.
Two visions of the future of America emerged during the election and these different visions defined the campaigns. One is an increasingly socialistic state wherein the government would take more and more responsibility and control of people's everyday life - regulating things, managing things, etc. A vision of centralization. The other vision is a vision of a smaller government and control being more local - with states and cities. One vision struck me as that of entitlement and the other of personal responsibility.
My own politics is for smaller government, more local government, and more personal responsibility. I vote for more choice, not less. I prefer to let people choose the way they want to live and be responsible for their choices rather than trying to control them. For social issues I prefer the liberal and libertarian point of view. About financial issues, I opt for running government as we do our personal finances and businesses - pay for what you buy and fiscal responsibility.
Today (November 10) Obama and Trump met at the White House and talked for an hour-and-a-half and described the peaceful transfer of power. That's the way it should be. So let us be stronger together and make American great again!
|
|
|
|
|
About the Author: Dr. Hall is known as a prolific writer with 30 some books to his name, more than 100 published articles and is recognized as a leading NLP Trainer and developer of many models, most notably the revolutionary Meta-States model and more recently the Matrix model. Learn more...
This article was published with permission. 2016 Neurons #53. President Elect Donald Trump-- What Happened and Why? (L. Michael Hall)
|
|
|
|
Announcement: We will be in Singapore in February
|
|
|
|
Exclusive Event for Super Traders, December 3-12
Dec 3-4 SUMMIT • Dec 6-8 Systems Thinking • Dec 10-12 Oneness Turbo
|
|
|
|
|
January 2017
Register now before the holiday season gets hectic.
|
|
|
|
Presented by Van Tharp
with co-presenter RJ Hixson
|
|
|
|
January 20-22
Friday-Sunday
|
|
|
|
|
Presented by Van Tharp
and RJ Hixson
|
|
|
|
January 24-26
Tuesday-Thursday
|
|
|
|
|
Presented by Gabriel Grammatidis
|
|
|
|
February 18-20
Saturday - Monday
|
|
|
|
|
Forex Live Trading Sessions
Presented by Gabriel Grammatidis
|
|
|
|
February 21-22
Tuesday - Wednesday
|
|
|
|
|
|
|
February 24-26
Friday - Sunday
|
|
|
|
|
More 2017 dates will be announced soon!
Other first quarter selections will likely include How to Develop Winning Trading Systems, Trading in Bear and Down Markets, plus more Advanced Peak Performance offerings. More information will be available soon.
|
|
|
|
Keep Things in Perspective — 500+ Years of Stock Market Advances
by D. R. Barton, Jr.
|
|
|
|
|
Last week I showed you some stock index charts that tracked the U.S. election return voting results that came in overnight on Nov. 8 on an hour-by-hour basis.
Today, let’s take a step back for some perspective, a really l-o-o-o-ng term perspective.
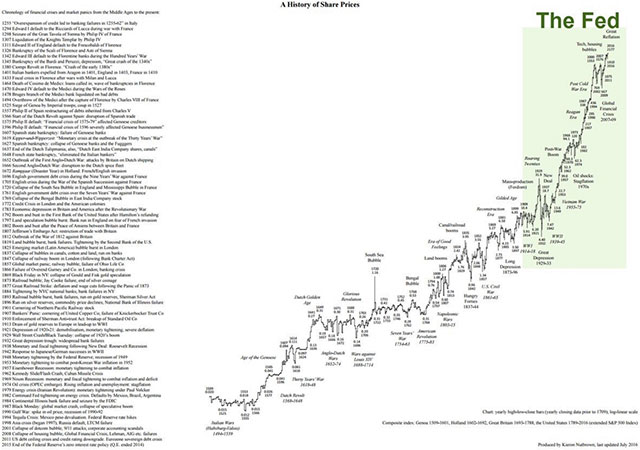
Cool Chart Alert
A chart attributed to Kieron Nutbrown, former head of global macro trading for First State Investments in London was reposted on stocktwits.com. The chart shows a history of stock markets dating back to 1509. Fair warning — some of the type is pretty small so here’s a link where you can see a slightly larger version:
http://charts.stocktwits.com/production/original_65760447.?1477665448
For now, let’s talk look at the chart (from afar!), inspect some of its neater features, and then discuss its ramifications.
|
|
Chart Highlights
Let’s look at some of the features of this data-rich chart:
|
- It starts in 1509 and travels through to the present – that’s 508 years of stock history!
- Because the print is so small, I’ll list the stock markets that were tracked for various periods:
- 1509 – 1601: Genoa
- 1602 – 1692: Holland
- 1693 – 1788: Great Britain
- 1789 – 2016: Extended S&P 500 Index
- The chart is a log – linear scale.
- That means the time scale is linear but…
- …the price scale is logarithmic
- Chartists employ this type of scale when the data varies by many orders of magnitude. For example, the difference between the lowest and highest prices on the chart is a multiple of 181,417!! If you put that data on a linear chart, everything up until the Reagan presidency (on the far right) would be a flat line with a few squiggles.
- The list of events on the chart and along the left edge are a fascinating walk back through the financial history of the western world.
|
|
So What?
Well, lots of people are very concerned over the incoming president and the possibility of a Fed rate hike (a hike that is gaining in probability by the day). This chart reminds us, however, that no matter what kind of bumps in the road are hit, a globally expanding economy (driven by a growing population and ever increasing technology advances) will continue its inexorable drive from the lower left corner of the page to the upper right corner.
So what can we take away from seeing 500 years of stock market prices on one chart?
- Be involved in the big moves up.
- Get out of the way of the big moves down (with a solid plan to re-enter).
- . . . And don’t stress out over the small stuff.
Please send your thoughts and comments to drbarton “at” vantharp.com – I always appreciate hearing from you!
Great Trading,
D. R.
|
|
|
|
|
|
About the Author: A passion for the systematic approach to the markets and lifelong love of teaching and learning have propelled D.R. Barton, Jr. to the top of the investment and trading arena. He is a regularly featured analyst on Fox Business’ Varney & Co. TV show (catch him most Thursdays between 12:30 and 12:45), on Bloomberg Radio Taking Stock and MarketWatch’s Money Life Show. He is also a frequent guest analyst on CNBC’s Closing Bell, WTOP News Radio in Washington, D.C., and has been a guest on China Central Television — America and Canada’s Business News Network. His articles have appeared on SmartMoney.com MarketWatch.com and Financial Advisor magazine. You may
contact D.R. at "drbarton" at "vantharp.com".
|
|
|
|
FREE Book!
We pay for the book, you just pay for shipping.
Read Van’s Latest Book —
TRADING BEYOND THE MATRIX
The Red Pill for Traders and Investors
Eleven traders tell their stories about transforming
their trading results and lives, in this 400 plus page book.
Below is a brief video on how powerful this book is to traders.
|
|
|
|
Save Over $500, For A Limited Time Only
|
|
|
|
|
|
Ken Long's systematic approach to swing trading with 5 distinct trading systems. This course has over 10 hours of instruction with significant follow-along documents included for students to download.
Review the videos as many times, and as often as you like, for one full year. Plus, you receive a bonus workshop at no extra charge—Dr. Van Tharp's Tharp Think Essentials!
You can complete this course at your own pace, from the comfort of your own home or office, and access the materials as many times as you wish during your 1-year subscription period.
|
|
|
|
Take a look at this video from Ken to learn more about this course.
|
|
We have extensive information about the Swing Trading System e-learning course, including how to purchase...click the link below!
|
|
|
|
Cary, NC
For a list of nearby hotels for our Cary, North Carolina locations,
click here.
Book your flight arriving to the Raleigh-Durham International Airport (RDU).
When traveling to a three-day course, it's best to arrive the evening before.
To help determine your arrival and departure times, see:
Questions? Click Here to Ask Van...
CONTACT US
If you no longer wish to receive our email updates, click the unsubscribe link in the bottom-left corner of this email.
This is a supplement to our subscription based newsletter, Tharp's Thoughts.
800-385-4486 * 919-466-0043 * Fax 919-466-0408
|
|
|
|
|